Classification of Kinematic Golf Putt Data with Emphasis on Feature Selection Ulf Jensen and Bjoern Eskofier Digital Sports Group, Pattern Recognition Lab, University of Erlangen-Nuremberg, Germany {ulf.jensen,bjoern.eskofier}@cs.fau.de
Abstract The complex movement sequences of golf require supporting tools for players and coaches alike. We developed a system that classifies the experience level and trained it with data from an inertial sensor on the club head. Based on 315 golf putts from eleven subjects the system differentiated between experienced and unexperienced players with a classification rate of 86.1%. To improve the classification system and obtain discriminant features we additionally integrated a feature selection step. We compared different selection approaches and concluded that a leave-subject-out feature selection was the appropriate approach to predict the true performance of a live system. The selected features can be fed back to coaches and help them to guide players to a better putting technique.
1. Introduction In the last decade golf made its way to a popular sport and drew even more attention since the acceptance for the olympic program for 2016. Golf is also demanding complex movement sequences from players in order for them to be successful. For this reason, supporting tools for players and coaches on a professional but also on a recreational level are required. This is a challenging task due to the high amount of kinematic parameters that have to be considered during a swing or a putt. In this process, individual techniques of different athletes have to be accounted for. The most relevant but also generalizable parameters are therefore of great interest. Players need coaching systems to train effectively and coaches need support tools for their coaching tasks. In golf putting, many different modalities like ultra-sound data [11], 3D motion data [3], pressure mat signals [13] and camera-based golf club tracking [10] have been successfully used for performance optimization and biomechanical analysis. However, the largest drawback of these systems is the stationary nature. This often limits them to laboratory use and offline analysis.
Frank Dassler adidas Group, Herzogenaurach, Germany
[email protected]
In this paper, we will focus on golf putting in a natural environment using mobile inertial sensors. Kinematic and biomechanical aspects of putting are well studied [10, 3, 8, 14, 13]. There has also been research on inertial sensor data analysis in golf [1, 9]. Anyhow, these systems are still in the evaluation phase. We are also not aware of any research on classifying kinematic golf putt sensor data and automated support in selecting relevant parameters from these data. Previously, we implemented a mobile coaching application for putting that gives graphical and textual coaching feedback for every putt [7]. However, this expert-driven approach required prior knowledge about the putt parameters and common errors in the putting technique. We therefore present a data-driven pattern recognition approach to classify the experience level and select discriminant features to enhance the coaching application. Our algorithms need to be well generalizable for unknown subjects. We addressed this need with an adapted approach in the feature selection step to improve the classification rate and identify discriminant features. This approach may be useful for all live systems that deal with unknown subjects. The obtained features can be further interpreted by golf coaches to pinpoint technique shortcomings.
2. Methods We used the same hardware, data collection, preprocessing and feature extraction as for the development of our mobile coaching application [7]. We will recapitulate the most important aspects.
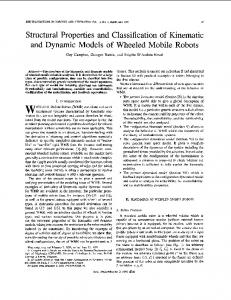
2.1. Hardware Our recording hardware comprised of SHIMMERTM sensor nodes [12] and a laptop for data recording and analysis. The sensor nodes were equipped with an internal three-axis accelerometer and a connected three-axis gyroscope module. The firmware was set to a sampling rate of 250 Hz to record kinematic data of six degrees of freedom. Data were sent wirelessly to the recording
Table 1. Overview of complete features set (BS: back swing, FS: forward swing, FT: follow-through).
Figure 1. Placement and form factor of the SHIMMER sensor used in our system. laptop. We mounted a single sensor on each of the golf clubs used in our study as illustrated in fig. 1.
2.2. Data collection We collected data on an even outdoor training green at the Golf Club Herzogenaurach, Germany. Eleven right-handed subjects (1 female, 10 male) volunteered for the study. They were either experienced golfers (n=5, handicap 17 ± 12) or completely unexperienced. Each subject performed five consecutive putts from three distances (short = 1m, mid = 3m, long = 5m) in the common putting range to collect 15 putts each. Moreover, we provided two mallet type putters: the TaylorMadeTM Spider (TaylorMade Inc. Carlsbad, USA) and the Pro AceTM 20704 (Pro Ace Ltd., London, UK) and two different ball types, the TaylorMade Noodle Longest and Burner LDP. We arbitrarily chose an equipment variation for each subject so that we recorded a second collection of 15 putts each with either another ball or club. We had to eliminate three sequences of five putts because of sensor malfunction so that we could use 315 putts for our further analysis.
2.3. Preprocessing and feature extraction We used a matched filter segmentation algorithm to extract putts from the experiment data. This algorithm considered a linear and a rotational movement in playing direction according to a basic putt model. This model also defined the main phases of a putt stroke used in the feature extraction. See Tab. 1 for a summary of the feature set for each putt. All features were normalized for further processing.
2.4. Classification The goal of the classification was to determine the experience level prediction capability of a classifier using a single putt. The ”No-Free-Lunch” theorem states that there is no classifier that outperforms others in every classification problem [4]. We therefore tried a range of classifiers with different paradigms. See Tab. 2 for an overview of classifiers that we used. All experiments were conducted with custom MatlabTM (The
Nr. 1-4,7 5-6 8-10 11-13 14-16 17-19 20 21-22 23-24 25-26 27-28
Description Duration of {BS, FS, BS+FS, FT, putt} Temporal ratio of {FS&FT, BS&FS} Rotation in BS and FS (x-, y-, z-axis) Rotation in pre impact phase (x-, y-, z-axis) Rotation in post impact phase (x-, y-, z-axis) Rotation angle in {BS, FS, FT} Rotation angle ratio of FS and FT Acceleration change in {pre, post} impact phase Velocity on impact (rotation, horizontal) Acceleration maximum in FS (position, value) Velocity maximum in FS (position, value)
Mathwork Inc., Natick, USA) software. We used existing pattern recognition libraries for classifier evaluation. These were PRTools (Version 4.1) [5], STPRtool (Version 2.11) [6], LIBSVM (Version 3.0) [2] and the GML AdaBoost Matlab Toolbox (Version 0.3) [16]. The kNN and SVM classifiers demand to choose parameters. We optimized them with an exhaustive search strategy. We searched in the range of k = [1, 10] for the kNN classifier and in the range of C = 2n , n ∈ [−1, 3] for the SVM. In the case of the SVM-rbf kernel we used γ = 2m , m ∈ [−4, 1] additionally.
2.5. Classifier evaluation We evaluated the classifiers listed in Tab. 2 with a leave-one-subject-out cross-validation. In this procedure, classifiers were tested on all putts of a single subject. This made sure that we obtained a realistic value for the classifier performance for the putt of an unknown subject. We averaged the result of each subject evaluation to determine the overall classification rate. For the classifiers with free parameters, we repeated the evaluation for each parameter. We selected the parameter resulting in the best result. This procedure expanded to a grid search for the SVM-rbf case.
2.6. Feature selection There were three reasons why we used a feature selection step in our system. First, a reduced feature set decreases the computational cost in the classifier working phase. This is particularly important in the context of embedded and mobile classification. Second, selected features can increase the classification rate and the generalization capabilities of a classifier [15]. Third, discriminant features can support coaches in the functional interpretation of class differences. We applied a sequential forward feature selection [15], a simple wrapper technique. We used the corresponding classification rate as criterion for the evaluation of a candidate feature set. We applied the feature selection in each subject evaluation step.
3. Results
Figure 2. Overview of the partitioning for the feature selection approaches TT and LSO in one subject evaluation step. The classification procedure was the same in each of the following experiments. We performed eleven crossvalidation steps for our dataset of eleven subjects. In each step one subject was used as test subject while all others were training subjects. We evaluated the influence of the feature selection on the classification performance with three experiments that differed in the way features were selected. 1. Complete Feature Set (ALL): We used the complete feature set for classification and applied no feature selection. 2. Training-Test Feature Selection (TT): Each candidate feature set was evaluated in a training-test manner. The data partitioning was the same for feature selection and classification. The test subject therefore influenced the feature selection as it was used to evaluate a candidate set. 3. Leave-Subject-Out Feature Selection (LSO): Each candidate feature set was evaluated with a leavesubject-out cross-validation. In the feature selection, the training set determined the performance of a candidate set with leave-subject-out crossvalidation. The test subject was not used in the feature selection step. It only served as test subject in the classification step. See Fig. 2 for an overview of the different feature selection approaches displayed for one subject. This procedure was repeated for each subject. The classification step, which was identical for both approaches, is displayed to point out the different roles of the subjects in feature selection and classification. Note that the classification test subject was not used during feature selection in the LSO approach and therefore labeled as hold-out subject.
2.7. Feature occurrence analysis The feature selection delivered one feature set for each subject evaluation. We analyzed the number of appearances of a feature in the eleven resulting sets for the best performing classifier. We considered features with more than six occurrences for further interpretation.
The classification results are listed in Tab. 2. We used k = 7 for kNN, C = 0.5 for SVM-linear and C = 2, γ = 0.125 for SVM-rbf. We applied the same parameters to all experiments. The NB classifier performed best and outperformed FLD in the ALL experiment. In the TT experiment, all classifiers performed well with no prominent differences in performance. The kNN classifier performed best in the LSO experiment and outperformed NB. Regarding the influence of the feature selection approaches, we detected a rise in the classification rate for all classifiers with the TT approach. With the LSO approach, kNN improved, Ada, SVM-linear and SVM-rbf remained unchanged and FDA and NB degraded. We performed a feature occurrence analysis of the kNN classifier in the LSO experiment. Two features were chosen most often by the feature selection algorithm. These were the feature number 4 with eleven occurrences and feature number 9 with ten occurrences. Table 2. Overview of classification rates for different experiments in [%]. Classifier AdaBoost (Ada) Fisher-LDA (FLD) k Nearest Neighbor (kNN) Naive Bayes (NB) SVM-linear SVM-rbf
ALL 76.7 82.4 68.4 86.1 78.8 80.1
TT 98.6 100 99.3 97.5 98.9 98.9
LSO 76.6 66.6 85.5 80.2 77.1 79.6
4. Discussion The results revealed that our system was able to differentiate between putts from experienced and unexperienced players with high classification rate. One has to keep in mind that we performed the classification on a putt basis. That means that our system was able to predict the class membership using a single putt from an unknown subject. The classification rates in the TT experiment implied that every classifier was able to find a suitable feature set for classification. As the knowledge of the test data influenced the selection decision, this was not surprising and resulted in over-fitting of the decision boundary. In the LSO experiment this was not the case. The classifiers that improved or remained unchanged were able to select feature sets and build classifier models that generalized well. This fact was responsible for the good performance on unknown data. Other classifiers degraded without the knowledge of the test data in the feature selection step. In our opinion, the LSO feature selection reflected best the working phase of a coaching system. A classifier with feature selection is trained offline on
a finite training set and has to classify unknown subjects only with the knowledge of this training set. This procedure was simulated with the LSO experiment and therefore delivered more accurate predictions of the true performance of the classifier. Except kNN, all classifiers failed to improve their classification rate with the LSO feature selection approach. However, the classifiers which remained unchanged reached the same classification performance with a feature space of lower dimensionality and therefore with less computational cost in the classifier working phase. NB delivered the best results in the ALL experiment. We suppose that the assumption that the likelihood functions are normally distributed held in our dataset. The improvement of the kNN classifier regarding the ALL and LSO experiment was remarkable. We assume that the euclidean distance separated patterns from different classes better in lower dimensions. This phenomenon is described as the curse of dimensionality. In the LSO case, feature selection lead to an easier and more generalizable class prediction. However, the working phase of the classifier is prone to high demands in memory and computations as all training patterns have to be saved and used for the distance computation. This is especially important in the context of mobile and embedded classification. We found a decrease in the classification rate of classifiers based on statistical properties of the data (FLD, NB) in the LSO experiment. We speculate that this was due to the fact that an inaccurate estimation of statistical parameters was compensated in higher dimensions and had a more severe influence in lower dimensions. We propose that a different feature selection procedure for these classifiers is more suitable. Instead of our wrapper approach we recommend feature selection based on statistical properties of the data in this particular case. The occurrence analysis of individual features can be used for a functional interpretation of the differences between experienced and unexperienced players. The features that appeared most often were the ones discriminant for the specific classification problem and classifier. We chose to discuss the results for the kNN classifier from the LSO experiment where we identified two parameters. These were the duration of the follow-through (4) and the summed rotation in the main rotation axis in back and forward swing (9). During experiments we observed that all subjects used a pendulum or body putting technique described in [13]. The discriminant features proved a different follow-through characteristic combined with a different relative loft angle. Golf coaches can use this functional feedback for further analysis. This can support their coaching and error analysis.
This classification system is a valuable analysis tool for kinematic data from mobile inertial sensors and can furthermore support coaches in efficient training.
5. Acknowledgements The authors would like to thank the Golf Club Herzogenaurach e.V. for allowing access to their training green for the purposes of our study and all participants who volunteered in the study. This work was funded by the Bavarian Ministry for Economic Affairs, Affairs, Infrastructure, Transport and Technology and the European Fund for Regional Development.
References [1] R. Burchfield and S. Venkatesan. A Framework for Golf Training Using Low-Cost Inertial Sensors. In Proc. of the International Conference on Body Sensor Networks (BSN 2010), pages 267–272, Singapore, 2010. [2] C.-C. Chang and C.-J. Lin. LIBSVM: A library for support vector machines. ACM TIST, 2(3):1–27, 2011. [3] D. Delay et al. Movement control in golf putting. Hum Movement Sci, 16(5):597–619, 1997. [4] R. O. Duda et al. Pattern Classification. WileyInterscience, 2000. [5] R. Duin et al. PR-Tools 4.1, A Matlab Toolbox for Pattern Recognition, Downloaded: 02/13/2012. http://prtools.org. [6] V. Franc and V. Hlav´acˇ . Statistical pattern recognition toolbox for Matlab, Downloaded: 02/13/2012. http://cmp.felk.cvut.cz/cmp/software/stprtool/. [7] U. Jensen et al. Sensor-based Instant Golf Putt Feedback. In Proc. of the International Symposium on Computer Science in Sport (IACSS 2011), pages 3–6, Shanghai, 2011. [8] J. Karlsen. Performance in golf putting. PhD Thesis, The Norwegian School of Sport Sciences, 2010. [9] K. King et al. Wireless MEMS inertial sensor system for golf swing dynamics. Sensor Actuat A-Phys, 141(2):619–630, 2008. [10] S. J. Mackenzie and D. B. Evans. Validity and reliability of a new method for measuring putting stroke kinematics using the TOMI system. J Sport Sci, 28(8):891–899, 2010. [11] C. Marquardt. The SAM PuttLab: Concept and PGA Tour Data. Int J Sports Sci Coach, 2:101–120, 2007. [12] M. J. Mcgrath and T. J. Dishongh. A Common Personal Health Research Platform SHIMMERTM and BioMOBIUSTM . Intel Tech J, 13(3):122–147, 2009. [13] P. McLaughlin. Kinematic and centre of pressure (COP) parameters in golf putting. PhD Thesis, Victoria University, 2008. [14] G. Paradisis and J. Rees. Kinematic Analysis of Golf Putting for Expert and Novice Golfers. In Proc. of the International Symposium on Biomechanics in Sports (ISBS 2000), pages 325–328, HongKong, 2000. [15] S. Theodoridis and K. Koutroumbas. Pattern Recognition, Fourth Edition. Academic Press, 2008. [16] A. Vezhnevets. GML AdaBoost Matlab Toolbox, Downloaded: 02/16/2012. http://www.inf.ethz.ch/personal/vezhneva/#code.