Classification using a Hierarchical Bayesian Approach Charles Mathis Thomas Breuel
[email protected] [email protected] Document Image Decoding Group, Xerox PARC, Palo Alto, CA, USA
Abstract
additional, unobserved variable s (speaker, style, etc.), constant within each batch, that the likelihood function depends on ` = P (x|ω, s). If we are given a batch of unclassified samples x = x1 , . . . , xn , the Bayesian optimal classification ω = ω1 , . . . , ωn then becomes: Z Y ω ˆ (x) = arg max P (xi |ωi , sb )P (ωi )P (sb )dsb
A key problem faced by classifiers is coping with styles not represented in the training set. We present an application of hierarchical Bayesian methods to the problem of recognizing degraded printed characters in a variety of fonts. The proposed method works by using training data of various styles and classes to compute prior distributions on the parameters for the class conditional distributions. For classification, the parameters for the actual class conditional distributions are fitted using an EM algorithm. The advantage of hierarchical Bayesian methods is motivated with a theoretical example. Severalfold increases in classification performance relative to style-oblivious and style-conscious are demonstrated on a multifont OCR task.
ω1 ...ωn
Here, sb is a single style variable for the entire batch. Let us use a parametric form for the distribution P (x|ω, s), say D(x; θ) = D(x; θω (s)) (below, D will be a Gaussian distribution, but it could be a mixture of Gaussians or a multilayer perceptron). Then Z Y ω ˆ (x) = arg max D(xi ; θωi (sb ))P (ωi )P (sb )dsb ω1 ...ωn
1
i
Introduction
i
Various approaches have been proposed for modeling the dependence of θω on s. In style constrained modeling for OCR [8], s comes from a discrete set of styles, resulting in a collection of parameter values θω,s . If training data is labeled with both class and style, the individual θω,s can be modeled directly. If style data is absent at training time, the problem of determining the θω,s becomes one of mixture density estimation. In speech recognition, a somewhat more general model is adopted that allows for linear interpolation among parameter vectors, resulting in models like P θω (s) = λi (s)θω,i . Here, the λi are estimated for each speaker or condition using maximum likelihood linear regression (MLLR) [7]. In control and robotics problems, θω is assumed to be time dependent and follow some dynamic model (deterministic or stochastic); methods like the Kalman filter are used for updating an estimate of θω over time. What these models have in common is a fairly constrained form of adaptation of the parameters θω to different styles or conditions. While such constrained models may lead to better recognition within the training set, they also restrict the ability of such methods to generalize outside the training set. The work presented in this paper grows out of a more complex approach to generalization outside the
In many classification problems, samples to be classified are not just drawn randomly from a global sample distribution but come in batches. Two samples of the same class found within a batch are more similar to each other than two arbitrary samples of the same class drawn from the global sample distribution. For example, in optical character recognition, the character shapes found within a single document often come from just a couple of fonts, while the set of all character shapes that an OCR system may have to cope with may be in the hundreds or thousands. Many different approaches have been used trying to take advantage of this additional information. We can think of the problem of taking advantage of this additional information as that of recovering some hidden parametric characteristic of the style or conditions associated with each batch. Without loss of generality, let our feature vector be x ∈ Rn and consider the likelihood function ` = P (x|ω). The Bayes-optimal classification of a pattern x can be found using Bayes rule (dropping the normalization by P (x)): ω ˆ (x) = arg max P (x|ω)P (ω) ω
In the presence of batches, we assume that there is some 1
training set originally based on “OCR by clustering” methods [4, 6, 3]. This paper proposes a simple hierarchical Bayesian approach to style modeling and generalization and evaluates its performance in an OCR context.
2
Hierarchical Bayesian Model
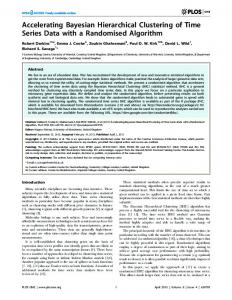
Figure 1. Samples of the letters “f”, “i”, “l”, and “t” after preprocessing (see Section 4).
In this paper, we examine a less constrained model for the parameters θω (s). In particular, we assume that the parameters θω are drawn once, at the beginning of each batch, from a prior distributions DH (θ; Θω ), where DH is the parametric form of the hyperprior and Θω is the per-class hyperprior parameter vector. This is known as a hierarchical Bayesian approach [2]. In different words, the parameter vector θω itself becomes the “style variable”. With this assumption, the Bayesian classification rule for determining ω ˆ (x) becomes Z Y arg max D(xi ; θωi (sb ))DH (θ; Θωi )P (ωi )dθ1 . . . dθr ω1 ...ωn
i
(1) Furthermore, using a maximum likelihood approximation, the classification rule ω ˆ (x) turns into arg max max
ω1 ...ωn θ1 ...θr
Y
D(xi ; θωi (sb ))DH (θ; Θωi )P (ωi )
i
(2)
3
One Dimensional Motivation
To motivate the approach, consider a simple two-class problem. Assume that samples x1 , x2 , . . . are drawn from one of two normal distributions N (µ1 , σ 2 ) or a N (µ2 , σ 2 ). We consider the µj (j = 1 . . . 2) themselves random variables, distributed according to a normal hyperprior N (Mj , s2 ). Within each batch, the µj are fixed, and we assume that there are approximately equal proportions of samples from one or the other distribution. In the absence of knowledge of the batches, this classification problem reduces to that of classifying with two class conditional distributions N (Mj , σ 2 + s2 ). The error rate for this case can be shown to be (where N0,1 is a normally distributed random variable with mean 0 and variance 1): M2 − M1 ) P (N0,1 > √ 4σ 2 + 4s2 If we are given information about which samples belong to the same batch and if batches are sufficiently large, we can compute good estimates of µj using a mixture density estimation approach. We can furthermore determine which class label corresponds to which parameter vector using a number of techniques. Under these assumptions, it can be
shown that the error rate drops to: M2 − M1 P (N0,1 > √ ) 4σ 2 + 2s2 These results suggest that information about batching, even in the absence of a parametric model of style, can result in reduced classification error rates.
4
Experiments
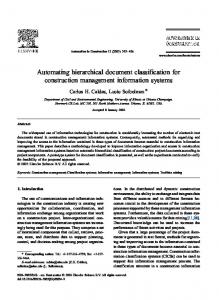
Optical character recognition is an excellent test-bed for these ideas for a number of reasons. In an OCR task, each batch consists of a collection of characters from a single document or document part, likely to be printed in a small number of fonts and imaged under similar degradation conditions. The hidden sb (style) parameter from Equations 1,2 represents both the font of a character and the degradation parameters under which it was rendered. Large amounts of models showing stylistic variation are available in the form of font libraries. Furthermore, the imaging and degradation process has been modeled and validated against common document imaging processes [1]. This allows us to generate large amounts of realistic, hard training and test data with perfect ground truth and conduct reproducible experiments. In the following experiments, images of isolated degraded characters were prepared for pattern recognition by scaling uniformly to fit into a 16 by 16 block of pixels around the centroid of the character. Samples of these characters after preprocessing are shown in Figure 1. The result intensities were treated as a raw feature vector, projected into the space spanned by the top seven principal components of the entire set of feature vectors of a training set. Distributions of the first two principal components for three fonts and ten classes are shown in Figure 2. The fonts in the experiments were selected to present a challenging generalization problem to any classification method. The fonts and experimental conditions were fixed prior to any experimentation. Mixture discriminant analysis, style-conscious classification, and hierarchical Bayesian classification were fit on the training set to classify the test set, with the fit and classification recursively updated via EM. Each method’s final classification error rate on the test data after 10 EM iterations is computed and reported in Table 1.
Figure 2. Two sigma plots in the space of the first two principal components of the Gaussian approximations to the class conditional densities for the digits 0-9 in three fonts.
4.1
Mixture Discriminant Analysis
Mixture discriminant analysis is a generalization of linear discriminant analysis which fits each class as a Gaussian mixture rather than a single Gaussian [5]. In our experiments, the MDA method is given the number of styles in the training data and fits a mixture with that number of components to each class. It does not necessarily take the samples of each style to be one of the mixture components, but rather chooses them itself. Thus, MDA actually uses less knowledge than Style-Conscious and Hierarchical Bayesian classification in that it does not use the style of each training sample. It also differs in that the mixture components within each class are fit to have the same covariance matrix (only the means differ).
4.2
Style-Conscious Classification
As a baseline for comparison against the approach suggested in this paper, we carried out experiments using the approach to style modeling described in [8]. In this model, each combination of class and style is represented by a Gaussian mixture component. Each mixture component is trained by estimating it directly on a set of samples from a specific class and style. For classification, the most likely style was determined and the samples classified accordingly, corresponding to the “top-style” classifier in [8].
Figure 3. Two sigma plots in the space of the first two principal components of the Gaussian approximations to the distribution of perbatch means for the digits 0-9, derived from 12 fonts.
4.3
Hierarchical Bayesian Classification
To test the methods proposed in this paper, we implemented the classification procedure described by Equation 2. We have used a Gaussian form for both distributions D and DH . The hyperparameters for DH were determined using maximum likelihood estimates of the means and variances of the means and variances of the class-conditional parameters on a sample of fonts. In Figure 3, an ellipse for each class i represents the distribution of the empirical class-i style-j means (shown as small circles) across styles j, rather than the class/style-condition distributions of the samples themselves as in Figure 2. Each class-i style-j mean parameter µij , rather than estimated as the mean of the class i style j samples, is estimated as the Bayes estimate (posterior mean) given the data under the existing hyperprior. In a Gaussian setting, this turns out to be an average of the class/style mean and the overall class mean, weighted by the prior and sample mean inverse variances. Thus the Bayesian estimate can be thought of as shrinkage of each class/style mean toward the class mean. These parameter estimates are then used to classify all of the test data by maximum likelihood. The EM algorithm is then used to update the parameters as in the original manner, except that we now use the classified test data and training data together in refitting, whereas the initial estimates used only the training data. The new estimates can then by used to reclassify, and the process continued recursively.
training fonts
test fonts
3,7,10 3,7,10 2,3,6,7,10,11 1-12 3,7,10 3,7,10 2,3,6,7,10,11
3,7,10 3,7,10 2,3,6,7,10,11 1-12 1,5,9 1,5,9 1,4,5,8,9,12
total # training samples 600 1500 1200 2400 600 1500 1200
total # test samples 600 1500 1200 2400 600 1500 1200
Mixture Discriminant Error .33% .20% .33% .17% 1.00% 1.87% 1.17%
Style Conscious Error 0% .13% .25% .125% 2.00% 1.6% .50%
Hierarchical Bayes Error 0% .13% 0% .08% .08% 1.2% .17%
Table 1. Experimental comparison of style oblivious, style conscious and hierarchical Bayesian classification. Each row of the table is created by generating separate training and test sets with the fonts and sample sizes specified, and applying each of the three classification methods to these two sets. Fonts and sample size cases to report were selected prior to computing experimental error rates. Fonts are Lucida Bright (1-4), Sans (5-8), Typewriter (9-12), in Regular/DemiBold/Italic/DemiItalic variants each.
5
Results and Discussion
Experimental results are shown in Table 1. The upper half of the table shows training and testing on a classification task involving style, in which both the training set and the test set come from the same set of fonts. Not surprisingly, style conscious classification outperforms mixture discriminant analysis to a degree comparable to results reported in the literature [8] (the performance of mixture discriminant analysis is generally comparable to that of other good classification methods [5]). The hierarchical Bayesian approach performs no worse than style conscious classification, and actually outperforms it on the two conditions involving the largest numbers of fonts. This may be somewhat surprising at first glance because style conscious classification is using a better model of the data. However, to take advantage of this additional constraint, style conscious classification may require considerably more training data. The lower half of the table shows conditions under which training sets and test sets are derived from disjoint collections of fonts. In real-world applications, these are just the conditions where classifiers are actually applied: classifiers have to cope with styles and samples that were not part of the original training data, and designers of new classifiers attempt to incorporate enough parametric modeling to allow generalization to such samples. The experimental results under these conditions show a strong advantage of the hierarchical Bayesian approach compared to either the mixture discriminant approach or the style conscious approach. Overall, the results demonstrate the utility of using a hierarchical Bayesian approach for dealing with two very common problems in classification tasks: stylistic variation and differences in the composition of training and test data. We have also motivated the approach theoretically. As such, the results will already prove useful for the imple-
mentation of printed OCR systems that have to cope with real-world variations in style. Additional experiments are needed to determine how widely applicable the approach is. We expect that the methods will also find uses in many other areas of classification where traditionally other approaches to stylistic adaptation have been used. Combining the hierarchical Bayesian approach with the discriminative approach described in [3] (which can be understood in the same Bayesian framework) is possible and will likely lead to an additional increase in classifier performance.
References [1] H. S. Baird and G. Nagy. A self-correcting 100-font classifier. In Proceedings of the IS&T/SPIE Symposium on Electronic Imaging: Science & Technology, San Jose, CA, February 1999. [2] J. O. Berger. Statistical Decision Theory and Bayesian Analysis. Springer Verlag, 1985. [3] T. M. Breuel. Classification by probabilistic clustering. In International Conference on Acoustics, Speech, and Signal Processing 2001, pages II–1333ff, 2001. [4] T. M. Breuel. Modeling the sample distribution for clustering OCR. In Proceedings of IS&T/SPIE Electronic Imaging 2001: Document Recognition and Retrieval VIII, January 2001. [5] T. Hastie and R. Tibshirani. Discriminant analysis by Gaussian mixtures. Journal of the Royal Statistical Society series B, 58:158–176, 1996. [6] T. K. Ho and G. Nagy. OCR with no shape training. In Proceedings of the fifteenth ICPR, pages 27–30, Barcelona, 2000. IEEE Computer Society Press. [7] C. Legetter and P. Woodland. Flexible speaker adaptation using maximum likelihood linear regression, 1995. [8] P. Sarkar and G. Nagy. Style consistency in isogenous patterns. In Proceedings of the Sixth ICDAR, pages 1169–1174, Seattle, USA, September 2001.