The statistical nature of radar clutter has been the subject of extensive analysis
for many ... radar clutter magnitude distributions include the Weibull. [3], K [4], and
...
CLUTTER MODELLING AND CANCELLATION IN SAR IMAGES: APPLICATION TO MSTAR DATA Şevket DEMİRCİ
Ferhat BEKTAŞER
Caner ÖZDEMİR
e-mail:
[email protected] e-mail:
[email protected] e-mail:
[email protected] Mersin University, Engineering Faculty, Dept. of Electrical-Electronics Eng., Çiflikköy, 33343 Mersin Key words: Clutter Cancellation, Target Detection, SAR image, CFAR ABSTRACT In this work, several cancellation techniques for undesired clutter in various SAR images are presented. As a good example of SAR imagery, publicly released MSTAR images are taken as the practical application. The modelling of clutter is done by probabilistic approach. Target detection techniques including CFAR (Constant False Alarm Rate) is applied. To find the best fit for the background clutter, higher-order statistics are implemented and various distributions from Rayleigh to Weibull are tested. By using adaptive threshold CFAR detectors MSTAR targets are effectively segmented from clutter backgrounds.
be good fits. Clutter recognition was performed by higher order statistics combination (HOSC) approach [12] and Kolmogorov-Smirnov test was applied to quantify the suitability of the model. In section II, we reviewed some related work on clutter models and detection algorithms with CFAR. In section III, we applied the clutter modelling and target detection techniques to MSTAR images. We showed that military targets are segmented from clutter backgrounds effectively by accurate modelling the clutter. The results shows fair success when compared to classical non-model based direct thresholding process. II. CLUTTER MODELLING DETECTION TECHNIQUES
I. INTRODUCTION In Automatic Target Recognition (ATR) applications a fundemental problem is encountered in the detection of military targets embedded in radar clutter as seen in synthetic aperture radar (SAR) images. The clutter signal is undesirable since it interferes with the actual target features and has to be removed before ATR processing. Several approaches are proposed for SAR clutter removal techniques, most of them model the clutter statistically. The statistical nature of radar clutter has been the subject of extensive analysis for many years. A large number of papers have been written concerning the distribution of land clutter. The most common adopted models to describe clutter statistics are Rayleigh, Lognormal, Weibull and K distributions. Characteristics of these distributions have been considerably studied and reported [1-10]. The clutter spatial distribution is complex and varies from situation to situation. It depends not only the characteristics of random scatterers but also radar resolution and the geometry of illumination (grazing angle), as well as radar frequency and polarisation. In this work, we analyzed the high resolution land clutter data of publicly released MSTAR [11] SAR images for target detection. Among the four possible famous distributions, Rayleigh, Lognormal, Weibull and K of clutter data, the K and Weibull distributions are found to
AND
TARGET
2.1. Probabilistic models of SAR clutter The first statistical model for single-look, single polarization SAR data was suggested by Goodman [1]. According to him, the complex return at each pixel in a SAR image can be modelled by a circularly symmetric Gaussian random variable. The magnitude of a zeromean circularly symmetric complex Gaussian random variable obeys the Rayleigh distribution. A random variable, X, modeled by the Rayleigh PDF with parameter σ is described by:
f X ( x) =
x
σ
⎡ x2 ⎤ ⎥ U ( x) ⎣ 2σ ⎦
exp ⎢ −
(1)
The traditional circular Gaussian assumption for complex backscatter is not a good fit for data obtained at low grazing angles and from high-resolution radars [2]. Under these circumstances, distributions with larger tails and larger standard-deviation-to-mean ratios than Rayleigh match the empirical magnitude distribution better. Statistical models proposed as alternatives to Rayleigh for radar clutter magnitude distributions include the Weibull [3], K [4], and lognormal [5]. The lognormal model is not very popular since it tends to over-represent the spiky or
heavy-tailed nature of typical SAR terrain clutter. The lognormal PDF is given by:
⎡ ( ln x − μ ) 2 ⎤ exp ⎢ − f X ( x) = ⎥ U ( x) 2σ 2 2πσ x ⎢⎣ ⎥⎦ 1
(2)
Here, f X ( x ) is the probability density function, x is the amplitude of the return signals, μ is an average value of
ln x and σ is the standard deviation of ln x . Highresolution radar clutter magnitude distributions tend to lie between the two extremes represented by the Rayleigh and lognormal distributions. The Weibull PDF has been suggested as a model for sea and ground clutter magnitude at high resolutions and low grazing angles [3,6] and is given by :
f X ( x) =
c x c −1 ⎡ x ⎤ ( ) exp ⎢ −( ) c ⎥ U ( x ) b b ⎣ b ⎦
(3)
Here b is a scale parameter and c is a shape parameter. For c=1.0 and 2.0, the Weibull distribution is identical to the Exponential and Rayleigh distributions, respectively. Another two-parameter distribution which has been suggested for experimental SAR sea clutter [7 ,8] and ground clutter [9, 10] magnitude is the K PDF. The twoparameter K PDF is given by
f X ( x) =
2
x
x
) v +1 K v ( )U ( x ) aΓ (v + 1) 2 a a (
target. If this assumption is not true, this approach results in either target feature loss or large clutter residues. To integrate effective adaptive clutter suppression, it is necessary to incorporate an accurate model of the clutter. The choice of a clutter statistical model is driven by radar phenomenology, empirical fits to observed data, or both. In a constant false alarm rate detector, the signal magnitude at each pixel is compared to an adaptive threshold generated from a weighted combination of the signals from a window of reference pixels, centered at the pixel under test. The most basic setup is shown in Fig. 1.
Fig.1. Typical window setup for an adaptive threshold detector The reference pixels are used to obtain estimates of the parameters of the background clutter statistical distribution. The adaptive threshold is also a function of the desired false alarm probability and the estimated probability density function (pdf). i.e.; T
(4)
where a is the scaling parameter, v is the shape parameter, Γ(…) is the gamma function, and Kv(...) is the modified Bessel function of the second kind of order v, When v=∞, the K distribution reduces to the Rayleigh PDF. The shape parameter controls the “spikyness” of the clutter, with lower values of v modeling more spiky clutter. 2.2. SAR clutter recognition Clutter data can be fitted by several distributions, depending among other factors, on the degree of homogeneity of the areas under study. The processing and detection strategy should be changed according to the different clutter backgrounds. Hence, clutter recognition is needed. One approach for recognition is the Higher Order Statistics Combination (HOSC) approach [12]. 2.3 Detection Strategies: The traditional way to suppress the clutter is to fix a global threshold and apply it to the SAR image chip directly [13, 14]. However this approach assumes that the target signal-to-clutter ratio (SCR) is large enough such that very minor image features are cancelled from the
∞
PFA = 1 − ∫ f X ( x ) dx = ∫ f X ( x) dx −∞
(5)
T
where PFA is the false alarm rate selected, T is the threshold for determining candidate target pixels and fX(x) is the pdf of the surrounding clutter. Different methods to obtain the adaptive threshold from the reference clutter pixels yield different CFAR detectors. Finn and Johnson were the first to employ the CFAR technique, when they described the Cell Averaged (CA) CFAR detector [15]. In a CA-CFAR detector, all pixels in the reference window are used to compute the average clutter power, which is then used to compute an adaptive threshold. Goldstein [5] showed that the following test
Xt − Xc
σ
t arg et >
0 v= , βp = p + 2 μ μ p 2 ) βp − ( 2
μk = ^
μk =
Γ (0.5k + 1)Γ (v + 1 + 0.5k ) Γ (v + 1)
1
∑x N
i
k
,k ≥ 0
(2 a ) k
(7)
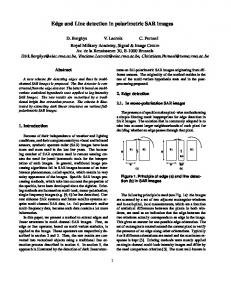
Fig.2. SAR clutter image
(a)
(8)
(9)
By using HOSC approach, for the forest region of clutter image of Fig.2, the data is recognised as K-distributed and for the vegetation region as Weibull-distributed. The density histograms of the corresponding regions and fitted distributions are shown in Fig.3. Then, the background clutter signals of the MSTAR target chips are analyzed statistically. The clutter signals come from the vegetation scattering. Among the possible distributions, the K distribution is found to be the best fit and Weibull distribution is also a good fit for the distribution of the clutter data. Kolmogorov-Smirnov test is applied and it was shown that clutter data obeys the K and Weibull distribution in 0.05 confidence interval. The difference between Weibull and K distributions is small and the comparasions of estimated PDFs and CDFs to empirical data are shown in Fig.4.
(b) Fig.3. Density histograms and fitted distributions of the (a) forest and (b) vegetation region of SAR clutter image of Fig.2. (Amplitude data is normalised to unity mean) CFAR detection Because of the numerical difficulties in solving the transcendental equation between PFA and T for K distribution and also Weibull distribution seems to be a good fit, Weibull distribution was selected as the distribution of the background clutter and then the corresponding adaptive CFAR detector was applied to target images. The threshold value is solved from (5) for the desired probability of false alarm PFA. For Weibull
modelled background, the CFAR detector outputs are shown in Fig.5 and Fig.6. For comparasion reasons, direct thresholded images are also given.
Smirnov test in 0.05 confidence interval. With Weibull clutter assumption, adaptive CFAR detector is applied to target images of MSTAR data set. The results showed that targets can be effectively differentiated from the background clutter, yielding a very clean image. The effectiveness of the proposed method can be observed from the images after CFAR processing such that the target features are very well preserved while most of the surronding clutter is suppressed.
(a)
(a)
(b) Fig.4. (a) The PDFs and (b) CDFs of clutter data of MSTAR target images and fitted distributions. (Amplitude data is normalised to unity mean) IV. CONCLUSION We have applied a clutter cancellation technique and a target detection algorithm to SAR imagery. The background land clutter signals are investigated statistically and as demonstrated in Sect. III, the most appropriate models are found to be the K and Weibull distributions. To adequately model the background clutter, we compared the estimated moments of the sample data with various possible distributions’ moments. The parameters of the possible distributions are estimated with moments or maximum likehood method from sampling data. It was shown that K and Weibull distributions are reasonable models for the envelope of the data from the backscatter of homogeneous vegetation clutter. Because of the numerical difficulties in CFAR detection under Kdistribution assumption, (the solution of the transcendental equation between PFA and T needs optimization) and also Weibull distribution is a reasonable model, Weibull distribution was selected as the distribution of the background clutter. The suitability of the Weibull model was also proved by Kolmogorov-
(b)
(c) Fig.5. (a) Original SAR image of BTR-60 vehicle (b) decluttered image with direct thresholding processing (c) result of CFAR processing with Weibull clutter assumption and PFA =10-2
(a)
(b)
(c) Fig.6. (a) Original SAR image of BTR-70 vehicle (b) decluttered image with direct thresholding processing (c) result of CFAR processing with Weibull clutter assumption and PFA =10-2 REFERENCES 1. J.W. Goodman, Some Fundamental Properties of Speckle, Journal of the Optical Society of America, 66(11): 1145–1150, 1976. 2. M.I. Skolnik, Introduction to Radar Systems, 2nd edition, McGraw-Hill, New York.
3. D.C. Schleher, Radar Detection in Weibull Clutter, IEEE Trans. On Aerospace and Electronic Systems, AES-12(6): 736–743, 1976. 4. E. Jakeman and P.N. Pusey, A Model for NonRayleigh Sea Echo, IEEE Trans. on Antennas and Propagation, AP-24(6): 806–814, 1976. 5. G.B. Goldstein, False Alarm Regulation in Lognormal and Weibull Clutter, IEEE Trans. on Aerospace and Electronic Systems, AES-9(1): 84–92, 1973. 6. M. Sekine, S. Ohtani, T. Musha, T. Irabu, E. Kiuchi, T. Hagisawa, and Y. Tomita, Weibull Distributed Ground Clutter, IEEE Trans. on Aerospace and Electronic Systems, AES-17: 596–598, 1981. 7. C.J. Oliver, Representation of Radar Sea Clutter. IEE Proceedings, F, Radar and Signal Processing, 135(6): 497–506, 1988. 8. K.D. Ward, C.J. Baker and S. Watts, Maritime Surveillance Radar Part 1: Radar Scattering from the Ocean Surface, IEE Proceedings F, Radar and Signal Processing, 137 (2): 51–62, 1990. 9. J.K. Jao, Amplitude Distribution of Composite Terrain Radar Clutter and the K-distribution, IEEE Trans. on Antennas and Propagation, 32(10): 1049–1062, 1984. 10. S.H. Yueh, J.A. Kong, J.K. Jao, R.T. Shin and L.M. Novak, K-distribution and Polarimetric Terrain Radar Clutter, Journal of Electromagnetic Waves and Applications, 3: 747–768, 1989. 11. MSTAR SAR Data Set, Clutter and Targets, collected by Sandia National Lab, released by DARPA, MSTAR Data Collection #1-2 , September 1995. 12. M. Xiaoyan, F. Xueli, Z. Ronghua and X. Jiabin, An Approach of Radar Clutter Recognition Based on Signal Higher-Order Statistics Combination, Processing Proceedings, WCCC-ICSP 2000. 5th International Conference on, 2000. 13. D. H. Pham, A. Ezekel, M. T. Campbell, and M. J. T. Smith, A New End-to-End SAR ATR System, Proceedings of SPIE: Algorithms SAR Imagery VI, Vol. 3721, 292–301, Orlando, Florida, April 1999. 14. D. Luo, Pattern Recognition and Image Processing, Horwood Publishing Limited, Chichester, England, 1998. 15. H.M Finn and R.S. Johnson, Adaptive Detection Mode with Threshold Control as a Function of Spatially Sampled Clutter-Level Estimates, RCA Review 29(3): 414–464, 1968. 16. M. C. Burl, G. J. Owirka and L. M. Novak, Texture Discrimination in Synthetic Aperture Radar Imagery, 23rd Asilomar Conf. on Signals, Systems, and Computers, Pacific Cove, CA, 30 Oct.-1 Nov., pp. 399-404, 1989. 17. D. R. Iskander and A. M. Zoubir. Estimation of the Parameters of the K-distribution Using Higher Order and Fractional Moments, IEEE Transaction on Aerospace and Electronic Systems, 35(4):33-37, October 1999.