algorithm for line-crossing recognition. We implement this algorithm as part of an operational wireless sensor network, and develop a highly customized and ...
In Proceedings of the International Symposium on Circuits and Systems, pages 2506-2509, New Orleans, Louisiana, May 2007
Compact, Low Power Wireless Sensor Network System for Line Crossing Recognition Chung-Ching Shen, Roni Kupershtok, Bo Yang, Felice Maria Vanin, Xi Shao, Datta Sheth, Neil Goldsman, Quirino Balzano, and Shuvra S. Bhattacharyya Department of Electrical and Computer Engineering University of Maryland, College Park 20742 {ccshen, akuper, boyang, felvanin, xshcn, sheth, neil, qbalzano, ssb}@umd.edu
Abstract— Many application-specific wireless sensor network (WSN) systems require small size and low power features due to their limited resources, and their use in distributed, wireless environments. In this paper, we present a light-weight distributed algorithm for line-crossing recognition, together with its analysis, implementation, and experimental evaluation within a prototype wireless sensor network platform. The algorithm is developed in conjunction with a TDMA-based communication protocol such that the proposed system provides for low duty cycle and energy efficient operation. An accurate lifetime model is proposed with consideration of detailed energy usage to analyze and estimate the system lifetime. Our experimental results demonstrate the accuracy of this lifetime model, and its utility in optimizing network implementation. The design and experimental evaluation of our prototype network demonstrates the compactness and functionality of the proposed distributed WSN system for line-crossing recognition.
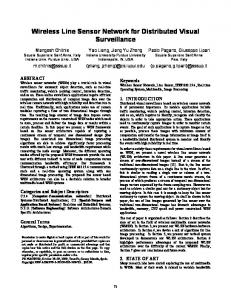
I. I NTRODUCTION AND R ELATED W ORK While considering the design of a distributed WSN system applied in an indoor environment, we propose a light-weight, distributed algorithm for line-crossing recognition. We implement this algorithm as part of an operational wireless sensor network, and develop a highly customized and streamlined printed circuit board (PCB) design to support the individual sensor nodes. Our complete system implementation involves application-specific optimizations at the algorithm level, network level, and node level, and for this implementation, we demonstrate the resulting features of small size and high energy efficiency. The purpose of this distributed WSN system is to periodically reach consensus in deciding whether or not an object (“intruder”) has crossed a specific boundary (“line”) in a noisy environment that is being monitored. Furthermore, upon detecting an intrusion, the system determines where the line was crossed (i.e., between which nodes in the line). For example, in Figure 1, the sensor nodes are placed in a circle inside a room. In this practical configuration, the WSN system recognizes when and where a subject has crossed the circle. All sensor nodes communicate with each other through an efficient, wireless time division multiple access (TDMA) protocol so that each node can transmit and receive at designated time slots, and can “sleep” during other times for energy savings. To demonstrate the practical realization of the targeted application, we develop a customized system prototype using an emerging family of off-the-shelf system-on-chip (SoCs), and a custom-designed miniature antenna that we have developed. Each SoC component employed provides an embedded microprocessor and wireless communications transceiver together within a single integrated circuit. Our design is different from related wireless sensor network implementations (e.g., see [1], [2]) in that a single SoC is used to replace separate integrated circuits for microcontroller and transceiver components, and furthermore, a smaller antenna is designed and installed. Both design features contribute to significantly reducing PCB size and the size of each network node.
1-4244-0921-7/07 $25.00 © 2007 IEEE.
µC+T P S
µC +T S
P
customized sensory node token passing path
µC+T P S
approaching sound subject µC + T S
P
µC + T S µC + T S
P
sound source detected
P
Fig. 1. An indoor environment scenario with the use of our distributed system for line-crossing recognition.
All N nodes within the system run the proposed distributed algorithm, and reach a consensus based on local decisions of C nodes while a subject is being detected (C ≤ N ). The number of data bits for the data that is communicated by each node is O(log(C )) (i.e., is logarithmically bounded with respect to C). In [3], Hirschberg and Sinclair proved an upper bound of O(log(N )) on the number of bits that are sent by every node during a consensus task of N nodes arranged in a bidirectional ring topology. Every node that executes their algorithm has an initial input, and has no additional inputs during its execution. In [4], Dinitz et al. proved an upper bound of O(N ) on the number of bits that is sent by all nodes during a consensus task of N nodes arranged in a tree topology (a chain topology is a special case). Their proof is based on the collection of information with feedback (CIF) algorithm. Every node that runs the CIF algorithm may have an initial input without additional inputs during its execution. After one round that includes two phases, the ‘collect” phase and “feedback” phase, all nodes reach consensus. In our proposed distributed algorithm — in contrast to the approaches described above — each node can obtain many inputs (i.e., either from the received data or from the sensed data) during its execution, and based on these inputs, all of the nodes decide whether or not a subject is approaching and crossing the given line. Also, our algorithm requires that either O(log(C )) or O(log(N )) data bits are needed depending on the protocol stage (i.e., synchronization stage or communication stage) instead of N . Furthermore, during most of the system lifetime, our implemented system communicates with only O(log(C )) data bits. Here, C — a design parameter — is the minimum number of nodes that must sense the subject in order to reach consensus that an intruder is approaching and crossing the line. Higher values of C provide higher system accuracy at the expense of higher communication requirements and higher recognition latency. Since energy consumption during transmission is high, our approach reduces energy consumption significantly by reducing the number bits that need to be transmitted for overall system operation.
2506
function receiveMode() { (FRX, CM, ID, Cglobal or Msense or MAXsense) = receiveOp(period TRX); if (FRX is true) then switch CM then “phase 0, round 0”: update Cglobal from the least 3 bits of the received message. if (Fsense is true) then if (Fapproach is false and Csense is 0) then increment Cglobal; set Fincreased to true; increment Csense; if (Fapproach is false) then if (Cglobal is larger than CG) then set Fapproach to true; else if (Fsense is false and Fincreased is true) then decrement Cglobal; set Fincreased to false;
function transmitMode() { switch CM then “phase 0, round 0”: update CM to “phase 0, round 0” transmitOp(CM, ID, Cglobal); “phase 1, round 1”: update CM to “phase 0, round 0” transmitOp(CM, ID, Msense); “phsae 1, round 1”: update CM to “phase 0, round 0” transmitOp(CM, ID, MAXsense); }
Notation for distributed line-crossing algorithm if (Cglobal equals to 0) then update CM to “phase 1 and round 0”; set Msense to Csense; “phase 1, round 0”: if (phase equals to 0) then update CM to “phase 1 and round 0”; if (the least 6 bits of the received message is less than Csense) then set Msense to Csense; else set Msense to the least 6 bits of the received message; else update CM to “phase 1 and round 1”; set MAXsense to the least 6 bits of the received message;
N: number of nodes FRX: local received flag Fapproach: global approaching flag Fincreased: local incremented flag for Cglobal Fsense: local sensed flag phase: phase indicator round: round indicator CM: control mode message Cglobal: global sensed counter Csense: local sensed counter CG: global sensed threshold Msense: local maximum sensed count MAXsense: global maximum sensed count TRX: maximum waiting time for receiving message
“phase 1, round 1”: set MAXsense to the least 6 bits of the received message; if (round equals to 0) then update CM to “phase 1 and round 1”;
receiveOp: hardware-controlled receiving operations transmitOp: hardware-controlled transmitting operations
if (MAXsense equals to Csense) then “the subject crossed the line near node I”; reinitialize the system; }
Fig. 2. Pseudo code specification for our distributed algorithm for linecrossing recognition.
II. D ISTRIBUTED A LGORITHM FOR L INE - CROSSING R ECOGNITION Our proposed algorithm, which runs on each node after the whole system is synchronized (i.e., at the communication stage), involves two phases of operation for line-crossing recognition. In phase 0, the nodes reach a consensus and decide whether the subject has crossed the line, and in phase 1, the nodes find the place where the subject crossed the line. We assume that each node has a unique identifier ID, where 0 ≤ ID ≤ N − 1 . Figure 2 shows the pseudo code of the proposed distributed algorithm for linecrossing recognition, which each node runs the algorithm based on the TDMA-based communication pattern for Transmission and Reception mode operations. Notice that in the algorithm, hardwarecontrolled receiving and transmitting operations are dependent on targeted transceiver module. Therefore, we do not address the details of both functions due to the space limitation. The functionality of both functions encapsulates the lower level hardware configurations. In phase 0 of the proposed algorithm, the nodes use a counter Cglobal to decide whether the subject is approaching based on local decisions of C nodes (C ≤ N ) that sensed the subject. In its turn, each node receives Cglobal from its previous neighbor (i.e., the node with ID i receives from node i − 1). When a node senses that the subject is approaching, it increments Cglobal by one. Every node increments Cglobal at most once. Therefore, at any moment during the first stage of phase 0, the value of Cglobal indicates the number of nodes that sensed the subject. When Cglobal reaches C, all the nodes reach a consensus and decide that the subject is approaching. The node that increments Cglobal to C is the first node to set its approaching flag (Fapproach ) to 1. In their respective turns, all of the other nodes set their Fapproach values to 1. Then the second stage of phase 0 starts. During the second stage of phase 0, the subject is stepping away from the line. Every node that incremented Cglobal and now stops sensing the subject, decrements Cglobal by one. Since every node increments Cglobal at most once and
eventually all the nodes will stop sensing the subject, Cglobal will be decremented to zero. The first node, s, that decrements Cglobal to zero, starts phase 1. In phase 1 of the proposed algorithm, the nodes find the place where the subject crossed the line. This is done by finding which node sensed the subject the maximum number of times, which in turn is determined using a sensing counter Csense in every node. Phase 1 consists of 2 rounds. In the first round, the maximum sensed number is found. Node s transmits Csense (s) to its next neighbor. In its turn, each node i transmits the maximum of the number it received from node i − 1 and Csense (i). At the end of the first round, node s receives the global maximum sensed count, MAXsense = max {Csense (i)}. Afterward, node s starts the second round, where it transmits MAXsense to its next neighbor. Every node j — in its turn — compares MAXsense to Csense (j ). If there is a match, node j claims that it obtained the maximum number of senses, which means that the subject crossed the line near node j. Otherwise, node j transmits MAXsense to its next neighbor. At the beginning of the second round node, s holds MAXsense , which is equal to Csense (l ) (0 ≤ l ≤ N − 1). Therefore, the second round ends at node l. That is, the subject crossed the line near node l, and the system can be reinitialized. From our algorithm, it can be observed that only log(C ) bits are needed to represent Cglobal and a maximum of log(N ) bits are needed to represent Csense . However, the time that the system operates in phase 1 is much less than the time of operation in phase 0. This is because the subject is stepping across the line continuously, and when phase 1 starts, the nodes can find the place where the subject crossed the line relatively quickly. Therefore, the critical number of data bits for transmitting and receiving is O(log(C )) instead of O(log(N )). III. TDMA- BASED S YNCHRONIZATION AND C OMMUNICATION TDMA-based communication protocols are often applied in small scale wireless communication systems [5], [6] due to their simplicity and low power communication patterns. Furthermore, with TDMA, collision avoidance can be guaranteed throughout the system. Therefore, we have employed TDMA-based communication in the WSN system presented in this paper. The specific protocol that we have implemented consists of two stages: synchronization and communication. During the synchronization stage, the nodes are synchronized with each other. Whenever a node is powered on, it starts in the synchronization stage with a periodic communication pattern of transmitting and receiving one packet during each TDMA time frame. In each time frame, each powered node transmits one packet and receives at most one packet. Node i stays in the synchronization stage until it receives a packet from its previous node i−1. Afterward, it enters the communication stage for regularly communicating with other nodes in the network. During the communication stage, every node transmits, receives, and idles periodically based on a pre-defined TDMA time schedule. In such a case, each node can power down its main computation and communication resources when the node is idle so that energy consumption is reduced to a minimal level. Figure 3 shows a schedule for a 4-node TDMA-based communication protocol. Figure 3 also illustrates the synchronization stage, where each node can be turned on at an arbitrary time. Based on the algorithm specification in Section II, our protocol requires 2 + log(C ) (O(log(C ))) bits to maintain system functionality during the communication stage, where the control information in a message packet occupies 2 bits, and the data occupies log(C ) bits. However, during the synchronization stage, nodes communicate with one another using 2 bits of control
2507
Power “ON”
Symbols
T
R
Node 0
T
R
T
I
T
I
R+P
T
I
R+P
tradioOntx/rx
I
R+P
Node 1
Iradiotx/rx
t
Power “ON”
T
R
I
R+P
T
I
R+P
T
I
R+P
T
I
R+P
Istatic/dynamic
T
t
Power “ON”
T
I
R+P
T
I
R+P
I
R+P
T
T
I
Symbols
50μs
R
data rate
Description
31mA / 22mA
M
data length
500μA / 270 μA/MHz
tcompute
0.8 μA
Itimer, IA/D, Isensor, II/O
Value 500kbps O(log(C)) or O(log(N)) bits
CPU computation time
10ms
peripheral current consumption for timer, A/D converter, sensor, and I/O
R+P
260μA, 0.9mA, 0.2mA, 0.2mA
t
Power “ON”
R
Node 3
Value
Idle mode current consumption
Iidle T
R
Node 2
Description startup time from power-on to valid transmit/receive TX/RX mode current consumption static/dynamic current consumption in Active mode
T
I
T R+P
I
T R+P
T
I
R+P
I
Fig. 4.
T
Notations for power modeling with reference values.
R+P
t
P: Process
I: Idle
10000
Communication path
Fig. 3. TDMA-based communication pattern of distributed line-crossing recognition system for a four node example.
Energy consumption (mJ)
T: Transmit R: Receive
Communication stage Lifetime (days)
Synchronization stage
1000
100
10 0
0.05
0.1
0.15
0.2
0.25
0.3
0.35
0.4
0.45
0.5
5.1 4.9 4.7 4.5 4.3 4.1 3.9 3.7 3.5 3.3 3.1 2.9 2.7 2.5
measured results avg. measured results estimated results
2
2.1 2.2 2.3 2.4 2.5 2.6 2.7 2.8 2.9 3 3.1 3.2 3.3 3.4 3.5 3.6 3.7 3.8
Duty cycle (Tbusy/Tframe)
information and log(N ) bits of data (for node identifiers). Thus, O(log(N )) bits are needed for synchronization. Because the time that the system operates in the synchronization stage is transient and relatively short compared to the time of operation in the communication stage, the number of bits required to communicate is O(log(C )) in steady state system operation. Now let Tframe denote the overall time of each TDMA communication frame (schedule period), and let Tbusy denote the time during which a node is not idle in one frame. Then the duty cycle of the TDMA-based communication pattern illustrated in Figure 3 is Tbusy , where Tbusy ≤ Tframe . Tframe
(1)
(a)
IV. S YSTEM L IFETIME A NALYSIS
� Etotal Ti , and Ptotal = Pi , Ptotal T frame i=1 L
Tlifetime =
(b)
Fig. 5. (a) Analysis of duty cycle versus lifetime using 3V · 950mAh capacity battery. (b) Fidelity analysis.
modeled carefully based on the node-level power models presented in [7]. For estimating the lifetime of the proposed WSN using TDMAbased communication, the total power consumption Ptotal is modeled by the following equation: tradioOntx + M Pout R )(Iradiotx + )+ Tframe Vcc tradioOnrx + M ttimer R ( )Iradiorx + ( )Itimer + Tframe Tframe tcompute ( )(Istatic + Idynamic )+ Tframe Tframe − tradioOntx /rx − tcompute − ttimer − ( Tframe (IA/D + Isensor + II /O )}.
Ptotal = Vcc {(
The duty cycle can be reduced at a node either by reducing the amount of non-idle time or by extending Tframe . Our developed distributed algorithm and communication protocol can exploit such a benefit since only small amounts of computation and communication are required to achieve the goals of sensing and of reaching consensus across the whole system.
The system (network) lifetime model in Eq. 2 below is derived from the analysis of pre-scheduled TDMA-based communication operations along with the characteristics of key hardware components, including the sensor, microcontroller, and transceiver. According to the communication protocol discussed in Section III, all operations within a TDMA frame (Tframe ) appear periodically, frame-by-frame until the system fails (i.e., a node runs out of energy). Thus, in our lifetime model, we estimate the energy consumption for a single communication time frame, and then based on this estimation, the lifetime of the overall system can be estimated using data on the total energy stored in the available batteries:
Supply voltage (V)
2M R
)Iidle +
Figure 4 lists notations for the power model above with reference values (e.g., see [8]). For further details on the symbols and terms in this equation, we refer the reader to [7]. For demonstrating how configuration of the communication protocol affects the lifetime of the system, we evaluate different duty cycles of the protocol by changing Tframe . The idle time is varied along with Tframe , and the associated results of lifetime calculation are shown in Figure 5(a). Here, we can quantify how lower duty cycles lead to greater network longevity through the increasing proportion of idle time. Reduction of the duty cycle is limited by the latency constraint of the application, and thus lifetime can be maximized when the duty cycle is reduced to the lowest point at which the latency constraint can be reliably satisfied.
(2) V. F IDELITY A NALYSIS
where Etotal denotes the total energy stored in a given battery; L denotes the number of devices considered in the power model; Pi denotes the average operational power consumption of the ith device; and Ti denotes the estimated time for which the ith device operates within a given frame. We consider details of devices belonging to various hardware components for estimating the energy consumption. For example, the power consumption of A/D converters, hardware timers, and the CPU core are all considered whenever the microprocessor is used. Within distinct modes of operation for our TDMA-based communication protocol, the power consumption for devices can be
For presenting the accuracy of lifetime analysis using the estimator employed in our model, we calculate the fidelity of the estimator by comparing the estimated energy consumption to the average measured energy consumption within a TDMA frame Tframe (Figure 5(b)). The estimated energy consumption is based on the models described in Section IV. The measured energy consumption is tested from the hardware of the system prototype with real batteries (see Section VIA). In this way, we can demonstrate in a quantitative manner the high accuracy of our lifetime estimation method. Based on this accuracy, the lifetime modeling, and the associated energy consumption models, can be applied with high confidence to analyze and optimize the
2508
Vcc 2.2 ~ 3.5 V
V I
VDPO R1 10 ȍ
bottom side R2 50 ȍ DPO/DSO
designed antenna top side (a)
T
0.035
I
System Prototype
R = R1 // R2 = 8.33 ȍ
I VDPO /R, V V cc � IR 1N P IV, E ¦P Ni 1 i N : # of samples
Current consumption (A)
916MHz ½-wave dipole antenna
R+P
0.03
T: Transmit R: Receive P: Process I : Idle
0.025 0.02 0.015 0.01
I
0.005 0 0
500
Fig. 6. (a) System prototype. (b) Return loss (S11) of the designed miniature antenna.
lifetime of the WSN system. By applying 14 different voltage settings to the sensor node platform, and comparing the resulting measured vs. estimated energy consumption values, we obtain an estimation fidelity of 0.978 (a fidelity value of 1 corresponds to perfect fidelity). Due to space limitations we refer the reader to [9] for full details on the general model employed for deriving the fidelity of an estimator in terms of measured data. In Figure 5(b), we note that the estimated energy consumed is lower than the measured one on each working point. This is because the current leakage on the PCB board and the power consumed by other peripheral devices such as LEDs are not considered in the model. A more complete mixed-signal model for energy consumption will be explored in our future work. VI. S YSTEM D EMONSTRATION AND E XPERIMENTAL R ESULTS A. System Prototype To implement the complete wireless sensor network system — based on the algorithms and protocols discussed in the previous sections — we have developed a streamlined, miniaturized antenna [10], and employed an emerging family of system-on-chip (SoC) devices [8] as an integrated, single-chip device for performing computation and communication tasks as well as a acoustic sensor for sensing tasks. The PCB design of our sensor node prototype includes a 4-layer layout, and provides placement of components for minimizing the board size and enhancing antenna performance. Figure 6 illustrates our sensor node prototype and our miniature antenna with its performance characteristics, as well as a comparison in size with a commercial 916MHz dipole antenna. The reflection coefficient at the feeding point of the antenna is measured through the Agilent Network Analyzer (PNA Series 8364B). The center frequency of our miniature antenna is 916MHz, with a return loss of 20dB and bandwidth of 13MHz. B. Experimental Platform and Performance Results Figure 7(a) represents a simple experimental platform for measuring voltage variations (i.e., VDPO ) and calculating the associated current, power and energy consumption for the system prototype. Figure 7(b) shows the current consumption result while the system prototype is running the proposed distributed algorithm and communication protocols over one TDMA frame Tframe , where Tframe is set to one second. The voltage variations are measured through the Tektronix 4GHz digital phosphor oscilloscope (TDS 7404). All of the measured/calculated values for current consumption and voltage are converted to corresponding energy consumption results for the fidelity analysis. This is illustrated in Figure 5(b). VII. C ONCLUSION This paper has presented a complete system design — including algorithm streamlining, communication protocol configuration, hardware/software implementation, and lifetime modeling — for a
1500
2000
2500
1 sec. tim e fram e w ith 2500 sam ples
(a)
(b)
1000
(b)
Fig. 7. (a) Experimental platform for voltage measurement. (b) Current consumption result within one communication frame period (Tframe ), with Tframe set to one second.
compact and low power, distributed, sensor network system for line crossing recognition. Our proposed distributed algorithm for line crossing recognition is useful in reducing the amount of data that must be communicated across nodes in the network. Furthermore, the communication protocol that we employ carefully manages the duty cycle to achieve further improvements in energy efficiency. Our approach to modeling system lifetime provides an accurate method for estimating how long the network can operate with a given amount of battery capacity for each node. A customized PCB design of the system prototype is demonstrated to compactly support the developed sensor node platform. The sensor node platform in turn employs emerging, off-the-shelf, system-on-chip technology, and a custom-designed miniature antenna. Our ongoing and future work aims for further miniaturization and energy efficiency for the targeted line crossing recognition application by developing a fullycustomized design, including a streamlined ASIC implementation of the mixed-signal SoC. R EFERENCES [1] J. Hill and D. Culler, “Mica: A wireless platform for deeply embedded networks,” IEEE Micro, pp. 12–24, November 2002. [2] M. Kohvakka, M. Hannikanen, and T. Hamalainen, “Wireless sensor prototype platform,” in Proceedings of the IEEE International Conference for Industrial Electronics, Control and Instrumentation, November 2003, pp. 1499–1504. [3] D. S. Hirschberg and J. Sinclair, “Decentralized extrema-finding in circular configurations of processors,” in Commun. ACM 23 (ll), 1980, pp. 627–628. [4] Y. Dinitz, S. Moran, and S. Rajsbaum, “Exact communication costs for consensus and leader in a tree,” in Journal of Discrete Algorithms 1(2), April 2003, pp. 167–183. [5] W. Ye, J. Heidemann, and D. Estrin, “Medium access control with coordinated adaptive sleeping for wireless sensor networks,” in IEEE/ACM Transactions on Networking, June 2004, pp. 493–506. [6] T. van Dam and K. Langendoen, “An adaptive energy-efficient mac protocol for wireless sensor networks,” in Proceedings of the 1st international conference on Embedded networked sensor systems, November 2003, pp. 171–180. [7] C.-C. Shen, C. Badr, K. Kordari, S. S. Bhattacharyya, G. L. Blankenship, and N. Goldsman, “A rapid prototyping methodology for applicationspecific sensor networks,” in Proceedings of the International Workshop on Computer Architecture for Machine Perception and Sensing, Montreal, Canada, September 2006. [8] CC1110 Preliminary Datasheet (Rev. 1.01) SWRS033A, Chipcon AS, 2006. [9] N. K. Bambha and S. S. Bhattacharyya, “A joint power/performance optimization technique for multiprocessor systems using a period graph construct,” in Proceedings of the International Symposium on System Synthesis, Madrid, Spain, September 2000, pp. 91–97. [10] B. Yang, F. Vanin, C.-C. Shen, X. Shao, Q. Balzano, N. Goldsman, and C. Davis, “A low profile f-inverted compact antenna (fica) for wireless sensor networks,” submitted to International Symposium, Antenna and Propagation Society, June 2007.
2509