detected in several turtle species (Stuart & Parham 2004; ... Parham 2004. 5384 ...... Jungt SO, Lee YM, Kartavstev Y, Park IS, Kim DS, Lee JS (2006) The com-.
Molecular Ecology Resources (2011) 11, 956–967
doi: 10.1111/j.1755-0998.2011.03032.x
Comparing and combining distance-based and character-based approaches for barcoding turtles B. N. REID,* M. LE,†‡§ W. P. M C CORD,¶ J. B. IVERSON,** A. GEORGES,†† T. BERGMANN,‡‡ G. AMATO,§§ R. DESALLE§§ and E . N A R O - M A C I E L §§¶¶ *Department of Forest and Wildlife Ecology, University of Wisconsin, 1630 Linden Drive, Madison, WI 53706, USA, †Center for Natural Resources and Environmental Studies, Vietnam National University, 19 Le Thanh Tong Street, Hanoi, Vietnam, ‡Faculty of Environmental Sciences, Hanoi University of Science, 334 Nguyen Trai Road, Hanoi, Vietnam, §Department of Herpetology, American Museum of Natural History, New York, NY 10024, USA, ¶East Fishkill Animal Hospital, 455, Route 82, Hopewell Junction, NY 12533, USA, **Department of Biology, Earlham College, Richmond, IN 47374, USA, ††Institute for Applied Ecology, University of Canberra, Canberra, ACT 2601, Australia, ‡‡Institute for Animal Ecology and Evolution, Stiftung Tiera¨rztliche Hochschule Hannover, Hannover 30559, Germany, §§Sackler Institute for Comparative Genomics, American Museum of Natural History, New York, NY 10024, USA, ¶¶Biology Department, College of Staten Island, City University of New York, Staten Island, NY 10314, USA
Abstract Molecular barcoding can serve as a powerful tool in wildlife forensics and may prove to be a vital aid in conserving organisms that are threatened by illegal wildlife trade, such as turtles (Order Testudines). We produced cytochrome oxidase subunit one (COI) sequences (650 bp) for 174 turtle species and combined these with publicly available sequences for 50 species to produce a data set representative of the breadth of the order. Variability within the barcode region was assessed, and the utility of both distance-based and character-based methods for species identification was evaluated. For species in which genetic material from more than one individual was available (n = 69), intraspecific divergences were 1.3% on average, although divergences greater than the customary 2% barcode threshold occurred within 15 species. High intraspecific divergences could indicate species with a high degree of internal genetic structure or possibly even cryptic species, although introgression is also probable in some of these taxa. Divergences between species of the same genus were 6.4% on average; however, 49 species were 2%), Category III (maximum intraspecific distance 2% were observed in 15
960 B . N . R E I D E T A L . of the 69 species with n > 2. The Pearson and Spearman tests for correlation between sample size and intraspecific divergence gave conflicting results (Pearson’s r = 0.01, P = 0.91; Spearman’s rho = 0.26, P = 0.029). This indicates a positive relationship between relative (but not absolute) sample size and intraspecific divergence, meaning that although intraspecific distances may be somewhat underestimated in undersampled species there is no linear relationship between sample size and divergence. Mean pairwise divergence between congeneric individuals was 6.4% (SD = 2.6%, Fig. 1). Pairwise K2P differences of 1 69
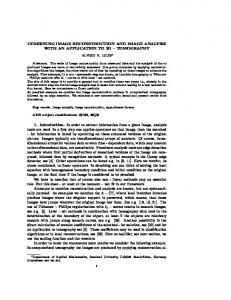
Species with diagnostics
I/II 119
95
III/IV 32
14
I 43
35
II 9
3
III 11
6
IV 6
0
Fig. 3 Number of species in each distance category that exhibit identifying characters at the family level.
1.00
Proportion with simple diagnositcs
0.75
0.50
0.25
0.00
Fig. 4 Proportion of species in the total data set and in each family with identifying characters capable of distinguishing a given species from all others in its family.
Discussion The barcode sequences assembled here provide a potentially crucial resource for turtle conservation. Barcode records previously existed for only about 50 species; this study more than quadruples that number, allowing approximately two-thirds of extant species to be identified using molecular means and adding entire families to the barcode database that was previously missing. Over the course of the barcoding process, apparent genetic structure was identified in several poorly studied groups, indicating the possible existence of evolutionarily significant units within these putative species that merit further study and possibly extra consideration in conservation
efforts. This study also compares distance-based and character-based methods for species identification, and by combining the two highlights a ‘third way’ for DNA barcoding that may be useful in improving identification efficiency in taxa for which neither distance nor characters are a perfect fit. While members of the barcoding community have advanced several different methods of distinguishing species using COI sequence information, the distancebased method advanced by Hebert et al. (2003) has become and in all probability will remain the standard, workhorse method used in DNA barcoding. Distancebased barcoding uses a 2% divergence (K2P > 0.02) cut-off for vertebrates to determine species identity, implying that individuals should be 2% may exist in undersampled species and (ii) all closely related species were not sampled for the species examined, leaving open the possibility that some unsampled species could be 2% in the publicly available COI sequences do indeed map to three distinct clades which Stuart & Parham (2004) argued should be granted full species status based on genetic and morphological divergences. This example from the public data seems to support the possibility that these high intraspecific divergences may represent cryptic diversity. However, the controversy surrounding these designations (Turtle Taxonomic Working Group 2007), and
� 2011 Blackwell Publishing Ltd
M U L T I P L E A P P R O A C H E S T O B A R C O D I N G T U R T L E S 963 Table 3 Example sets of identifying characters for (a) Podocnemididae and (b) Trionychidae. Simple identifying characters are shaded. Characters providing diagnostic information via the heuristic discussed in the text are boxed. (a) Erymnochelys madagascariensis Peltocephalus dumerilianus Podocnemis erythrocephala Podocnemis expansa Podocnemis lewyana Podocnemis sextuberculata Podocnemis unifilis Podocnemis vogli
80 A A T T C A G T
89 C C C A C T C C
158 C G A A T T A A
263 C T A C T C C C
308 T A T T T T T C
323 A C A G A A A A
350 A C C T C C C C
368 A C T T T T T T
410 A A T G C T T A
479 A C C T C C C C
527 A G C C C C C C
530 A C A A A G A A
542 T C C C A C C C
545 A C A A A A A T
560 A T A G A A A A
5 C C C C C C T C C C C C C C C C C C C
26 A A A A A A A A C A A A A A A A A A A
121 T T T T T T T T T T T T T T T C T T T
218 A A A T T T T A A A A G A A A A A A C
281 A⁄T T A A A A A A A G A A A A A T A A A
290 A A A G A A A T A A A A C A A C A A A
323 C⁄T C C T T C C T T C T C T A G C T T T
350 C C C C A C C C C C T C C C C C C C C
512 A A G T T T A C C A A A A C C A A A C
521 A A A C T A A C C A A A A A A A A G A
527 A A A A G C A A A A A A A A A A A A A
536 A⁄T A A A A A A A A A A A G A A A T A C
545 A T T C A A A A A A A A A T T A A A A
551 A A G A T C A C C A A A A A A G G G A
614 T A A G C A C A A T T T T A A T A A C
(b) Amyda cartilaginea Chitra chitra Chitra indica Cyclanorbis elegans Cyclanorbis senegalensis Cycloderma frenatum Dogania subplana Lissemys punctata Lissemys scuttata Nilssonia formosa Nilssonia gangeticus Nilssonia hurum Palea steindachneri Pelochelys bibroni Pelochelys cantori Pelodiscus sinensis Rafetus euphraticus Rafetus swinhoei Trionyx triunguis
indeed species delimitation based on mitochondrial data alone (Georges & Thomson 2009), reinforces the need for further study including nuclear markers and morphological characteristics to determine the exact nature of this diversity. In some cases, patterns identified in COI match biogeographic patterns that have been documented in better-studied species, suggesting that similar evolutionary processes may have been at play in both. For example, Kinosternon integrum is broadly sympatric with the Central American iguanid species Ctenosaura pectinata, in which high levels of cryptic diversity as well as secondary contact between closely related species have produced patterns of mtDNA structuring (Zarza et al. 2008) similar to those noted here. Observations of low interspecific differentiation (represented here by species in Category III) have been attributed to hybridization and resulting mitochondrial introgression between species, recent speciation or synonymy (Hebert et al. 2004). The frequency of low interspecific divergence in turtles can be attributed to several unique aspects of turtle biology. Evidence from marine
� 2011 Blackwell Publishing Ltd
turtles in the family Cheloniidae (Karl et al. 1995; LaraRuiz et al. 2006) indicates that some turtle species are still able to hybridize after tens of millions years of separation, and instances of intergenus hybridization have been recorded in other turtle families as well (Parham et al. 2001; Buskirk et al. 2005). Interspecies and even intergenus hybridization may then be possible, if not necessarily frequent, in the wild for many species. Low rates of both molecular evolution and chromosomal rearrangement in turtles (Bickham 1981; Avise et al. 1992) may make this hybridization possible by delaying the evolution of genetic barriers to reproduction. Slower rates of molecular evolution may themselves also be an explanation for low levels of differentiation in species that do not hybridize. Because mitochondrial genes tend to accumulate differences at a rate several-fold slower in turtles than in other vertebrates (Avise et al. 1992), species considered ‘recent radiations’ will probably be nearly identical at COI. These alternate explanations can be evaluated for some of the well-studied species by using known species
964 B . N . R E I D E T A L . ranges to rule out hybridization events. Most of the Graptemys species sequenced here are reciprocally allopatric and isolated in separate river drainages (Lamb et al. 1994). Only one species sequenced here (G. gibbonsi) has a range wide enough to overlap with those of other species (G. oculifera and G. flavimaculata), and G. gibbonsi is relatively well differentiated from these two species within the genus for the barcode fragment. As such, current hybridization is unlikely between the Graptemys species examined here. However, hybridization with the more widely distributed Graptemys species (G. ouachitensis and G. pseudogeographica) remains a possibility. Previous molecular work has identified strikingly low differentiation among Graptemys in a coding mitochondrial gene and attributed this to recent (2% intraspecies divergence, the diagnostic characters could unambiguously differentiate each individual in this species from those of other species. In the case of the Trionychidae, 16 of 19 species could be distinguished by simple characters. However, the remaining three species could be identified using the heuristic method of finding a character that unites them with a group containing only species with simple identifiers (all of which can then be distinguished by these characters). In larger families, the number of species for which characters could be found seemed to decline, possibly because of the increased likelihood of homoplasy and back mutations. As such, splitting families into smaller groups and considering compound characters could increase the success of a character-based method. However, a major caveat for all character-based analysis presented here is that, attributed to limited sample size, these character states may not be fixed. For the species examined here, combining identifying characters with distance-based methods offers an effective means of increasing the proportion of species that can be successfully identified. Twenty-four species violating the distance threshold possessed identifying characters, meaning that incorporating these characters into the identification process would increase the total proportion of species identified by more than 10%. Identifying characters could be incorporated by a stepwise
� 2011 Blackwell Publishing Ltd
M U L T I P L E A P P R O A C H E S T O B A R C O D I N G T U R T L E S 965 process, as shown in Fig. 3, in which species are first identified according to distance-based criteria and then by using identifying characters if ambiguities still remain. The CAOS-based online identification engine described here provides a user-friendly means of carrying out the character-based portion of this approach. However, while characters may aid in species identification, they are not a perfect fix. Species that have extremely similar COI haplotypes, such as those in the genus Graptemys, often lacked identifying characters simply because of the lack of available variation in COI. Hybridization and introgression are also serious problems for any mitochondrial identification method. As such, identifying characters provided no resolution for species in Category IV (where introgression was probably an issue). Given the prevalence of introgression among turtle species, the use of a nuclear marker as a supplement to COIbased barcoding methods may be particularly valuable. Promising candidates for a nuclear barcode marker include the following: recombination activation gene 1 (RAG-1; Krenz et al. 2005) and the RNA fingerprint protein 35 intron (R35; Fujita et al. 2004). Many of the specimens used to generate the novel COI sequences included in this work are currently being sequenced for R35 and RAG-1 as part of separate phylogenetic studies focusing on particular taxa, including the Kinosternidae (Iverson JB, Le M in preparation) and the Australian Chelidae (Georges A, Reid BN, Zhang X, Charlton TR, McCord WP, Le M, in preparation); as such, the utility of both R35 and RAG-1 as complements to the COI-based barcoding presented here will be assessed in the near future. While this study shows that accepted barcoding paradigms may be insufficient for species identification in some turtle groups, most species can be effectively discriminated by using a combination of existing methods. The existence of a genetic species identification method for turtles can assist in enforcement of existing laws regulating the traffic of turtles and turtle products and in characterizing the extent of trade in species, especially when these species are traded in otherwise unrecognizable forms. Barcoding could also have a number of possible uses in turtle ecology and conservation beyond its obvious utility in controlling wildlife trade. For example, barcoding of gut contents has been used to elucidate trophic interactions that are hard to observe otherwise (Zeale et al. 2011). With the addition of turtle sequences to the barcode database, these studies could detect depredation of turtle eggs, which is extremely high for many turtle species and constitutes one of the most important sources of mortality for a group that is otherwise superbly well armoured (Spencer & Thompson 2003). Turtles are in urgent need of protection, and the barcode sequences provided here will provide a useful tool for conservation and management.
� 2011 Blackwell Publishing Ltd
Acknowledgments The work described in this report was supported by a generous grant from the Alfred P. Sloan Foundation. TB was funded by H. Wilhelm Schaumann Stiftung (2009–2011) and DAAD (2010). JBI was funded by the Cope Fund through the Joseph Moore Museum of Natural History. The Sackler Institute for Comparative Genomics at the AMNH provided laboratory space, and Sergios-Orestis Kolokotronis provided valuable technical assistance. Blood and tissue samples were generously provided by the Ambrose Monell Cryo Collection at the AMNH, Dave Collins and the Tennessee Zoo, the Berkeley Museum of Vertebrate Zoology, the University of Canberra, the University of Michigan Museum of Zoology, Tag Engstrom and California State University ⁄ Chico, and Victoria Milne and the El Paso Zoo.
References Alacs EA, Georges A, FitzSimmons NN, Robertson J (2010) DNA detective: a review of molecular approaches to wildlife forensics. Forensic Science, Medicine and Pathology, 6, 180–194. Amer SA, Kumazawa Y (2009) Complete sequence of the mitochondrial genome of the endangered Nile soft-shelled turtle Trionyx triunguis. Egyptian Journal of Experimental Biology. Zoology, 5, 43–50. Avise JC, Bowen BW, Lamb T, Meylan AB, Bermingham E (1992) Mitochondrial DNA evolution at a turtle’s pace: evidence for low genetic variability and reduced microevolutionary rate in Testudines. Molecular Biology and Evolution, 9, 457–473. Bergmann T, Hadrys H, Breves G, Schierwater B (2009) Character-based DNA barcoding: a superior tool for species classification. Berliner und Mu¨nchener Tiera¨rztliche Wochenschrift, 122, 446–450. Bickham JW (1981) Two-hundred-million-year-old chromosomes: deceleration in the rate of karyotypic evolution in turtles. Science, 212, 1291– 1293. Buhlmann KA, Akre TSB, Iverson JB et al. (2009) A global analysis of tortoise and freshwater turtle distributions with identification of priority conservation areas. Chelonian Conservation Biology, 8, 116–149. Buskirk JR, Parham JF, Feldman CR (2005) On the hybridization of two distantly related Asian turtles (Sacalia x Mauremys). Salamandra, 41, 21– 26. Cheung SM, Dudgeon D (2006) Quantifying the Asian turtle crisis: market surveys in southern China, 2000-2003. Aquatic Conservation: Marine and Freshwater Ecosystems, 16, 751–770. Costa FO, Carvalho GR (2007) The barcode of life initiative: synopsis and prospective societal impacts of DNA barcoding of fish. Genomics, Society and Policy, 3, 29–40. Crenshaw JW (1965) Serum protein variation in an interspecies hybrid swarm of turtles of the genus Pseudemys. Evolution, 19, 1–15. Damm S, Schierwater B, Hadrys H (2010) An integrative approach to species discovery in odonata: from character-based DNA barcoding to ecology. Molecular Ecology, 19, 3881–3893. Dawnay N, Ogden R, McEwing R, Carvalho GR, Thorpe RS (2007) Validation of the barcoding gene COI for use in forensic genetic species identification. Forensic Science International, 173, 1–6. DeSalle R, Egan MG, Siddall M (2005) The unholy trinity: taxonomy, species delimitation and DNA barcoding. Philosophical Transactions of the Royal Society B, 360, 1905–1916. van Dijk PP, Stuart BL, Rhodin AGJ (2000) Asian Turtle Trade – Proceedings of a Workshop on Conservation and Trade of Freshwater Turtles and Tortoises in Asia. Chelonian Research Foundation, Lunenburg. Dove CJ, Rotzel NC, Heacker M, Weigt LA (2008) Using DNA barcodes to identify bird species involved in birdstrikes. Journal of Wildlife Management, 72, 1231–1236. Eaton MJ, Meyers GL, Kolokotronis S-O, Leslie MS, Martin AP, Amato G (2010) Barcoding bushmeat: molecular identification of Central African
966 B . N . R E I D E T A L . and South American harvested vertebrates. Conservation Genetics, 11, 1389–1404. Feldman CR, Parham JF (2004) Molecular systematics of old world stripenecked turtles (Testudines: Mauremys). Asiatic Herpetological Research, 10, 28–37. Felsenstein J (1989) PHYLIP-Phylogeny Inference Package (Version 3.2). Cladistics, 5, 164–166. Folmer O, Black M, Hoeh W, Lutz R, Vrijenhoek R (1994) DNA primers for amplification of mitochondrial cytochrome c oxidase subunit I from diverse metazoan invertebrates. Molecular Marine Biology and Biotechnology, 3, 294–299. Fong JJ, Chen T (2010) DNA evidence for hybridization of wild turtles in Taiwan: possible genetic pollution from trade animals. Conservation Genetics, 11, 2061–2066. Fujita MK, Engstrom TN, Starkey DE, Shaffer HB (2004) Turtle phylogeny: insights from a novel nuclear intron. Molecular Phylogenetics and Evolution, 31, 1031–1040. Georges A, Thomson S (2009) Diversity of Australasian freshwater turtles, with an annotated synonymy and keys to species. Zootaxa, 2496, 1–37. Gibbons JW, Scott DE, Ryan TJ et al. (2000) The global decline of reptiles, deja vu amphibians. BioScience, 50, 653–666. He J, Zhou T, Rao D, Zhang Y (2007) Molecular identification and phylogenetic position of Cuora yunnanensis. Chinese Science Bulletin, 52, 3305– 3309. Hebert PDN, Ratnasingham S, deWaard JR (2003) Barcoding animal life: cytochrome c oxidase subunit 1 divergences among closely related species. Proceedings of the Royal Society London B, 270, S96–S99. Hebert PDN, Stoeckle MY, Zemlak TS, Frances CM (2004) Identification of birds through DNA barcodes. PLOS Biology, 2, 1657–1663. International Union for the Conservation of Nature (2009) Red List of Threatened Species. http://www.iucnredlist.org/. Accessed 6 March 2009. Ivanova NV, Zemlak TS, Hanner RH, Hebert PDN (2007) Universal primer cocktails for fish DNA barcoding. Molecular Ecology Notes, 6, 998–1002. Jungt SO, Lee YM, Kartavstev Y, Park IS, Kim DS, Lee JS (2006) The complete mitochondrial genome of the Korean soft-shelled turtle Pelodiscus sinensis (Testudines, Trionychidae). DNA Sequencing, 17, 471–483. Karl SA, Bowen BW, Avise JC (1995) Hybridization among the ancient mariners: characterization of marine turtle hybrids with molecular genetic assays. Journal of Heredity, 86, 262–268. Kelly RP, Sarkar IN, Eernisse DJ, DeSalle R (2007) DNA barcoding using chitons (genus Mopalia). Molecular Ecology Notes, 7, 177–183. Krenz JG, Naylot GJP, Shaffer HB, Janzen FJ (2005) Molecular phylogenetics and evolution of turtles. Molecular Phylogenetics and Evolution, 37, 178–191. Kumazawa Y, Nishida M (1999) Complete mitochondrial DNA sequences of the green turtle and blue-tailed mole skink: statistical evidence for archosaurian affinity of turtles. Molecular Biology and Evolution, 16, 782–792. Lamb T, Lydeard C, Walker RB, Gibbons JW (1994) Molecular systematics of map turtles (Graptemys): a comparison of mitochondrial restriction site versus sequence data. Systematic Biology, 43, 543–559. Lara-Ruiz P, Lopez GG, Santos FR, Soares LS (2006) Extensive hybridization in hawksbill turtles (Eretmochelys imbricata) nesting in Brazil revealed by mtDNA analyses. Conservation Genetics, 7, 773–781. Letunic I, Bork P (2006) Interactive Tree of Life (iTOL): an online tool for phylogenetic tree display and annotation. Bioinformatics, 23, 127–128. Maddison DR, Maddison WP (2000) MacClade 4: Analysis of phylogeny and character evolution. Version 4.0. Sinauer Associates, Sunderland, Massachusetts. Messing J (1983) New M13 vectors for cloning. Methods in Enzymology, 101, 20–78. Mindell DP, Sorenson MD, Dimcheff DE, Hasegawa M, Ast JC, Yuri T (1999) Interordinal relationships of birds and other reptiles based on whole mitochondrial genomes. Systematic Biology, 48, 138–152. Naro-Maciel E, Reid B, Fitzsimmons NN, Le M, Desalle R, Amato G (2010) DNA barcodes for globally threatened marine turtles: a novel
registry approach to documenting biodiversity. Molecular Ecology Resources, 10, 252–263. Nijman V, Shepherd CR (2007) Trade in non-native, CITES-listed, wildlife in Asia, as exemplified by the trade in freshwater turtles and tortoises (Chelonidae) in Thailand. Contributions to Zoology, 76, 207–212. Ogden R, Dawnay N, McEwing R (2009) Wildlife DNA forensics—bridging the gap between conservation genetics and law enforcement. Endangered Species Research, 9, 179–195. Parham JF, Simison WB, Kozak KH, Feldman CR, Shi H (2001) New Chinese turtles: endangered or invalid? A reassessment of two species using mitochondrial DNA, allozyme electrophoresis and known-locality specimens. Animal Conservation, 4, 357–367. Parham JF, Stuart BL, Bour R, Fritz U (2004) Evolutionary distinctiveness of the extinct Yunnan box turtle (Cuora yunnanensis) revealed by DNA from an old museum specimen. Proceedings of the Royal Society of London B, 271, S391–S394. Parham JF, Feldman CR, Boore J (2006a) The complete mitochondrial genome of the enigmatic bigheaded turtle (Platysternon): description of unusual genomic features and the reconciliation of phylogenetic hypotheses based on mitochondrial and nuclear DNA. BMC Evolutionary Biology, 6, 11. Parham JF, Macey JR, Papenfuss TJ et al. (2006b) The phylogeny of Mediterranean tortoises and their close relatives based on complete mitochondrial genome sequences from museum specimens. Molecular Phylogenetics and Evolution, 38, 50–64. Rach J, DeSalle R, Sarkar IN, Schierwater B, Hadrys H (2008) Characterbased DNA barcoding allows discrimination of genera, species and populations in Odonata. Proceedings of the Royal Society of London B, 275, 237–247. Rafeliarisoa T, Shore G, Engberg S, Louis E, Brenneman R (2006) Characterization of 11 microsatellite marker loci in the Malagasy big-headed turtle (Erymnochelys madagascariensis). Molecular Ecology Notes, 6, 1228– 1230. Russell RD, Beckenbach AT (2008) Recoding of translation in turtle mitochondrial genomes: programmed frameshift mutations and evidence of a modified genetic code. Journal of Molecular Evolution, 67, 682–695. Sarkar IN, Thornton J, Planet PJ, Schierwater B, DeSalle R (2002) A systematic method for classification of novel homeoboxes. Molecular Phylogenetics and Evolution, 24, 388–399. Sarkar IN, Planet PJ, DeSalle R (2008) CAOS software for use in characterbased DNA barcoding. Molecular Ecology Resources, 8, 1256–1259. Spencer RJ, Thompson MB (2003) The significance of predation in nest site selection of turtles: an experimental consideration of macro- and microhabitat preferences. Oikos, 102, 592–600. Spinks PQ, Shaffer HB (2007) Conservation genetics of the Asian box turtles (Geoemydidae, Cuora): mitochondrial introgression, numts and inferences from multiple nuclear loci. Conservation Genetics, 8, 641–657. Spinks PQ, Shaffer HB, Iverson JB, McCord WP (2004) Phylogenetic hypotheses for the turtle family Geoemydidae. Molecular Phylogenetics and Evolution, 32, 164–182. Stuart BL, Parham JF (2004) Molecular phylogeny of the critically endangered Indochinese box turtle (Cuora galbinifrons). Molecular Phylogenetics and Evolution, 31, 164–177. Tamura K, Dudley J, Nei M, Kumar S (2007) MEGA4: Molecular Evolutionary Genetics Analysis (MEGA) software version 4.0. Molecular Biology and Evolution, 24, 1596–1599. Turtle Conservation Fund (2002) A global action plan for conservation of tortoises and freshwater turtles. Strategy and funding prospectus 2002–2007. 30 pp. Conservation International and Chelonian Research Foundation, Washington, DC. Turtle Taxonomic Working Group (2007) An annotated list of modern turtle taxa with comments on areas of taxonomic instability and recent change. Chelonian Research Monographs, 4, 173–199. Ward RD, Zemlak TS, Innes BH, Last PR, Hebert PDN (2005) DNA barcoding Australia’s fish species. Philosophical Transactions of the Royal Society B, 360, 1847–1857.
� 2011 Blackwell Publishing Ltd
M U L T I P L E A P P R O A C H E S T O B A R C O D I N G T U R T L E S 967 Yassin A, Markow TA, Narechania A, O’Grady PM, Desalle R (2010) The genus Drosophila as a model for testing tree- and character-based methods of species identification using DNA barcoding. Molecular Phylogenetics and Evolution, 57, 509–517. Zardoya R, Meyer A (1998) Complete mitochondrial genomes suggests diapsid affinities of turtles. Proceedings of the National Academy of Sciences of the United States of America, 95, 14226–14231. Zarza E, Reynoso VH, Emerson BC (2008) Diversification in the northern neotropics: mitochondrial and nuclear DNA phylogeography of the iguana Ctenosaura pectinata and related species. Molecular Ecology, 17, 3259–3275. Zeale MRK, Butlin RK, Barker GLA, Lees DC, Jones G (2011) Taxon-specific PCR for DNA barcoding arthropod prey in bat faeces. Molecular Ecology Resources, 11, 236–244. Zhang L, Nie L, Cao C, Zhan Y (2008) The complete mitochondrial genome of the keeled box turtle Pyxidea mouhotii and phylogenetic analysis of major turtle groups. Journal of Genetics and Genomics, 35, 33–40.
Data Accessibility DNA Sequences: Genbank accessions HQ329587– HQ329787; BOLD accessions BENT102-08–BENT335-09. Alignments and trees: TreeBASE accessions S11480.
� 2011 Blackwell Publishing Ltd
Supporting Information Additional supporting information may be found in the online version of this article. Table S1 Descriptive data for all taxa and sequences included in this study. ‘N’ indicates the number of individuals sequences for each species; ‘H’ indicates the number of haplotypes observed in each species; ‘Distance’ indicates the species’ classification within the distance-based scheme described in the text; ‘Diagnostic’ indicates the presence (‘Y’) or absence (‘N’) of familylevel simple identifying characters in the species. References and accession numbers are in bold for novel sequences produced in this study. Please note: Wiley-Blackwell are not responsible for the content or functionality of any supporting information supplied by the authors. Any queries (other than missing material) should be directed to the corresponding author for the article.