Component-Based, User-Constructed, Multiple-View Visualization Chris North* and Ben Shneiderman Human-Computer Interaction Lab, UMIACS & Department of Computer Science University of Maryland, College Park, MD 20742 USA
[email protected],
[email protected] http://www.cs.umd.edu/hcil/snap ABSTRACT
A major hindrance to the usage of information visualization in common tasks is that typically a new visualization interface must be custom programmed to suit each task. This video demonstrates a system and user interface that attempts to solve this problem by enabling end users to construct their own multiple-view visualization interfaces that are appropriate for their tasks and data. Users accomplish this by snapping together component visualizations and specifying tight couplings between them. Then they can use their newly constructed visualization interfaces to perform their tasks. Keywords
User interface, information visualization, multiple views, tight coupling, specification, software components. INTRODUCTION
While research in information visualization has made many advances, several open problems hinder the proliferation of visualization interfaces for use in common tasks. One such problem relates to the need for significant flexibility in visualization interfaces. Each individual task and data set requires a unique visualization interface design. The high cost of custom programming the appropriate interface for each case prevents many cases from receiving attention. As a result, users must employ interfaces that are not well suited to their specific task or data. In addition, these interfaces are usually the lowest common denominator covering many tasks, and therefore typically do not take advantage of the powerful visualization techniques developed by researchers in the field. A potential solution to this problem is to enable the users themselves to design and construct the appropriate visualization interfaces. For users, such a capability must be quick and simple (e.g. not programming). SageBrush [3] enables users to graphically specify new visualizations using an interface similar to a drawing program. As data complexity increases, it becomes more difficult for users to specify sufficiently complex
visualizations. Hence, in Visage [3] users construct multiple simpler views that are tightly coupled for brushing and linking. SNAP-TOGETHER VISUALIZATION
Snap-Together Visualization (Snap) takes the opposite approach. Snap assumes the existence of many such simple single-view component visualizations [1], and focuses on enabling users to specify the tight couplings between them. This is analogous to the component-based software engineering approach, where developers select from a variety of software components and then focus on specifying the interaction between them (although this is usually done by programming). Tight Coupling
Users can construct a wide variety of interfaces using a surprisingly simple specification language for tight coupling [2]. The language is based on previous work on a taxonomy of tight coupling in multiple-view visualizations and significant experience in designing such interfaces. A tight coupling is a constraint between related data items in multiple views. It links user interface actions on data items in one view to (potentially different) user interface actions on related data items in another view. Data relationships are specified in the data itself (e.g. as in a relational database). User interface actions available for tight coupling are view dependent. Each component visualization exports a list of actions that are intrinsic to it that users can choose from. Hence, to tightly couple two views, users simply choose the desired user interface actions for each view and the data relationship to link by. With this method, users can construct a wide variety of multiple-view data navigation styles, such as synchronized scrolling, brushing and linking, overview and detail view, drill down, or detail popups. Component Visualizations
The use of simple component visualizations is advantageous to visualization developers and users. These simple components are relatively easy to implement, and can be widely used in a broad class of situations.
*
Current address: Department of Computer Science, Virginia Tech, Blacksburg, VA 24061.
Furthermore, this approach allows researchers and developers to focus efforts on individual views, leaving the work of augmentation with additional views to Snap. An open architecture allows new visualization components to be tightly coupled by users. Components must implement a simple API for communicating user interface actions that are tightly coupled. This API is similar to common window system APIs for cut-and-paste and dragand-drop. Users can initially load data into component visualizations using standard database formats. SCENARIO
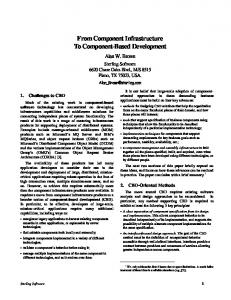
For example, users could explore their electronic folders and files by rapidly constructing a multiple-view visualization interface (Figure 1). An interface similar to Windows Explorer could be constructed by tightly coupling a Hyperbolic view (in [1]) of folders to a tabular view of files. The “select” action of a Hyperbolic view is linked to the “load” action of the tabular view, using the file-folder containment data relationship. Then users can click on folders in the Hyperbolic view to display their files in the tabular view. If additional views are needed, users simply ‘snap’ them on. For example, system administrators, who are responsible for managing disk space, might want an additional view to help discover space usage patterns. A Treemap view (in [1]) of files and folders is tightly coupled to the Hyperbolic view, linking the “select” action of each and using the identity relationship. Then, clicking on a suspicious folder in the Treemap view highlights the corresponding folder in the Hyperbolic view and displays its files in the tabular view. This configuration can then be saved for future reuse or for exporting with data to other users. Select
FUTURE WORK and VISION
This initial work opens up many new opportunities for future directions. Possibilities include visual interfaces for constructing and visualizing tight couplings, extensions to the specification language, additional types of relationships, alternate data types, tight-coupling design guidelines, and application to web authoring, data mining, and multi-user collaboration. This approach enables users to dynamically construct multiple-view visualizations needed for their tasks and data. Users exploit powerful visualization components developed in research such as Hyperbolic trees and Treemaps. Our hope is that this approach can facilitate the widening of the pipeline from information visualization research to practical everyday use. ACKNOWLEDGMENTS
This research was partially supported by funding from West Group and the Census Bureau. Thanks to Catherine Plaisant for video editing. REFERENCES
1. Card, S., Mackinlay, J., Shneiderman, B., (editors), Readings in Information Visualization: Using Vision to Think, Morgan Kaufmann, 1999. 2. North, C., Shneiderman, B. “Snap-Together Visualization: Can Users Construct and Operate Coordinated Visualizations?”, Intl. Journal of HumanComputer Studies, 53(5), Nov. 2000, pp. 715-739. 3. Roth, S., Chuah, M., Kerpedjiev, S., Kolojejchick, J., Lucas, P., “Towards an Information Visualization Workspace: Combining Multiple Means of Expression”, Human-Computer Interaction Journal, 12(1&2), 1997, pp. 131-185.
Select
Load
Figure 1: A multiple-view visualization of folders and files, constructed by users by specifying the tight couplings shown at top between three component visualizations: Treemap (left), Hyberbolic (center), tabular (right).