computer programs SUePDF: a program to obtain quantitative pair distribution functions from electron diffraction data ISSN 1600-5767
Dung Trung Tran,*‡ Gunnar Svensson and Cheuk-Wai Tai* Department of Materials and Environmental Chemistry, Arrhenius Laboratory, Stockholm University, Svante Arrhenius va¨g 16C, Stockholm, S-10691, Sweden. *Correspondence e-mail:
[email protected],
[email protected] Received 26 May 2016 Accepted 21 November 2016
Edited by D. Pandey, Indian Institute of Technology (Banaras Hindu University), Varanasi, India ‡ Present address: Johnson Matthey Technology Centre, Blounts Court Road, Sonning Common, Reading RG4 9NH, UK. Keywords: pair distribution functions; electron diffraction; transmission electron microscopy; disorder.
SUePDF is a graphical user interface program written in MATLAB to achieve quantitative pair distribution functions (PDFs) from electron diffraction data. The program facilitates structural studies of amorphous materials and small nanoparticles using electron diffraction data from transmission electron microscopes. It is based on the physics of electron scattering as well as the total scattering methodology. A method of background modeling is introduced to treat the intensity tail of the direct beam, inelastic scattering and incoherent multiple scattering. Kinematical electron scattering intensity is scaled using the electron scattering factors. The PDFs obtained after Fourier transforms are normalized with respect to number density, nanoparticle form factor and the non-negativity of probability density. SUePDF is distributed as free software for academic users.
1. Introduction The pair distribution function (PDF) method is widely employed for studying structurally disordered materials (Warren, 1990; Egami & Billinge, 2002; Proffen et al., 2003). This is because it gives more structural information, beyond the information given by the traditional Bragg-peak-based analysis, from scattering data. Standard computer programs for PDFs for neutron and X-ray powder diffraction data are well established (Peterson et al., 2000; Juha´s et al., 2013). A number of efforts have been made to obtain PDFs from electron diffraction (ED) data (Cockayne & McKenzie, 1988; Tewes et al., 1994; Takagi et al., 2001; McBride, 2003; Ankele et al., 2005; Ishimaru et al., 2008; Abeykoon et al., 2012; Mu et al., 2013). However, these have not been sufficient to establish electron powder diffraction as one of the major data sources for PDF analysis. The main obstacle has been the multiple scattering of electrons, which may alter the scattering intensities in the ED patterns, making it difficult to extract an undistorted structure function (Uyeda, 1968; Cowley, 1969; Anstis et al., 1988; Cockayne & McKenzie, 1988). Beside this, the electron–matter interaction differs from the cases of X-rays and neutrons, implying that a dedicated procedure of data treatment is needed for ED data. In order to obtain reasonable PDFs, ED data IðQÞ have to be scaled using appropriate electron scattering factors fe ðQÞ to yield a proper reduced structure function FðQÞ, where Q is the magnitude of the scattering vector. This is not an easy task because the ED data are generally contaminated by inelastic scattering and distorted by multiple scattering, instrument errors and noise. The widely reported solution for inelastic scattering is using an energy filter, but this may also cause additional distortion in the data when only electrons of certain energy-loss range can be blocked. Data scaling was previously J. Appl. Cryst. (2017). 50
https://doi.org/10.1107/S160057671601863X
1 of 9
computer programs carried out by multiplying the compositional averages hfe2 ðQÞi and hfe ðQÞi2 with a fitting parameter !, which may be fixed by matching !hfe2 ðQÞi with IðQÞ at large Q (Cockayne & McKenzie, 1988; Cockcayne, 2007; Cockayne et al., 2010). An early software attempt to fit IðQÞ with hfe2 ðQÞi for PDF extraction was made by drawing and then subtracting a background of IðQÞ (Hauschild, 2009). However, because the mathematical curve presented for this background is generally not suitable, the background is often constructed manually. The next software attempt was made by Mitchell & Petersen (2012), in which an additional fitting parameter " was introduced to counter the discrepancy between IðQÞ and !hfe2 ðQÞi. This meant that FðQÞ was obtained by matching !hfe2 ðQÞi # " with IðQÞ at large Q. In other work, instead of introducing an additional parameter, FðQÞ was directly adjusted by fitting the distortion feature to a fourth-order polynomial (Mu et al., 2013). The program SUePDF aims to effectively correct ED data by taking into account the multiple scattering features and uniqueness of electron–matter interactions. For amorphous materials, the coherent multiple scattering can be considered as insignificant and incoherent multiple scattering should merely contribute to the background (Cowley, 1992), which may be modeled and subtracted. For crystalline-like nanoparticles, coherent multiple scattering should not affect the peak positions of the resulting PDFs but only the peak intensities. This has been demonstrated to be the case for crystals having a thickness of less than five times the electron mean free path (Anstis et al., 1988). The problem with modulated peak intensities caused by coherent multiple scattering is tackled in SUePDF by a renormalization procedure based on number densities, and the probability of having an atom at a certain distance is non-negative. In general, the major distortion of IðQÞ can be considered to form a smooth background, which is built up from the direct-beam tail,
inelastic continuum and incoherent multiple scattering. SUePDF employs the combination of an optimizing parameterization and a reasonable mathematical model for the background. Inside SUePDF, background subtraction is coupled with data scaling in a loop-based routine to optimize the data treatment. After background subtraction and data scaling, the PDF can be obtained by a Fourier transform of the normalized data. On the basis of the physical meaning of PDFs, noise filtering and normalization procedures have to be routinely carried out. This improves the physical reliability of the outcome PDFs and allows the uncertainties to be evaluated. SUePDF also offers the possibility to correct finite size effects present for nanoparticles, by using a nanoparticle form factor computed for a given size and shape.
2. Methods 2.1. Background modeling
The smooth background observed for ED data is considered to be the contributions from the direct-beam tail, inelastic scattering continuum and incoherent multiple scattering. For an elastic scattering of a #-wavelength electron with a semi-angle $, Q ¼ 4% sin $=#, but in the case of smallangle inelastic scattering (Egerton, 2011) "! "2 ! "2 #1=2 4% sin $ 2%$ þ ; ð1Þ Q¼ # # where $ ¼ &E !E=½KE ð1 þ &E Þ' is the characteristic angle corresponding to an energy loss !E; &E ¼ ð1 þ KE =E0 Þ is the relativistic factor with KE the kinetic energy and E0 ’ 511 keV the stationary mass-converted energy of the electron. Equation (1) can be rewritten for the inelastic component when $ ¼ 0 as
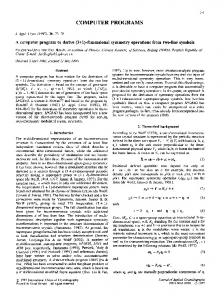
Figure 1 Background modeling for electron powder diffraction data (solid black line) of nanoporous carbon: power-law model (dashed red line) compared with Laurent-type model (dotted blue line) [equation (3)] with N ¼ 7.
2 of 9
Tran, Svensson and Tai
(
SUePDF
Figure 2 Normalized IðQÞ of a nanoporous carbon sample (back solid) and the corresponding hfe2 ðQÞi ¼ fe2 ðQÞ; the inset shows a ring pattern reconstructed from this normalized IðQÞ. J. Appl. Cryst. (2017). 50
computer programs Qinel ð!EÞ ¼
2%&E !E : #KE ð1 þ &E Þ
ð2Þ
For example, if the electron energy loss is counted up to 2000 eV for an incident beam of 200 keV, then the inelastic ˚ #1. For lowbeam tail is limited to below Qinel ð2000Þ ’ 1:46 A loss electrons (!E < 50 eV), the inelastic component ˚ #1. Equation (2) means that Qinel ð