BOUNDARY FIELD PROBLEMS AND COMPUTER SIMULATION. ENVIRONMENTAL SIMULATION. Riga 1999 _______________________________________________________________________________________________
SELECTED RESULTS OF LIGHT FIELD MODELING ABOVE THE SEA SURFACE COVERED BY THIN OIL FILM Z. Otremba Maritime Academy, Physics Department Address: ul. Morska 81-87, 81 225 Gdynia, Poland Phone: +4858 6289385; Fax: +4858 6206701 E-mail:
[email protected] Summary: This work presents the description of the procedure of modeling of light field above the sea surface covered by thin oil film. Simulations of the fate of 5 million light photons of solar radiation, which reaches the sea surface, were made. The sea basin model applied included wind waves, sea depth, sea bottom shape and water optical properties. The optical properties of sea surface covered by oil film were derived numerically, by means of simulations of electromagnetic wave transmission in air-oil-water system, separately for upward and downward light. During simulations of photon fate only those photons, which returned to the atmosphere in determined angle ranges were registered. The simulations were made for two chosen angles of incidence: 20o and 60o. It was observed that the oil film contrast on the wavy sea surface changed the sign with changes of angle and direction of observation.
INTRODUCTION The reports of the aerial surveillance of the seas reveal that occurrence of oil film on sea surface is not a rare phenomenon. A several hundred oil spillages are reported in the Baltic Sea every year (HELCOM, 1998a), most of them are rather small. In 1996 a 402 oil spillages were recorded, among which 5 % were the spills which volume was greater than 1 m3, and no spills of volume greater than 100 m3 were registered. In 1997 a total of 410 oil spillages were reported, among which about 10 % were the spills of volume greater than 1 m3, and no big spills were observed. According to data collected by the Combating Committee of HELCOM (HELCOM, 1998b) since 1994 no oil patches have been observed in the Gulf of Riga. It must be kept in mind that such information may be a result of variable intensity of observations due to the fact that since the beginning of patrol flights over this area in 1990, the number of aerial surveillance hours in the sea waters of Latvia has been decreasing (in 1990 and 1991 – 400 hours, in 1992 – 127 hours, in 1993 – only 24 hours, and in 1997 no patrol flights). Despite lack of large oil spills in the Baltic Sea, the risk of their occurrence is still real, due to the fact that in a year 2001 an estimated 150 million tons of oil will be transported across the Baltic Sea, which constitutes 70 million tons more than in 1995 (Magnusson, 1998). The oil input to the Baltic was determined twice: in the 1980s in a range from 50 to 100 thousand tons per year (Enckell, 1987), and in 1990 from 21 to 66 thousand tons per year (HELCOM, 1993). The HELCOM Technical Committee (HELCOM/TC) is planning to arrange an international system of measurements of oil input from land in year 2000 and publish the data in 2003 in the Fourth Pollution Load Compilation (PCL-4) (HELCOM, 1998c). In 1998 HELCOM introduced a number of recommendations concerned with the improvement of ship technology and
control and collection of sewage in ports, which are supposed to result in further limitation of oil pollution from ships (HELCOM, 1998d). From the moment of oil film occurrence on the sea surface until its full degradation a relatively short time is needed, probably not exceeding several weeks. Degradation of oil films is faster due to the following factors: bacteria activity, solar radiation, wind and sea surface motion. Quantitative estimations of the degree of coverage of the Baltic Sea by oil films are difficult and they will probably be possible with improved satellite detection techniques. In order to create the foundations for effective identification of oil films in the VIS range of light it is necessary to determine the optical properties of oil films on the sea surface. The angular changes of coefficients of light reflectance and transmittance are especially important. Knowledge of these parameters is necessary to model light field in seawater, as well as, to model the upward light field above the sea surface. The second case is very important in remote sensing of the sea surface in the VIS range of spectrum. 1. DESCRIPTION OF THE APPLIED MODELING METHOD FOR THE UPWARD LIGHT FIELD ABOVE THE SEA SURFACE COVERED BY OIL FILM Modeling of light field above the sea surface covered by oil film is made in several stages. In the first stage, the optical properties of the oil film on the sea surface are determined. These properties are described by the complex light refraction index mˆ . The mˆ coefficient consists of two parts, the real part k, i.e. classic refraction index determined by means of refractometry and the imaginary part, i.e. the dimensionless coefficient of light absorption k, which is derived by means of spectrophotometry (formula 1.1).
ˆ = n +i k m where: n – real part of light refraction index k – imaginary part of light refraction index i – imaginary factor
(1.1)
The exemplary spectral plots of parts n and k of the complex light refraction index mˆ are presented in Chapter 2. In the second stage of determination of the above sea surface light field, the modeling of the angular dependencies of the following four optical parameters of oil film covering the sea surface is carried out: - downward light reflectance R↓ - upward light reflectance R↑ - downward transmittance T↓ - upward transmittance T↑.
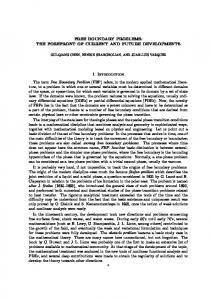
Fig.1.1. Simplified scheme of modeling of oil sheens contrast.
The chosen results of modeling of these parameters are presented in Chapter 3. In the third, i.e. last stage, modeling of above sea surface light field is carried out. It involves simulations of fate of particular solar radiation photon inciding on the sea surface. As a result of simulations for a large number of photons, the upward radiation distribution
above the sea surface is obtained with a satisfactory accuracy. The analysis of the angular distribution of the radiation yields the oil patch contrast c for a determined direction of observation (1.3). c= where: Lo↑(θ,Φ) Lw↑(θ,Φ) θ,Φ -
L o ↑ ( Θ, Φ ) - L w ↑ ( Θ , Φ ) L w ↑ ( Θ, Φ )
(1.3)
above sea upward radiation in directions θ,Φ, from the sea surface covered by oil film above sea upward radiation in directions θ,Φ, from clean sea surface angular coordinates according to Dera notation (Dera, 1992)
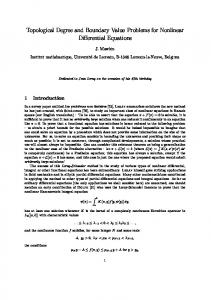
Figure 1.1 presents the simplified diagram of modeling of the oil patch contrast with the three modeling stages distinguished: • first stage – determination of oil optical parameters, necessary in stage two, • stage two – modeling of oil optical parameters, which are necessary in stage three, • stage three – modeling of light field above sea surfaces, clean and covered by oil film. 2. OPTICAL PARAMETERS OF OIL AND SEA WATER As mentioned in Chapter 1, in order to determine the optical parameters of oil films covering the sea surface, it is necessary to determine parameters no and ko of the complex light refraction index mˆ o in oil, described by formula 1.1. The real part no was determined using the Abbe refractometer with thermostat. The measurements were carried out in various temperatures (from 0oC to 40oC). Figure 2.1a presents variations of light refraction index at temperature of 10oC versus wavelength. The results were obtained for the Romashkino type oil. The imaginary part ko was determined by means of the SPECORD UV VIS spectrophotometer. The measurements of light absorption coefficient were carried out in the measurement cuvette of light path 1 mm long, in which the solutions of mixture of oil and n-hexane were placed. The ko parameter was determined by employing the extrapolation to the concentration of 100%. Figure 2.1b presents the changes of ko coefficient versus light wavelength. While modeling the four oil film optical parameters (R↓ , R↑ , T↓ and T↑), which were described in Chapter 1, it is necessary to know the no and ko parameters of the crude oil and the real part of the light refraction coefficient in water nw. The imaginary part kw in water is in this case insignificant, since it does not strongly influence the interaction of light and oil film.
Fig. 2.1. Dependence of (complex) light refraction index in crude oil Romashkino versus light wavelength; (a) real part of the light refraction index, (b) imaginary part of the light refraction index.
The imaginary part of light refraction index in water kw becomes very important during simulations of photon fate in water (see Chapter 4). Then, the light absorption coefficient bw, is introduced. It is combined with the kw parameter as follows (Feynman, 1963): kw =
aw λ 4π
(2.1)
where: kw - imaginary part of the complex light refraction index in water, also called the dimensionless light absorption coefficient aw - light absorption coefficient in water λ - light wavelength
The aw parameter for seawater varies with sea regions and seasons, and in the coastal area also on the intensity of river input. There is a relatively large knowledge about light attenuation in seawater (described as light attenuation coefficient cw). Parameter cw is combined with the parameter aw through the other parameter, light scattering coefficient, bw on which light attenuation in the sea depends. Parameters aw, bw and cw are combined as follows: c w = aw + b w
(2.2)
Values of parameters bw and aw of light attenuation coefficient are known to much less extent than the attenuation coefficient cw itself. Importance of parameters aw and bw in parameter cw may vary with sea region, season, current hydrometeorological conditions, river input, plankton blooming (type, phase and intensity), etc., (Olszewski et al., 1992). In seas and especially in bays and gulfs water transparency is much lower than in oceans. However, it is assumed that the angular light scattering distribution (the so-called phase function) in particular regions of the sea is similar. The most common is the Petzold distribution (Petzold, 1977). Variability of both parameters aw and bw is occuring in a broad range. Dera (1992) announces that aw varies from 0.012 m-1 (Nord Equatorial Current, λ = 490 nm) to 2.7 m-1 (Baltic, Gulf of Riga in the summer of 1970, λ = 390 nm) and bw - from 0.0014 m-1 (clean ocean water, λ = 600 nm) to 0.55 m-1 (North Sea, λ = 520 nm). The value of bw can rich 1.5 m-1 in coastal waters (Wozniak, 1977). In this paper the parameters aw and bw have been arbitrary selected for a range occurring in sea water: aw = 0.03, bw = 0.35. 3. MODELING OPTICAL PARAMETERS OF SEA SURFACE COVERED BY OIL FILM
Fig. 3.1. Interaction of electromagentic wave with oil film covering water surface.
Oil film on water surface creates three component optical set up: airoil-water. Light inciding on oil film goes through two interfaces of changes of the complex light refractive index mˆ , on which it is partly reflected. Light going through oil is attenuated. As an effect of interaction of waves reflected on interfaces of media and waves which go through them the net light fluxes are created. Application of the oil layer model, as presented in "Figure 3.1", and by employing numerical wave superposition the values of R↓ , R↑ , T↓ and T↑ which are described in Chapter 1 are obtained.
The angular dependencies of coefficients R↓, R↑ , T↓ and T↑ in case of clean water are determined by employing the Fresnel formulae (Dera, 1992). In order to derive these coefficients, only the real part of the light refractive index in water nw is needed. Also, true is then the energy conservation principle and the following equalities, R↓ + T↓ = 1 and R↑ + T↑ = 1.
Fig. 3.3. Dependence of light reflection coefficient through oil film on angle of light incidence for downward light (a) and upward light (b)
Fig. 3.3. Dependence of light transmittance through oil film on angle of light incidence for downward light (a) and upward light (b)
When oil film occurs significant role is played by oil optical properties, no and ko. Shapes of angular plots of these functions to a great extent depend on film thickness, wavelength and direction of incidence (Otremba, 1997) as well as on type of oil (Otremba, 1999). The chosen results of interactions between light wave with oil film are presented in Figures 3.2 and 3.3, as variations of parameters R↓ , R↑ , T↓ and T↑ on angle of light incidence.
4. SIMULATION OF ABOVE WATER LIGHT FIELD ABOVE THE SEA SURFACE The modeling of above water light field employs the Monte Carlo method, in which fate of a large number of photons which incide on sea surface is simulated. The main stage in simulations of photon fate is the determination of distributions of probability of photon interaction with oil film covering the sea surface. Photon, when it incides on sea surface may be reflected or may go through the oil film to water or it can be absorbed in oil film. The analogous situation occurs when photon
travels from the sea. Probabilities of reflection or transmission, in different directions of photon path are different. The angular distributions of these probabilities depend on shapes of angular plots of parameters R↓ , R↑ , T↓ and T↑ described in the previous chapter. The photon incidence angle on oil film is also scarce, since it depends on short-time inclination of wave slope on free sea surface. The problem of the choice of function, which describes probability distribution of inclination of wave slopes, is complicated and so far it has not been investigated thoroughly. In this paper the socalled Cox-Munk distribution (Cox and Munk, 1955) is applied. This distribution properly describes the probability distribution of the inclination of wave slopes for an open sea and for fully developed wavy motion. Photons, which were not reflected on the surface and were not absorbed in the oil film, reach sea water, where they may be absorbed or may be scattered on scattering centers. Angles of particular scattering are scarce-they are described by the Petzold distribution. The absorption or scattering of photon in water depends on probability distribution with respect to coefficients of absorption and scattering. Some photons have a chance to reach the bottom of the sea, where are either absorbed or reflected. The direction of majority of photons reflection on the bottom is equal to the incidence angle, however, fixed percentage of photons is reflected in scarce directions, which are concerned with the number drawn numerically by the number generator. Photons, which after some time in water, reach the surface are reflected, absorbed or go through to the atmosphere. Probabilities of reflection or transmission depend on functions R↑ and T↑, respectively, and the inclination of wave slopes on the sea surface. In the case, which is being described in this paper, the sea depth is 20 m. Probability of return of photons reflected on the sea bottom, in this case is very small, since the accepted values of parameters aw and bw (see Chapter 2) relate to the sea of visibility up to several meters (typical for bay or gulf waters in summer). Analysis of sea depth influence on visibility of oil patches was presented in 40th issue of that periodic (Otremba, 1997). Obviously, the best information about the above sea light field would yield the radiation distribution L↑(Θ,Φ) presented in an analytical form. The theoretical identification of this function is possible provided that the algorithm which transponds the solar radiation L↓(Θ,Φ) to L↑(Θ,Φ) is known. Majority of solutions in this field however, employ numerical methods, which yield tabelarized radiation L↑(Θ,Φ). The similar situation occurs when the Monte Carlo method is employed. This method yields values of illumination which refer to determined small solid angles, i.e. an integral from radiation in a range of a small solid angles (in this paper it is π/30 sr), that the definition of contrast (formula 1.3) is still valid, when radiation is replaced by percent number of photons which reach a particular angle sector. The required accuracy in the Monte Carlo method is obtained by means of increase of number of sectors and by the increase of number of tested photons. Large numbers of photons, however, increases the computation time. To achieve satisfied accuracy, not less than 1 million photons, should be used for light flux simulation. In the case described 5 million photons were tested, which using computer PC 486 120 MHz required 2 hours of computations for the angle of incidence 20o and about 12 hours for an angle of 60o. The Monte Carlo method, due to the long time of computations becomes practically useless when the sea surface is wavy and the angle of photon incidence is greater than 80o.
5. RESULTS AND DISCUSSION The results of calculations of percent number of photons, which run from the sea surface towards the observer (an eye or a detector telescope) are presented in Figure 5.1. Calculations were made by employing two directions of directed solar illumination: 20o (curves a) and 60o (curves b). Observation (detection) of photons was made in two planes: in the plane of solar light incidence and in the plane perpendicular to the plane of solar light incidence. In the incidence plane both photons running to atmosphere at negative angles (graph plane A) and at positive angles (graph plane B) were registered.
Data presented in Figure 5.1, combined with results of simulations of photon fate in the sea with surface without oil film are presented in Figure 5.2. The results in Figure 5.2a relate to photons registered in the plane of solar light incidence, while the results in Figure 5.2b – in the plane perpendicular to the plane of solar light incidence.
Fig. 5.1. Percent number of returning photons to the angular sector in the atmosphere as a function of angle of observation in the plane of solar light incidence (graphs A and B) and in the plane perpendicular to the plane of solar light incidence (graphs C and D). Graphs (a) refer to angle of light incidence of 20o, graphs (b) - 60o.
Fig.5.2. Percent number of returning photons to the angular sector in case of clean water (dotted line) and water covered by oil film (solid line); in the plane of solar light incidence (a), in the plane perpendicular to the plane of solar light incidence (b).
In order to illustrate the influence of oil film on the amount of light, which reaches the above water detector the contrast of oil film versus clean sea surface was calculated. Figure 5.3a presents the dependence of the contrast on the observation angle in the plane parallel to solar light and in Figure 5.3b – in the plane perpendicular to the plane of solar light incidence. The clear dependence of contrast on solar light incidence direction is observed. If the observation is made perpendicularly downward then the oil patch may have a positive contrast, provided that the angle of solar light incidence is small. If the solar light incidence angle is large the contrast becomes negative. In case of small incidence angle the maximum positive contrast occurs when the observation occurs at an angle close to the angle of solar light incidence. If the oil patch is observed in the perpendicular plane to the plane of solar light incidence then
Fig. 5.3. Changes of contrast of oil film as a function of the angle of observation;
in the plane of solar light incidence (a), in the plane perpendicular to the plane of solar light incidence (b).
the maximum of contrast occurs at zero angle of observation. The graph reveals symmetric character with respect to zenithal direction, which seems to be obvious, since the wind direction is in the plane of solar radiation incidence. If the wind direction is in other plane the symmetry will probably be distorted. Therefore, the question is if there is an angle at which the sea surface should be observed that in case of oil patch the probability of its noticing would be maximal? In order to analyze this phenomenon more systematic investigations should be made including different directions of solar light incidence, cloudy conditions when significantly scattered solar light reaches the sea surface.
SUMMARY Determination of the distribution of upward radiation above the wavy sea surface covered by oil film and then determination of the oil patch contrast is possible by employing two-stage modeling based on measurements of optical properties of oil. The first stage of modeling is the determination of optical properties of oil film on water surface by employing simulations of transmission of electromagnetic waves. The second stage is modeling of above water upward light fluxes by employing simulations of solar light photons fate by means of the Monte Carlo method. The results of modeling of upward light field above the sea surface covered by oil film yield data for estimations of visibility of oil patches as a function of direction of observation. Contrast of oil patches versus clean sea areas is possible to be determined if the following parameters are determined: optical properties of oil, film thickness, coefficients of light absorption and scattering
in water, wavy motion, distribution of above water downward solar radiation, sea depth and type of sea bottom. If the oil spill is large, it is easy to be noticed since light is not transmitted from water. In such case the picture of oil patch depends only on light reflection from the surface. The problem of visibility becomes significant when the oil film becomes very thin, almost transparent. Then its contribution in creation of above sea light field depends on angle of observation, the above mentioned optical parameters of seawater, and even on sea bottom bathymetry in the region investigated. REFERENCES - Cox , C. and Munk W., 1954, Measurement of the roughness of the sea surface from photographs of the sun’s glitter: J. Opt. Soc. Amer., no. 11, p. 838-850. - Dera J., 1992, Marine Physics: Warszawa, PWN-Polish Scientific Publishers, Amsterdam-Oxford-New York-Tokyo, ELSEVIER (coeditor), 516 p. - Feynman R.T., Leighton R.B. and Sands M.C., 1963, The Feynman's Lectures on Physics, v. I i II, Massachusetts, USA, Wesley Publ.Co., Reading. - HELCOM, 1998a: Overview on activities 1997, Balt. Sea Environ. Proc. No. 73. - HELCOM, 1998b: Report of 22nd meeting of the Combatting Committee (HELCOM CC) of the Helsinki Commission - Baltic Marine Environment Protection Commission. CC 22/98, 11/1, Helsinki, 13 November 1998 - HELCOM, 1998c: Waterborne pollution load compilation 2000, HELCOM Recommendation 19/4. - HELCOM, 1998d: Measures in order to combat pollution from offshore units. HELCOM Recommendation 19/17. Application by the Baltic Sea states of guidelines for holding tanks/oily water separating or filtering equipment for ships of less than 400 tons gross tonnage, HELCOM Recommendation 19/10. - Enckell E., 1987: Oil pollution load on the Baltic Sea; A compilation of measured and estimated load. Baltic Marine Environment Protection Commission, Seminar on Oil Pollution Questions, Balt. Sea Environ. Proc. No. 22, p. 122-130. - Magnusson K., 1998: Oil handling in the Baltic Sea Area, 1996-2001, SSPA Maritime Consulting AB, Report 7935-2 - Otremba Z., 1997a: A thin oil film covering the sea surface as a modifier of the downward transmission of light, Oceanologia, 39, p. 397-411. - Otremba Z., 1999: Influence of a type of oil on reflectance function of the sea surface contaminated by an oil film, (submitted to Oceanologia). - Olszewski J., Sagan M. and Darecki M.,1992: Spatial and temporal changes in some optical parameters in the Southern Baltic. Oceanologia 36, p. 138-758. - Otremba Z., 1997b: Comments on the impact resulting from varying parameters of oil films on upward light field formation in natural conditions in the Gulf of Riga. [In] Environment Modelling Technologies (40 issue of series: Boundary Field Problems and Computers), Riga Technical University, p. 5-11. - Petzold T., 1977: Volume scattering functions for selected ocean waters. In Light in the Sea, J.E.Tyler (red.) Dowden, Hitchinsons and Ross Inc., Strounburg, Pennsylvania, p. 152-174. - Wozniak B., 1977: The Influence of Sea Water Component on the Underwater Light Field in the Sea (in Polish). Ph. D. thesis, Institute of Oceanology, Polish Academy of Sciences, Sopot.