Proceedings of Building Simulation 2011: 12th Conference of International Building Performance Simulation Association, Sydney, 14-16 November.
COMPUTER SIMULATION AND EXPERIMENTAL MEASURMENTS FOR AN EXPERIMENTAL PCM-IMPREGNATED OFFICE BUILDING Augustin Tardieu1, Sam Behzadi, 2John. J.J Chen2 and Mohammed. M. Farid2* 1 Ecole Nationale Supérieure des Mines de Nancy (INPL), France 2 Department of Chemical & Materials Engineering, University of Auckland, New-Zealand *Email:
[email protected] provide very suitable PCM containment. The selection of appropriate PCMs is a major issue since there are many options for use in building materials. Materials most commonly studied are hydrated salts, paraffin waxes and eutectics of organic and inorganic compounds. Materials to be used for phase change thermal energy storage must have a large latent heat and high thermal conductivity. They should also melt congruently with minimum sub-cooling and be chemically stable, cheap, nontoxic and non-corrosive. (Ibanez et al., 2005, Feldman et al., 1995, Feldman et al., 1993, Feldman et al., 1989, Hasan and Sayigh, 1994, Hasan, 1994a, Hawes et al., 1989, Hawes et al., 1990, Farid et al., 2004, Hasan, 1994b). In building construction, the use of phase change materials (PCMs) allows the storage and release of energy from received solar radiation passively and also from internal loads. Thermal improvement in buildings with PCMs depends on a number of parameters including climate, design and orientation of the building, and on the amount and properties of PCM used. To arrive at optimal properties of PCM and buildings characterizations, modelling of the thermal effects of PCMs is required to achieve a suitable thermal response. (Farid et al., 2004, Farid and Kong, 2001, Khudhair and Farid, 2004, Mazman et al., 2008, Zalba et al., 2004). Much of PCM application has been limited to laboratory scale testing. However, with advancement in technology, computer simulations are more extensively used to study the effect of PCM in real buildings. Computer simulation provides a rapid and low cost method of testing. It should be noted that this can only be done when an accurate and valid model has been created (Kuznik and Virgone, 2009, Kuznik et al., 2010) . The objective of this paper is to conduct a series of simulations using EnergyPlus for a single room cubical to create a model that can be used to accurately predict internal temperature changes in buildings. The simulation models were validated for accuracy using data collected from experimental buildings at the University of Auckland, New Zealand, Tamaki Campus.
ABSTRACT In building construction, the use of phase change materials (PCMs) allows the storage/release of energy from solar radiation and/or internal loads. The application of such materials for lightweight construction such as wooden houses improves thermal comfort and reduces energy consumption. The objective of this paper was to show experimentally and through a computer simulation (EnergyPlus) that PCM impregnated in building walls can provide significant thermal energy storage benefits. For these simulations Paraffin (RT21) was used because of its desirable thermal and physical attributes. The results obtained clearly illustrate that the use of PCM can effectively reduce daily fluctuations of indoor air temperatures and thus reducing the need for cooling and heating devices.
INTRODUCTION Energy is fundamental to economic and social development. Energy consumption within a country is a function of the economy, population, physical and environment climate, natural energy resources. As the planets supply of fossil fuels starts to dwindle, and demand for energy continues to rise, energy price will increase considerably putting strain on global economy. Therefore, new and improved methods of harnessing and storing and reuse of renewable energy must be found. Development of energy-efficient building has been the focus of many studies. Since the 1980’s significant efforts have been made to find alternative and more efficient building materials which can assist in reducing the energy needed for air conditioning and heating of residential and commercial buildings. One of the approaches has been to use phase change materials with high latent heat of melting to increase the thermal mass of buildings in an effort to reduce the amount of energy required to heat and cool them. Thermal storage with phase change provides much higher energy storage density with a smaller temperature fluctuation compared to sensible heat storage. Building materials such as gypsum wallboards
- 56 -
Proceedings of Building Simulation 2011: 12th Conference of International Building Performance Simulation Association, Sydney, 14-16 November.
of the temperature variations into the cabin C2 are discussed by (Khudhair and Farid, 2007). The experimental measurements collected in both cabins “Actual results” and the weather records “Actual weather data” are used to show how simulation can accurately be used to predict temperature changes inside buildings based on external metrological conditions.
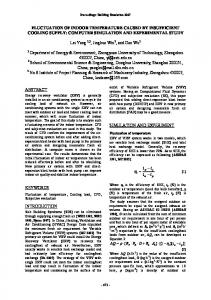
EXPERIMENTAL METHODLOGY Experimental setups Two identical cabins were built on the Tamaki Campus of the University of Auckland. The first one, C1, is the reference cabin. The gypsum interior panels of the second cabin (C2) walls were impregnated with 27 wt% of PCM [Rubitherm® GmbH, named RT21]. This is a paraffinic PCM with a melting range of 18 to 23 °C and a latent heat of fusion of 134 kJ.kg-1. The impregnation of the gypsum boards was realized by capillarity absorption of the PCM. The buildings dimensions are 2.60 x 2.60 x 2.60 m. They are mainly timber made, plus insulation materials in the walls and the ceiling. They are elevated (0.40 m from the ground) and fitted with a door (East oriented) and a window (North oriented).
EnergyPlus EnergyPlus is a Simulation Software package developed by the U.S. Department of Energy. It enables modelling of heat transfers in buildings while providing for consideration of a large range of HVAC equipments. Its extensive building design options, makes it a very powerful software and ideal for this study. EnergyPlus is based on the FORTRAN language. Two input files are necessary to run the simulation:
The IDF-file (EnergyPlus Input Data File): it contains all the information about the location, geometry, materials, structure and all the HVAC equipments in the building,
The weather file: this file collects a large amount of local weather data. We will describe it further in the document. To examine the effect of PCM and accurately predict internal temperature changes, interior load such as heaters, heat pumps, computer and lights were excluded from this analysis. Furthermore, as it will be described later, actual recorded weather data was used to simulate the temperature changes within the cubical. Within the EnergyPlus program, the most important requirements are the building materials used for the walls. Figure 3 shows the main configuration used to construct the walls and the ceiling in the simulations of the cabins. From the internal to the external side, the layers are gypsum wallboards, insulation, wood and siding. This is similar to the walls and ceiling used in the cabin construction.
Figure 1 Cabins structure
Insulation
Siding
External Side
Figure 2 View of the cabin C2
Internal Side
Both cabins were fully instrumented with thermocouples connected to a computer located in another cabin that collected data. Local solar radiation, wind speed and outside temperature were continuously measured.
Gypsom Boards
Wood
A (Cabin 1 walls)
Experimental records Details of the experimental results that emphasize the efficiency of the PCM in reducing the amplitude
- 57 -
Proceedings of Building Simulation 2011: 12th Conference of International Building Performance Simulation Association, Sydney, 14-16 November.
PCM
Insulation
from weather records collected in meteorological stations close to the considered location. They often are hourly mean values collected over a ten year period.
Siding
External Side 400
Internal Side
Gypsom Boards
Enthalpy (kJ/kg)
350
Wood
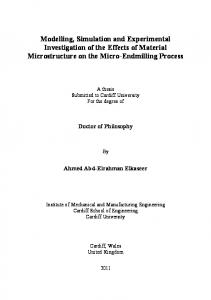
B (Cabin 2 walls with PCM) Figure 3 A & B A schematic layering of the walls for PCM no PCM offices Table 1 and 2 provide the thermal conductivity, density, specific heat, and thickness of each layer used in constructing the walls and ceiling (Khudhair et al., 2007).
Conducti vity (W/m K)
Density (kg/m3)
Sp.heat (kJ/kg K)
Thickness (m)
Board
0.25
670
1.089
0.013
Insulati on
0.038
32
0.835
0.094
Wood
0.12
510
1.38
0.025
Siding
0.094
640
1.17
0.01
250 200 150 100 50 0 0
20
40
60
80
100
120
Temperature (oC)
Figure 4 Enthalpy Vs Temperature In this paper, the weather file of Auckland city provided by EnergyPlus is referred to as “Historical weather file”; and the weather data of this specific file is named “Historical data”. The authors developed a model taking into account the cabins’ dimensions, structure, materials, air leakage, etc. The simulation was initially launched using the historical weather file. The simulation results were consistent and physically acceptable. Indeed, the C2 interior air temperature variations were reduced compared to the C1 ones (Khudhair et al., 2007, Behzadi and Farid, 2010). However, these simulation results were not sufficient for testing the quality and the robustness of the model because it was difficult to compare with actual measurements. As illustrated in Figures 5 and 6, the historical and actual weather data are very different. Therefore, suggesting that the historical data cannot be used as input to the model for the purpose of its validation.
Table 1 Thermo-physical properties of the no PCM mass types used in the EnergyPlus modelling Mass Name
300
Table 2 Thermo-physical properties of the PCM used in the PCM office (Khudhair et al., 2007). Conuctivity (W/m.K)
Density
Sp. heat (kJ/kg.K)
Latent Heat (kJ/kg)
Melting point (oC)
Thickness
(kg/m3)
0.2
810
2.1
134
18-23
0.004
(m) 14
historical data
Wind Speed [m/s]
12
As illustrated in Figure 4, the latent heat was introduced in EnergyPlus as Enthalpy Vs Temperature. Other software’s like Sunrel assume the latent heat to occur at a fixed temperature. This is restrictive, hence cause modelling inaccuracies.
actual weather data 10 8 6 4 2
Weather file The weather file contains a large collection of local weather data including ambient temperature, direct solar radiation, wind speed, relative humidity, and illuminance. The EnergyPlus database offers the possibility to download the pre-recorded weather files for many locations; in particular, the weather files of Auckland city. The data are complexly calculated
0
Figure 5 Comparison between historical data and actual data for the wind speed (from 20/02/09 to 04/03/09)
- 58 -
Proceedings of Building Simulation 2011: 12th Conference of International Building Performance Simulation Association, Sydney, 14-16 November.
1200 1000
Actual data Sim / actual data
800
30
Temperature [°C]
Sunshine [W/m2]
35
historical data actual weather data
600 400 200
25
20
0
Sim / historical data 15
Figure 6 Comparison between historical data and actual data for the solar radiation (from 20/02/09 to 04/03/09) Therefor to achieve an accurate simulation model actual weather data collected from the test buildings at the University of Auckland was used and referred to as “Actual Weather file”.
Figure 8 Temperature inside the cabin C2 (with PCM) for the period A
35
Sim / actual data
Actual data
RESULTS 30
Period A - from 14/01/2009 01:00 to 03/02/2009 23:55;
Period B - from 20/02/2009 15:35 to 04/03/2009 14:05;
Temperature [°C]
To validate the model, the simulation was carried out for three periods:
Sim / actual data
20
15
Period C - from 04/03/2009 15:30 to 20/03/2009 13:00. As stated above, the following simulations were run using specific weather files that incorporated the weather data collected on site.
35
25
Sim / historical data 10
Figure 9 Temperature inside the cabin C1 (no PCM) for the period B
Actual data
Sim / actual data
25
Actual data
30
20
Temperature [°C]
Temperature [°C]
30
15 Sim / historical data 10
25
20 Sim / historical data
Figure 7 Temperature inside the cabin C1 (no PCM) for the period A
15
Figure 10 Temperature inside the cabin C2 (with PCM) for the period B
- 59 -
Proceedings of Building Simulation 2011: 12th Conference of International Building Performance Simulation Association, Sydney, 14-16 November.
35
Sim / actual data
more rapidly and reaches a higher and unacceptable level of temperature since only sensible heat storage is available. When the indoor air temperature falls below the PCM transition temperature, the PCM begins to solidify in the gypsum, partially or completely, and the stored latent heat is released. However as indicated in Figures 13 and 14, the PCM has no effect when the night temperature does not drop sufficiently below the melting point of the PCM. The effect of PCM may be increased by using larger quantity of PCM. However, the amount of PCM that can be used is limited by the structural integrity of the gypsum board. In this research the limit was identified to be app. 28 to 30 wt%. Through the model developed in this research it will be possible to study such parameters in more detail.
Actual data
Temperature [°C]
30
25
20
15 Sim / historical data 10
Figure 11 Temperature inside the cabin C1 (no PCM) for the period C
35
Temperature [o C]
30
35 Actual Data Sim / actual data Temperature [°C]
30
25 20 15 10
Actual data (Cabin 1 no PCM)
5
25
Actual data (Cabin 2 with PCM)
0 0
50
100
150
200
250
300
Time [hr]
20
Figure 13 Temperature inside cabin 1 & 2 period B
Sim / historical data 15
40 35
Figure 12 Temperature inside the cabin C2 (with PCM) for the period C
Temperature [o C]
30
As stated earlier, this paper reports on recent research conducted on the use of phase change materials (PCM) in buildings for thermal comfort. The objective is to show experimentally and through a computer simulation that PCM impregnated in building materials can provide thermal energy storage benefits. More importantly it addresses previous limitations in simulation when historical data was used. As illustrated in Figures 13 and 14 for the period B and C, the building fitted with PCM gypsum board had much smaller temperature fluctuation compared to that of the building with no PCM. On hot days there was 4 degree temperature difference during day and night. In the PCM office, as the indoor air temperature rises passively, the PCM begins to melt by absorbing heat from the interior of the room. Thus, the PCM impregnated into gypsum board acts as a cooling storage medium. However, as indicated in Figures 13 and 14, the PCM free office rises much
25
20 15 10
Actual data (Cabin 1 no PCM)
5
Actual data (Cabin 2 with PCM)
0 0
50
100
150
200
250
300
350
Time [hr]
Figure 14 Temperature inside cabin 1 & 2 period C In theory the application of PCMs in larger scale buildings can significantly reduce the amount of energy that would be required to keep the internal temperatures at comfort limits. Hence the application of PCM in buildings could minimize the use of air-conditioning in summer while in winter, the use of PCM allows capturing solar radiation passively during the day for use at night hence reduce the heating load.
- 60 -
400
Proceedings of Building Simulation 2011: 12th Conference of International Building Performance Simulation Association, Sydney, 14-16 November.
As explained earlier, the objectives were to create a simulation model that that can be used accurately to predict the effects of PCM. As illustrated the simulation results – using the actual weather file (“Sim/act”) are in good agreement with the measurements. On the contrary, those simulations using the historical weather file (“Sim/hist”) are obviously not matching the actual data collected on the site. In particular, they are significantly below the actual data for both day and night periods. Therefore developing a model that best fits the physical data is necessary for future research. Note that the PCM introduces a tiny lag as it melts and solidifies. This lag can be seen in the various data set collected. For the period A shown in Figure 7 and 8, the simulation results Sim/act is a close match with the ones from actual data. Similar analysis was also observed for the periods B and C. Therefore, it can be assumed from the data generated that when using actual weather data the model is in good agreement with actual measured data. The circles on the different figures point out some days when the simulation results (Sim/act) are quite different from the actual data. An exhaustive comparison of the actual data and the actual weather data was done in order to determine the reason. Indeed, the only study of the weather conditions (only solar radiation, outside temperature and wind speed) of the different days in question did not ended up with a satisfactory explanation of the unusual evolution of the temperature inside the cabins C1 and C2. The low number of parameters taken into account in the simulation of the weather (wind speed, solar radiation and outside temperature) is sometimes not sufficient to reproduce the complexity of the interactions between buildings and meteorological elements. It has not yet been possible to identify the cause of these particularly low temperature values, and no modification has been carried out on the model so far. Infiltration may also have an effect and should be studied more extensively. This issue illustrates the high number of parameters influencing the variations of the inside temperature and the difficulty to study them.
The simulation using the actual weather file: µ(sim/act). The summary given in Table 3 points out that the mean value of the interior temperature based on simulation Sim/hist is very different (about 2.6 degrees) from the mean value of the actual data for the same period of time. On the contrary, the mean value of the interior temperature calculated from the simulation Sim/act is very close (about 0.3 degrees of difference) from the mean value of the actual data. This first comparison emphasizes the particularly good match between the simulation Sim/act and the actual data compared to the simulation Sim/hist. Table 3 Mean values of the temperature for period A Period A C1 (no PCM) C2 (With PCM) µ(actual data) = 24.4 µ(actual data) = 24.5 µ(sim/hist) = 21.6 µ(sim/hist) = 22.2 µ(sim/act) = 24.1 µ(sim/act) = 24.8 The analysis of period B and C present the same characteristics: difference of 2.5 degrees between the Sim/hist and the actual data compared to a difference of only 0.4 degrees between the Sim/act and the actual data. Table 4 Mean values of the temperature for period B Period B C1 (no PCM) C2 (With PCM) µ(actual data) = 23.9 µ(actual data) = 24.0 µ(sim/hist) = 20.6 µ(sim/hist) = 21.3 µ(sim/act) = 23.6 µ(sim/act) = 24.4 Table 5 Mean values of the temperature for period C Period C C1 (no PCM) C2 (With PCM) µ(actual data) = 22.8 µ(actual data) = 22.9 µ(sim/hist) = 19.8 µ(sim/hist) = 20.5 µ(sim/act) = 22.0 µ(sim/act) = 22.9
Statistical analysis of the results The following statistical analysis tends to confirm or validate the prevalence of the simulations of the cabin C1 or the cabin C2.
Mean values Firstly, only the mean value of the temperature over the period under consideration (A, B & C) is examined for
The actual data: µ(actual data),
The simulation using the weather file provided by the website of EnergyPlus (Sim/hist): µ(sim/hist),
Deviation from the actual measured values In order to develop a relevant analysis of the data, indicators have been developed. Through statistical methods the relevant difference between simulated and actual data were compared. Thus, Δbarre is defined as the average of the percentage of discrepancy.
- 61 -
Proceedings of Building Simulation 2011: 12th Conference of International Building Performance Simulation Association, Sydney, 14-16 November.
The main idea was to compare the simulation values (Sim(t)) to the actual values (Act(t)) and calculate the mean value of the percentage of deviation. 1. For each hour, we calculate the deviation |
CONCLUSIONS Thermal building simulations using EnergyPlus software was conducted to predict the thermal performance of office size test rooms located at the Tamaki Campus, University of Auckland, New Zealand. The long term measurements conducted for these test room showed a good agreement with the simulation results. Both the simulation and actual data collected has shown that the use of phase change material wallboards improves the thermal inertia of buildings. It showed that PCM– gypsum wallboard as internal wall linings is successful in capturing solar energy. The simulated results showed that the additional thermal mass of the PCM can reduce the daily indoor temperature fluctuation by up to 4 oC on a typical summer day. The ability of the PCM to remain at the comfort level without air-conditioning is very evident.
|
-
for the simulation using historical weather file, for the simulation using actual weather file. 2. For each simulation the average deviation ̅ was calculated for all the considered periods. The smaller ̅ the more accurate the simulation. - ̅ for the simulation using historical weather file, - ̅ for the simulation using actual weather file.
REFERENCES
Table 6 Average deviation of the simulations for period A
Behzadi, S. & Farid, M. M. Energy Efficient Buildings: How to determine the most suitable PCM and interior environment to maximize energy saving in buildings. In: Eurosun2010, 28th September to 1st October 2010 Graz, Austria. Farid, M. & Kong, W. J. 2001. Underfloor heating with latent heat storage. Proceedings of the Institution of Mechanical Engineers, Part A: Journal of Power and Energy, 215, 601-609. Farid, M. M., Khudhair, A. M., Razack, S. A. K. & Al-Hallaj, S. 2004. A review on phase change energy storage: Materials and applications. Energy Conversion and Management, 45, 1597-1615. Feldman, D., Banu, D. & Hawes, D. 1995. Low chain esters of stearic acid as phase change materials for thermal energy storage in buildings. Solar Energy Materials and Solar Cells, 36, 311-322. Feldman, D., Banu, D., Hawes, D., Athienitis, A. & Liu, C. Energy storage building materials with organic PCM's. In: Proceedings of the 28th Intersociety Energy Conversion Engineering Conference, August 8, 1993 August 13, 1993, 1993 Atlanta, GA, USA. Publ by SAE, 143-148. Feldman, D., Khan, M. A. & Banu, D. 1989. Energy storage composite with an organic PCM. Solar energy materials, 18, 333-341. Hasan, A. 1994a. Phase change material energy storage system employing palmitic acid. Solar energy, 52, 143-154.
Period A C1 (no PCM) ̅ ̅
C2 (with PCM) ̅ ̅
Table 7 Average deviation of the simulations for period B Period B C1 (no PCM) C2 (with PCM) ̅ ̅
̅ ̅
Table 8 Average deviation of the simulations for period C Period C C1 (no PCM) C2 (with PCM) ̅ ̅
̅ ̅
As expected the results indicate that the simulations using actual weather data (Sim/act) for both cabins were more accurate than the ones obtained from historical data. However, simulation is not error free and there are certain discrepancies as stated before that needs to be addressed so that model can be used for simulating larger more complex building structures.
- 62 -
Proceedings of Building Simulation 2011: 12th Conference of International Building Performance Simulation Association, Sydney, 14-16 November.
Hasan, A. 1994b. Thermal energy storage system with stearic acid as phase change material. Energy Conversion and Management, 35, 843-856. Hasan, A. & Sayigh, A. A. 1994. Some fatty acids as phase-change thermal energy storage materials. Renewable energy, 4, 69-76. Hawes, D. W., Banu, D. & Feldman, D. 1989. Latent heat storage in concrete. Solar energy materials, 19, 335-348. Hawes, D. W., Banu, D. & Feldman, D. 1990. Latent heat storage in concrete. II. Solar energy materials, 21, 61-80. Ibanez, M., Lazaro, A., Zalba, B. & Cabeza, L. F. 2005. An approach to the simulation of PCMs in building applications using TRNSYS. Applied Thermal Engineering, 25, 1796-1807. Khudhair, A. M. & Farid, M. M. 2004. A review on energy conservation in building applications with thermal storage by latent heat using phase change materials. Energy Conversion and Management, 45, 263-275. Khudhair, A. M. & Farid, M. M. Use of Phase Change Materials for Thermal Comfort and Electrical Energy Peak Load Shifting: Experimental Investigations. In: GOSWAMI, D. Y. & ZHAO, Y., eds. Solar World Congress 2007, 18-21 September 2007 2007 Beijing, China. Solar Energy and Human settlement. Khudhair, A. M., M.M.Farid, Chen, J. J. J. & Bansal, P. K. Thermal energy storage in buildings using PCM: Computer simulation. In: GOSWAMI, D. Y. & ZHAO, Y., eds. Solar World Congress 2007, 18-21 September 2007 2007 Beijing, China. Solar Energy and Human settlement. Kuznik, F. & Virgone, J. 2009. Experimental investigation of wallboard containing phase change material: Data for validation of numerical modeling. Energy and Buildings, 41, 561-570. Kuznik, F., Virgone, J. & Johannes, K. 2010. Development and validation of a new TRNSYS type for the simulation of external building walls containing PCM. Energy and Buildings, 42, 1004-1009. Mazman, M., Cabeza, L. F., Mehling, H., Paksoy, H. O. & Evliya, H. 2008. Heat transfer enhancement of fatty acids when used as PCMs in thermal energy storage. International Journal of Energy Research, 32, 135-143. Zalba, B., Marin, J. M., Cabeza, L. F. & Mehling, H. 2004. Free-cooling of buildings with phase change materials. International Journal of Refrigeration, 27, 839-849.
- 63 -