neutron rich end of each decay chain, with the population of the more stable isotopes in the ... It would be expected that these nuclei will be observed in fission product γ-ray ... emitters, although a few higher mass isotopes decay by α-emission. .... These detectors recorded spectra using two different spectrometry systems.
Department of the Environment, Transport and the Regions Commissioned research for Radioactive Substances Division
Experimental Measurements and Computer Simulation of Fission Product Gamma-ray Spectra.
Report No: DETR/RAS/97.002
Contract Title: Characterisation of the response of airborne systems to short-lived fission products. DETR Reference: RW 8/6/72
Sector: C, D
Authors: D.C.W. Sanderson, A.J. Cresswell, J.D. Allyson, P. McConville Scottish Universities Research and Reactor Centre, East Kilbride, G75 0QF Date approved by DETR: September 1997
Abstract: Airborne gamma ray spectrometry using high volume scintillation detectors, optionally in conjunction with Ge detectors, has potential for making rapid environmental measurements in response to nuclear accidents. An experimental investigation and computer simulation have been used to characterise the response of such detectors to short lived fission products. Small samples of 235U were irradiated in a research reactor for short periods, to generate fission product sources. Gamma ray spectra were recorded over a period of one year using both high volume scintillation detectors and semiconductor detectors. The main gamma emitting nuclides have been identified, and their associated signals in each detector defined. Simulation work has been used to calculate the corresponding spectra which would have been observed at airborne survey heights, or from fission product sources irradiated for a prolonged period. While Ge detectors can record a fuller range of isotopes, of interest in characterising release terms, the NaI spectra also have potential for providing data on a range of radiologically important isotopes at all stages. The results of this work will be used in the formulation of Government policy, but views expressed in this report do not necessarily represent Government policy.
SUMMARY Airborne Gamma Spectrometry (AGS) has developed considerably in recent years, and is recognised as having an important contribution to make to nuclear emergency response. The abilities to survey large areas rapidly with high sampling densities, and to produce radiometric maps on emergency timescales have already been demonstrated. However the ability of AGS systems to resolve complex gamma spectra in the early phases of a reactor accident is less well defined. An earlier report (Sanderson et. al. 1997) reviewed experience from past nuclear accidents, together with source terms and AGS spectra recorded. This report presents results of an experimental and computational investigation of the response of AGS systems to short lived fission products. An experiment was conducted in which small, sealed samples of 235U were irradiated in the UTR300 research reactor in East Kilbride, producing unseparated fission product sources. Gamma ray spectra were recorded, under laboratory conditions from these sources over a one year period using a high volume (16l) sodium iodide (NaI) spectrometer and two types of Germanium (Ge) detectors. The Ge spectra, together with a numerical simulation of the fission process, were used to identify the main gamma emitting isotopes present at each stage, and their contributions to the NaI spectra recorded. Some 42 isotopes were identified in the initial Ge spectra, but this reduced to 20 after one week, and 7 after six months. The spectra recorded using the NaI detectors contain several composite peaks, which although unable to resolve the full set of nuclides, could provide information on radiologically important isotopes at all stages. The extent of interferences in the NaI spectra, and the need for spectral stripping were examined. Under accident conditions, where volatile and non-volatile species are expected to be separated from each other to a greater extent than revealed in this experiment, the extent of spectral interferences would be reduced. From the data it has been noted that NaI spectra could provide information on the following groups of isotopes. Sr isotopes might be inferred over the first day following accident using 91Sr and 92Sr, providing the release and AGS mobilisation take place rapidly after irradiation. Iodine nuclides would be measurable over the first few weeks, initially using 134I (first day only), 133I and 135I (first 2 days); thereafter 132I/132Te (first week or so), and 131I (first 2-3 weeks). The extent to which Cs isotopes can be quantified during the early stages depends on the fuel age of the reactor, and on the extent of separation of volatile and non-volatile products during the release phase. Finally non-volatile products such as 95 Zr/95Nb, 99Mo, 140La, would be detectable for significant periods following release, again their relative contributions depending on the accident scenario. A computer model was developed to simulate the fission product inventories and resulting NaI spectra for these experiments, in both close-coupled and airborne observational geometries. The agreement between simulation and experiment was good. These models were also used to investigate the influence of prolonged irradiation on gamma spectra. As expected this modified the predicted results. These models could be used to simulate the response of AGS systems to past accidents and reference accidents for current reactors. The experiment has confirmed that AGS systems could provide useful information under accident conditions, given a suitable combination of detectors, and appropriate spectral analysis.
i
ACKNOWLEDGEMENTS
The work described here is part of a project supported by the Department of the Environment, Transport and the Regions (project DOE RW 8/6/72) and the Ministry of Agriculture, Fisheries and Food (project MAFF RP0237). The samples of 235U used in the experiment were supplied by AEA Technology (ref. no. AE 7159).
ii
CONTENTS 1. INTRODUCTION
1
1.1 Aims 1.2 Fission product gamma-rays
1 1
2. EXPERIMENTAL MEASUREMENTS
6
2.1 Overview 2.2 Source Preparation 2.3 Experimental Arrangement 2.4 Measurements Taken 2.5 Spectral Analysis 2.6 Fission Product Spectra 2.7 Decay Characteristics 2.8 Source Composition
6 6 7 9 9 10 30 37
3. SOURCE TERM AND γ-RAY SPECTRUM SIMULATION
39
3.1 Nuclear Fission 3.2 Simulation Code Development 3.3 Verification of Code 3.4 Simulation of Airborne Geometry 3.5 Simulation of Long Irradiation Periods
39 40 43 46 46
4. DISCUSSION
50
5. CONCLUSION
55
6. REFERENCES
56
APPENDIX A. Details of Measurements Taken APPENDIX B. Detector Gain Drift Measurements and Correction Technique
58
iii
60
1. INTRODUCTION 1.1 Aims This report sets out the findings of an experimental and computational investigation into the response of airborne gamma-ray spectrometry (AGS) systems to the accidental release of fission products, with particular reference to shorter lived radioisotopes. A review of past nuclear accidents has been reported (Sanderson et. al. 1997), detailing source terms for those accidents with major off-site releases and summarising general features of γ-ray spectra observed after these accidents. The influences of the timing of the release, relative to reactor operation, and of segregation of volatile and non-volatile radionuclides during and after release, in determining the isotopic composition of deposited radioactivity were noted. Delays in employing AGS surveys and the types of systems used have limited the extent to which the practical experience gained in response to past accidents reflects the full range of potential behaviour. The experimental and computational simulations reported here aim to complement existing experience and to provide a systematic basis for evaluating the contribution AGS can make to emergency response. The experimental investigation used small 235U sources irradiated and measured under laboratory conditions, sealed within a silica ampoule to retain the full suite of fission products, and representing close coupled source to detector geometries. This has provided a set of γ-ray spectra recorded using AGS detector systems, including both high volume scintillation and high resolution semi-conductor detectors, from fission product sources over a one year period. Computational models, consisting of source term simulations coupled to Monte Carlo calculations for detector response, have been developed to simulate the experimental results. Comparison between the experimental and simulated spectra has been used to verify the code, and assist in the identification of features in the experimental spectra. The simulation has then been applied to investigate the relationship between measured laboratory spectra and full scale airborne geometry, and the effect of prolonged irradiation on γ-ray spectra. The combination of spectra measured following past nuclear accidents, the experimental and simulated data sets, has been used to assess the extent to which high volume sodium iodide (NaI) detectors can deal with complex fission product spectra. These data sources are also useful for the development of strategies for data analysis appropriate to use in the early stages of emergency response, and for evaluating features which should be taken into account in the design of new AGS systems (eg: the need for Ge detectors). 1.2 Fission product gamma-rays Nuclear fission results in the production of several hundred nuclides, most of which are unstable to beta-decay and result in isobaric decay chains. Typically, fission directly populates the more neutron rich end of each decay chain, with the population of the more stable isotopes in the chain resulting from β-decay. The cumulative fission yield (the sum of the independent yields as a result of direct fission population and the decay of parents) is greater than 0.1% for 125 isotopes with half lives longer than one hour, 45 of which are stable. The higher yield isotopes will be more abundant in an undifferentiated nuclear fission source.
1
The isotopes expected to contribute to γ-ray spectra of fission sources can be predicted from nuclear data. Only fairly long lived nuclides would be expected to contribute to the source, except for periods very shortly after fission. So only isotopes with half lives in excess of one hour are considered here, with a few exceptions where the isotope is a decay product of a longer lived parent. The activity, A, in units of Bq per fission, due to a particular isotope is given by A = λ Yf
(1.1)
where Yf is the cumulative fission yield and λ=ln2/t½ is the decay constant, where t½ is the half life in seconds. For daughter isotopes with half-lives less than their parents the half-life of the parent isotope was used. This represents the activity at time zero (ie: immediately following fission) and assumes all the parent nuclei decay instantaneously. It also assumes that none of the isotopes have had a chance to reach equilibrium. As such, this approximates to the activities for real fission sources such as irradiated nuclear fuel. The number of γ-rays per second per fission, Aγ is given by Aγ = A Iγ
(1.2)
where Iγ is the γ-ray yield. The γ-activity will decrease with time following the radioactive decay law, with only the most intense γ-rays at any time contributing significantly to the γ-spectrum. Table 1.1 lists the most intense γ-emitting fission products sorted in half-life order with their principal γ-rays. It would be expected that these nuclei will be observed in fission product γ-ray spectra measured over various times since fission, with the more intense short-lived products decaying out of the source to allow the less intense longer-lived products to dominate at later stages. In generating this table a minimum threshold for the activity Aγ was used to eliminate low intensity nuclei, this threshold was set at 10-7 for isotopes with half-lives of the order of a few hours, and decreased with increasing half-life to 10-10 for isotopes with half-lives in excess of a year. In addition to these γ-emitting isotopes, which under favourable circumstances may be detectable by AGS or other γ-ray spectrometry methods, there are also a number of fission products which either do not emit γ-rays or only emit very weak or low energy γ-rays. Most of these are βemitters, although a few higher mass isotopes decay by α-emission. Table 1.2 lists some of the longer lived high yield nuclides with their half lives, cumulative fission yields, activities and βdecay Q-values (the maximum energy available to the β-particle). These isotopes are likely to persist in the environment and contribute significantly to radiation dose, some (particularly the Sr isotopes) are of particular concern because of their potential biological importance.
2
Nuclide
87
Kr
Cumulative yield (%)
Activity, A (10-6 Bq/fission)
Principal gamma-rays Energy (keV)
Aγ (10-6 γ/fission/s)
1.27h
2.5
3.8
402.58
1.9
1.38h
6.5
9.1
165.86
2.2
La
1.52h
5.8
7.3
641.29 2397.8 2542.7
3.5 0.98 0.73
Nd
1.73h
1.0
1.1
114.31 211.31 270.17
0.21 0.29 0.12
2.71h
6.0
4.3
1383.9
3.8 0.62 0.31 0.26 0.31 0.82
139
Ba
142
149
92
Sr
Kr
2.84h
3.5
2.4
196.32 834.83 1529.77 2195.84 2392.11
Rb
17.8m
3.5
2.4
898.0 1836
0.34 0.51
Y
3.54h
6.0
3.3
934.5
0.45
La
3.93h
5.9
2.9
1354.52
0.075
0.39
544.7 812.8 914.6 1030.1
0.070 0.17 0.078 0.049 0.046 0.073 0.065 0.20
88
88
Half life
92
141
129
Sb
4.40h
0.72
4.44h
0.96
0.42
316.44 469.37 676.36 724.3
4.48h
1.3
0.56
151.18 304.87
0.42 0.078
I
6.61h
6.3
1.8
1131.5 1260.4
0.42 0.53
Xe
9.09h
6.6
1.4
249.79
1.3
Sr
9.52h
5.9
1.2
749.8 1024.3
0.28 0.40
91m
Y
49.71m
2.9
0.59
555.6
0.57
93
Y
10.10h
6.3
1.2
266.87
0.082
97
Zr
16.90h
6.0
0.68
507.66 1147.99
0.036 0.018
97
Nb
1.20h
6.0
0.68
657.92
0.67
105
Ru
85m
Kr
135
135
91
3
Comments
88
Kr daughter
91
Sr daughter
97
Zr daughter
97m
Nb
1.00m
5.7
0.65
743.36
0.64
I
20.80h
6.6
0.61
529.87
0.53
Pm
1.18d
0.42
0.029
340.1
0.0065
Ce
1.38d
5.9
0.34
57.37 293.26
0.040 0.14
Rh
1.47d
0.96
0.052
318.9
0.010
Mo
2.75d
6.2
0.18
739.5
0.022
99m
Tc
6.02h
5.4
0.16
140.47
0.14
132
Te
3.26d
4.2
0.10
228.16
0.091 0.017 0.014 0.10 0.081 0.019
133
151
143
105
99
I
2.30h
4.3
0.11
522.65 630.22 667.67 772.6 954.55
Xe
5.25d
6.6
0.10
81
0.037
I
8.04d
2.9
0.029
364.48
0.023
Nd
10.98d
2.3
0.017
91.11 531.02
0.0047 0.0022
12.74d
6.3
0.040
537.27
0.0097 0.0082 0.018 0.0094 0.038
132
133
131
147
140
Ba
La
1.68d
6.3
0.040
328.77 487.03 815.78 1596.17
Ce
32.50d
5.9
0.015
145.44
0.0070
Ru
39.35d
3.0
0.0061
497.08
0.0054
95
Zr
63.98d
6.6
0.0083
724.23 756.74
0.0037 0.0045
95
Nb
35.15d
6.6
0.0083
765.83
0.0083
Ce
184.90d
5.5
0.0024
133.52
0.00026
106
Ru
1.007y
4.1
0.00089
106
Rh
29.8s
4.1
0.00089
511.86
0.00019
30.00y
6.2
0.000045
661.65
0.000039
140
141
103
144
137
Cs
97
Zr daughter
99
Mo daughter
132
Te daughter
140
Ba daughter
95
Zr daughter
106
Ru daughter
137m
Ba γ-ray
Table 1.1: The cumulative yields, activities and principal γ-rays for the most γ-intense fission products, sorted in half-life order. It would be expected that these isotopes would be detectable by AGS or other γ-ray spectrometry methods in a nuclear fission source.
4
Nuclide
Half life
Cumulative yield (%)
A (10-6 Bq/fission)
β Q-value (MeV)
Comments
89
Sr
50.5d
4.8
0.0076
1.492
no γ
90
Sr
29.12y
5.8
0.000044
0.546
no γ
90
Y
2.67d
5.8
0.000044
2.284
very weak γ
91
Y
58.51d
5.9
0.0081
1.543
very weak γ
143
Pr
13.58d
5.9
0.035
0.935
very weak γ
145
Pr
5.98h
3.9
1.3
1.805
very weak γ
147
Pm
2.62y
2.2
0.00018
0.225
very weak γ
149
Pm
2.21d
1.0
0.036
1.072
very weak γ
Table 1.2: The half-life, cumulative yield, activity and β-decay Q-value for some high yield, longer lived fission products not detectable by γ-ray spectrometry.
5
2. EXPERIMENTAL MEASUREMENTS 2.1 Overview The experiment consisted of a fission product source and three γ-ray detectors; the 16 litre NaI detector from the AGS system, a 50% efficiency Ge detector (GMX) and a thin crystal Ge (LoAx) detector. These detectors recorded spectra using two different spectrometry systems. The spectra recorded by the GMX and NaI detectors were recorded using the AGS rack. The GMX spectra were also recorded using an Ortec 919 buffer along with the LoAx spectra. The source consisted of one or more samples of 235 U that had been irradiated in the SURRC UTR 300 research reactor. Five samples were prepared, each of which was irradiated for different periods. The source was placed on a plinth, with the sample(s) and source-detector distance selected so as maximize counting statistics without producing excessive dead time in the NaI detector system. Spectra were recorded at various times over a one year period after the sources were irradiated. In excess of 20 000 spectra were recorded using the three detector systems. Peaks in representative Ge spectra were identified from their energies using γ-ray energy and intensity information from the JEF 2.2 database (OECD 1994), the compositions of peaks in the corresponding NaI spectra were then determined using these identifications. These assignments were confirmed by measuring the decay of these peaks through the entire NaI data set. From this information the major contributions to the NaI γ-ray spectra at various stages during the decay were determined. 2.2 Source Preparation A solution of 5.06±0.03 cm3 of 235U tracer in 6.66±0.03 g of 8M HNO3 was obtained from AEA Technology (Reference No. AE 7159, type 92/235/88). The U concentration in this solution was specified as 317.3±1.6 µg U per gram of solution, with the measured isotopic composition being 0.836±0.008% 234U, 92.49±0.02% 235U, 0.334±0.003% 236U, and 6.338±0.006% 238U. Therefore, the concentration of 235U in the solution was 293.5±1.6 µg/g. Five portions of this solution were dispensed into 8mm external diameter silica tubes with a target volume of 0.77569 cm3, equivalent to 1.022g of solution or 300 µg of 235U. The contents of the tubes were evaporated to dryness and then the tubes flame sealed. During the process some loss of nitric acid solution may have occurred, and therefore the 300 µg 235U content of each sample is an upper limit. At the same time, four empty tubes were prepared and sealed, one of which was subjected to prolonged heating to verify it's containment integrity. The samples were irradiated on 11th September 1995 in the SURRC UTR 300 research reactor, at a nominal neutron flux of 2.3×10¹² n s-1. For 300 µg of 235U this would result in an estimated 1.0×10⁹ fissions per second. Along with the samples, each irradiation also contained a blank sample, to enable activation products from the tubes to be discounted from the measured spectra, and two gold foil flux monitors held in small eppendorf capsules placed over each end of the tube. The samples and flux monitors were double contained in zipseal polythene bags. Table 2.1 gives
6
Source
Mass before drying (g)
Time in reactor (s)
A
1.052
40
B
1.032
400
C
1.072
5620
D
1.076
5620
E
1.021
5620
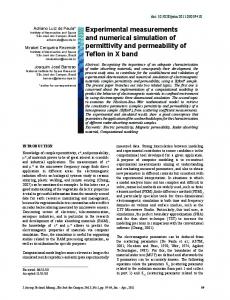
Table 2.1: The mass (before drying) and irradiation time for each of the five samples. the mass of solution prior to drying and the irradiation time for each of the five samples. The fission sources thus produced are not entirely representative of nuclear accident source terms. The sources produced experimentally were sealed, and so there is no physical or chemical separation of the isotopes present. In particular they contain inert gases, which although released in an accident are not deposited, and relatively large amounts of refractory elements which would be less preferentially released in an accident situation. They also contain no activation products from fuel cladding and reactor components. In addition, the sources were irradiated for relatively short times compared to the irradiation times for most accident scenarios. Thus the shorter lived isotopes will have had less time to reach equilibrium, and so be relatively abundant compared with the longer lived isotopes, and the production of higher actinides, which have slightly different fission product yields, would have been small. 2.3 Experimental Arrangement The 16 litre NaI detector was placed on top of a bench 92cm above the floor, with the crystal ends approximately 17cm laterally displaced from the source which was placed 67cm down the laboratory floor pit (a source-NaI distance of 164cm). The GMX detector was placed on the floor, with its centre line approximately 80cm below the NaI detector, overhanging the pit. For the first set of measurements only these two detectors were used, with spectra being logged by the AGS computer rack. For the rest of the experiment, spectra were also recorded from the LoAx and GMX detectors through an Ortec 919 buffer. These two detectors were placed on the floor, and the NaI detector was moved so that the centre of the detector was directly above the source. For most of the remaining measurements the source was placed on a polystyrene plinth either 60 or 68cm below the NaI detector, with the lateral displacement of the Ge detectors from the vertical axis of the source being 20cm for the LoAx detector and 30cm for the GMX. This arrangement is shown schematically in figure 2.1. As the sources decayed combinations of sources were used to increase counting statistics. For a few sets of measurements, the source was again placed in the floor pit, and the Ge detectors moved to overhang it.
7
Figure 2.1: Schematic of the detector arrangement (not to scale) with the most used source position and the lowest source position marked. With the source placed in the floor pit the Ge detectors were positioned overhanging the pit. For the initial run, the LoAx detector was not used and the NaI detector was offset with the ends of the crystals 17cm from the vertical axis of the source.
Spectra from the NaI and GMX detectors were logged using the AGS computer rack. This consists of instrumentation power supply, EHT power supply for the detectors, spectroscopic amplifiers and a pulse height analyser connected to a PC running data acquisition software developed for the collection and integration, using pre-defined spectral windows, of γ-ray spectra using the NaI detector, with the option of using additional Ge detectors. This software stores the NaI spectra in 512 channels at approximately 6 keV per channel and the Ge spectra in 2048 channels at approximately 1.5 keV per channel. Lower thresholds were set to limit dead-time in the spectrometers due to x-rays and lower energy scattered photons. For most of the measurements both detectors recorded γ-rays in the range of ≈20-3000 keV, although for some of the later measurements the NaI detector threshold was set higher. The spectra from the LoAx and GMX detectors were logged from an Ortec 919 "Spectrum Master" using the Ortec Maestro software. The signals from the detector pre-amplifiers were
8
processed by spectroscopic amplifiers before being fed into the 919 buffer. They were logged as 8k spectra at approximately 0.4 keV per channel for the GMX and as 2k spectra at approximately 0.5 keV per channel for the LoAx detector. The LoAx spectra were recorded in the range ≈151000 keV, and the GMX spectra in the range ≈30-3000 keV. 2.4 Measurements Taken Over the course of a year spectra were recorded from the sources using these detectors. Details of each of these sets of measurements are given in Appendix A. In total the AGS system recorded 7350 GMX and 14700 NaI spectra, of which approximately 80% were recorded with a fission source in place, the remainder being background or calibration spectra. The Ortec 919 buffer recorded 750 GMX and LoAx spectra. 2.5. Spectral Analysis The high resolution spectra recorded using the LoAx and GMX detectors were studied first. It was possible to determine the energies of the peaks in these spectra to high accuracy, and from comparisons with nuclear data tables of γ-ray energies assign most of them to particular radioisotopes. The peaks in the Ge spectra were then used to identify the components of peaks in the NaI spectra. The composition of these peaks was then confirmed by studying the decay of these peaks over time, and hence determining half-lives of the contributing components. For both sets of data some pre-processing was required to account for gain shift, and to subtract the laboratory background. This has resulted in the development of several simple data processing routines for use with spectra recorded with the AGS system. It was noted that the gain of the NaI detector drifted considerably during the various sets of measurements, following diurnal and weekly cycles with gain maxima at night and over weekends. A gain correction routine, based on the DRIFT routine of Paatero 1964, was used to shift and stretch the spectra to 6 keV per channel using the 40K (1460.8 keV) and 208Tl (2614.53 keV) peaks as references. Details of this are given in Appendix B. Background spectra, either of the laboratory background alone or of the blank silica tubes, were recorded at stages throughout the year measurements were taken. The spectra recorded with the blank tubes were compared to those of the laboratory background alone. There was no discernable difference between the two background data sets, ie: the contribution of any activation products in the tubes to the γ-ray spectra was insignificant. The background spectra recorded over the year were studied to check detector characteristics and any variation in the laboratory background. The resolution of the detectors logged by the AGS rack and the LoAx detector was fairly constant over the duration of the experiment, however the resolution of the GMX detector logged by the 919 buffer was more variable. For the LoAx detector the FWHM of the 214Pb (351.9 keV) peak was typically 0.9 keV. For the NaI and GMX detectors logged through the AGS rack the FWHMs of the 40K (1460.8 keV) peak were typically 100 keV and 3.3 keV respectively. The FWHM of the 40K peak for the GMX detector logged through the 919 buffer varied between 2.5 keV and 9.3 keV.
9
The variability of the laboratory background was also studied using the GMX spectra recorded through the 919 buffer. It was found that the count rates due to the U-series, the Th-series and 40 K were constant during the course of the experiment. However, the count rate due to 137Cs was variable, usually at about 0.4 cps, but sometimes falling to 0.1 cps and on one occasion rising to 0.9 cps. This was probably due to the use of sources in an adjacent laboratory, or other activities in the laboratory. Study of spectra recorded before, during and after the worst affected spectra indicated that this variability had little effect on the measured fission product spectra. Any possible variation in the background due to changes in radon concentration was also checked, by taking the ratios of count rates for peaks from isotopes above and below radon in the decay chains. These ratios were constant, indicating that the radon concentration did not vary sufficiently to affect the laboratory background. The laboratory background recorded closest in time to the fission spectra was subtracted from the measured spectra, to leave residual spectra due solely to fission products. Several of these residual spectra were combined to improve statistics. 2.6 Fission Product Spectra Fission product spectra for representative times after irradiation were prepared as described above. The energies of the peaks in the Ge spectra were determined, and the γ-rays contributing to the spectra identified by comparison with nuclear data (OECD 1994). The radioisotopes contributing to the NaI peaks were determined by comparison with the concurrently recorded Ge spectra. Spectra recorded 3 hours after irradiation The spectra recorded with the GMX and NaI detectors are shown in figure 2.1, the LoAx detector was not used at this time. Gamma-rays from 40 different isotopes were identified in these spectra, with 9 major peaks in the NaI spectrum. Of these, the most prominent is the 864keV peak, composed predominantly of 134I γ-rays. Other NaI peaks of interest include the 1380keV peak which is largely 92Sr and the 1494keV which is almost totally due to 135I and 88Kr. Table 2.1 lists the principal γ-rays observed with the GMX detector, and table 2.2 lists the major peaks in the NaI spectrum with the approximate contributions of different radionuclides. Spectra recorded 1 day after irradiation The spectra recorded with the three detector systems are shown in figure 2.2. Gamma-rays from 28 different isotopes were identified in these spectra, with 9 major peaks in the NaI spectrum. Of these, the most prominent is the 516keV peak, which is composed mostly of 133I γ-rays with a significant contribution from 91mY. Other NaI peaks of interest include the 222keV peak which is composed mostly of 135Xe γ-rays, the 1266keV and 1446keV peaks which are composed mostly of iodine γ-rays and the 1014keV peak which is composed mostly of 91Sr γ-rays. The 342keV peak is due largely to 131I, however it is a fairly small peak that is not fully resolved at this time. Table 2.3 lists the principal γ-rays observed with the Ge detectors, and table 2.4 lists the major peaks in the NaI spectrum with the approximate contributions of different radionuclides.
10
Spectra recorded 2 days after irradiation The spectra recorded with the three detector systems are shown in figure 2.3. Gamma-rays from 26 different isotopes were identified in these spectra, with 8 major peaks in the NaI spectrum. Peaks of interest in the NaI spectrum include the 210keV peak composed mostly of 132Te and 135 Xe γ-rays, the 510keV peak composed largely of 133I γ-rays and the 1590keV peak which is predominantly due to 140La γ-rays. Table 2.5 lists the principal γ-rays observed with the Ge detectors, and table 2.6 lists the major peaks in the NaI spectrum with the approximate contributions of different radionuclides. Spectra recorded 1 week after irradiation The spectra recorded with the three detector systems are shown in figure 2.4. Gamma-rays from 20 different isotopes were identified in these spectra, with 9 major peaks in the NaI spectrum. Of these, the most prominent is the 1596keV peak due to 140La γ-rays, this isotope and its longer lived Ba parent also contribute γ-rays to several other peaks. Other NaI peaks composed largely of γ-rays from one radioisotope are the 666keV and 1392keV peaks due to 132I, the 228keV peak due to 132Te, and the 366keV peak due to 131I. Other peaks include the 942keV peak which is composed of 132I and 140La γ-rays and the 144keV peak which is composed largely of 99mTc γ-rays with a 141Ce component. Table 2.7 lists the principal γ-rays observed with the Ge detectors, and table 2.8 lists the major peaks in the NaI spectrum with the approximate contributions of different radionuclides. Spectra recorded 2 weeks after irradiation The spectra recorded with the three detector systems are shown in figure 2.5. Gamma-rays from 19 different isotopes were identified in these spectra, with 9 major peaks in the NaI spectrum. Of these, the most prominent is still the 1596keV peak due to 140La. Other NaI peaks composed largely of γ-rays from one radioisotope are the 228keV peak due to 132Te, and the 684keV and 1128keV peaks due to 132I. In addition to these, the 348keV peak is due largely to 131I and 140La, the 498keV peak is due largely to 103Ru and 140Ba-La, the 762keV peak is due largely to 95Zr-Nb and 140La and the peak at 936keV is largely due to 132I and 140La. It is possible to strip out the components due to 140La-Ba from these peaks using the 1596keV peak. Table 2.9 lists the principal γ-rays observed with the Ge detectors, and table 2.10 lists the major peaks in the NaI spectrum with the approximate contributions of different radionuclides. Spectra recorded 1 month after irradiation The spectra recorded with the three detector systems are shown in figure 2.6. Gamma-rays from 18 different isotopes were identified in these spectra, including 137Cs which is resolved in the Ge detectors for the first time at this stage, and there are only 6 major peaks in the NaI spectrum. Of these, the most prominent is still the 1596keV peak due to 140La, as is 930keV peak. Other NaI peaks include the 138keV peak due largely to 144Ce and 147Nd, the 336keV peak due to 131I and 140 Ba-La, the 462keV peak due largely to 103Ru and 140Ba-La, and the 756keV peak is due largely to 95Zr-Nb and 140La. Again, it is possible to strip out the components due to 140La-Ba form these peaks using the 1596keV peak. Table 2.11 lists the principal γ-rays observed with the Ge detectors, and table 2.12 lists the major peaks in the NaI spectrum with the approximate
11
contributions of different radionuclides. Spectra recorded 2 months after irradiation The spectra recorded using the three detector systems are shown in figure 2.7. Gamma-rays from 15 different isotopes were identified in these spectra, with 5 major peaks in the NaI spectrum. Of these, the most prominent is still the 1596keV peak due to 140La. The other prominent peaks in the NaI spectrum are the 498keV peak due to 103Ru and 140Ba-La, and the 756 keV peak due largely to 95Zr-Nb. Table 2.14 lists the principal γ-rays observed with the Ge detectors, and table 2.15 lists the major peaks in the NaI spectrum with the approximate contributions of different radionuclides. Spectra recorded 6 months after irradiation The spectra recorded using the three detector systems are shown in figure 2.8. The lower threshold on the NaI detector had been increased during a survey to reduce dead-time due to lower energy scattered γ-rays, and had not been reduced afterwards resulting in the sharp cut-off in the NaI spectrum at about 200keV. Gamma-rays from only 7 different isotopes were identified in these spectra, with just 2 major peaks in the NaI spectrum. The 498keV peak is composed of 103 Ru γ-rays, and the 750keV peak is due to 95Zr-Nb γ-rays. A shoulder on the low energy side of the 750keV peak is from 137Cs γ-rays, although this is not fully resolved it is possible to measure 137Cs deposition using this shoulder. Table 2.15 lists the principal γ-rays observed with the Ge detectors, and table 2.16 lists the major peaks in the NaI spectrum with the approximate contributions of different radionuclides. Spectra recorded 11 months after irradiation The last set of spectra recorded using the three detector systems are shown in figure 2.9. Gammarays from only 5 different isotopes were identified in these spectra. The only major peak is the 750keV peak due to 95Zr-Nb γ-rays, with the 137Cs shoulder. Table 2.17 lists the principal γ-rays observed with the Ge detectors, and table 2.18 lists the only major peak in the NaI spectrum with the approximate contributions of different radionuclides.
12
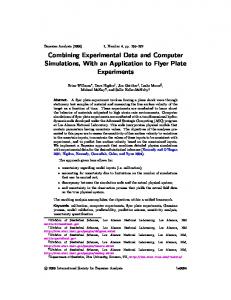
Figure 2.1: Background subtracted spectra produced by the summation of spectra recorded with the NaI and GMX detector systems 3 hours after irradiation. The total livetime for the NaI detector was 1200s, and for the GMX detector 2000s. Approximate energies for some of the peaks are shown, with energies of the principal γ-rays observed in the GMX spectrum given in table 2.1, and the compositions of the peaks in the NaI spectrum given in table 2.2.
13
γ-ray energy (keV) 196.3
Nuclide 88
Kr
210.5
134
249.8
135
402.6
87
405.5
Te
Xe
Kr
134
435.1
134
462.8
138
I
Te Cs
Half life 2.84h
γ-ray energy (keV) 847.0
Nuclide
Half life
134
I
52.60m
884.1
134
41.83m
I
52.60m
912.7,914.8
133m
Te
55.40m
1.27h
1009.8
138
Cs
32.20m
52.60m
1024.3
91
Sr
9.52h
1038.8
135
I
20.80h
1040.3
134
I
52.60m
1072.6
134
I
52.60m
1131.5
135
I
6.61h
1260.4
135
I
6.61h
(16.90h)
1383.9
92
Sr
2.71h
41.83m
1435.9
138
9.09h
41.83m 32.20m
529.9
133
555.6
91m
641.3
142
657.9
97
742.6
134
743.4
97m
Nb
(16.90h)
1806.8
765.8
95
Nb
(63.98d)
1836
88
767.2
134
1901.3
142
1.52h
2397.8
142
1.52h
I
Y
La
Nb Te
Te
20.80h (9.52h) 1.52h
41.83m
Cs
134
32.20m
I
52.60m
Rb
17.80m
La La
Table 2.1: Principal γ-rays observed in the GMX spectrum recorded 3 hours after irradiation. Peak Energy (keV)
Composition
240
88
Kr 30%, 135Xe 20%, 134Te 15%
432
134
I 30%, 134Te 25%,
528
133
91m
642
142
864
134
1380
92
1494
135
1830
88
2400
88
I 30%,
La 40%,
Y 25%,
87
Kr 25%
134
I 20%, 138Cs 10%
134
I 30%, 97Nb 15%
I 80%, 133mTe 10%
Sr 75%, 138Cs 25% I 40%, 88Kr 35%
Rb 45%, 134I 30%, 135I 20% Kr 55%, 142La 45%
Table 2.2: The approximate contributions of radioisotopes to the major net peaks in the NaI spectrum recorded 3 hours after irradiation, determined from the spectrum recorded at the same time using the GMX detector.
14
Figure 2.2: Background subtracted spectra produced by the summation of spectra recorded with the three detector systems 1 day after irradiation. The total livetimes for all three detectors were 6000s. Approximate energies for some of the peaks are shown, with energies of the principal γ-rays observed in the Ge spectra given in table 2.3, and the composition of the peaks in the NaI spectrum given in table 2.4.
15
γ-ray energy (keV) 81 140.5
Nuclide 133
Xe
99m
99
Tc, Mo
Half life 5.25d
γ-ray energy (keV) 836.8
Nuclide
Half life
135
I
6.61h
875.3
133
I
20.80h
132
I
(3.26d)
Sr
9.52h
(2.75d)
228.2
132
Te
3.26d
954.6
249.8
135
Xe
9.09h
1024.3
91
293.3
143
1038.8
135
1125.5
131m
1131.5
135
I
6.61h
1260.4
135
I
6.61h
1457.6
135
I
6.61h
La
(12.74d)
Ce
364.5
131
529.9
133
555.6
91m
657.9
97
667.7 743.4 772.6 815.8
I I
Y
Nb
132
8.04d 20.80h (9.52h) (16.90h)
I
6.61h
Te
1.25d
140
I
(3.26d)
1596.2
Nb
(16.90h)
1706.5
135
I
6.61h
I
6.61h
Y
10.10h
97m
132 140
1.38d
I
(3.26d)
1791.2
135
La
(12.74d)
1917.8
93
Table 2.3: Principal γ-rays observed in the spectra recorded using the Ge detectors 1 day after irradiation.
Peak Energy (keV)
Composition
222
135
342
131
I 45%,
516
133
I 60%, 91mY 25%, 97Zr 5%
648
97
744
97m
Xe 75%,
132
143
Te 20%
Ce 20%, 105Rh 12%
Nb 65%, 132I 20%, 91Sr 5% Nb 55%, 132I 15%, 91Sr 10%
1014
91
Sr 85%, 135I 13%
1116
135
I 60%, 131mTe 20%, 97Zr 10%
1266
135
I 70%, 133I 25%
1446
135
I 70%, 91Sr 15%
Table 2.4: The approximate contributions of radioisotopes to the major peaks in the NaI spectrum recorded 1 day after irradiation, determined from the spectra recorded at the same time using the Ge detectors.
16
Figure 2.3: Background subtracted spectra produced by the summation of spectra recorded with the three detector systems 2 days after irradiation. The total livetime for the NaI detector was 6000s, 3000s for the GMX detector and 1000s for the LoAx. Approximate energies for some of the peaks are shown, with energies of the principal γ-rays observed in the Ge spectra given in table 2.5, and the composition of the peaks in the NaI spectrum given in table 2.6.
17
γ-ray energy (keV) 81 140.5
Nuclide 133
Xe
99m
Half life 5.25d
γ-ray energy (keV) 743.4
Nuclide
I
(3.26d)
97m
Nb
Half life (16.90h)
99
(2.75d)
772.6
132
Te
3.26d
875.3
133
I
20.80h
Xe
9.09h
954.6
132
I
(3.26d)
Sr
9.52h
Tc, Mo
228.2
132
249.8
135
293.3
143
Ce
1.38d
1024.3
91
318.9
105
Rh
1.47d
1236.4
133
I
20.80h
328.8
140
(12.74d)
1260.4
135
I
6.61h
I
8.04d
1298.2
133
I
20.80h
La
(12.74d)
1398.7
132
I
(3.26d)
I
20.80h
1596.2
La
(12.74d)
Ba
12.74d
1678
135
I
6.61h
(9.52h)
1791.2
135
I
6.61h
I
(3.26d)
1917.8
93
Y
10.10h
Nb
(16.90h)
1921.1
132
I
(3.26d)
I
(3.26d)
2002.3
132
I
(3.26d)
Ce
1.38d
2521.3
La
(12.74d)
364.5 487.0 529.9
La
131 140
133
537.3
140
555.6
91m
630.2
132
657.9 667.7 722.0
Y
97
132 143
140
140
Table 2.5: Principal γ-rays observed in spectra recorded using the Ge detectors 2 days after irradiation.
Peak Energy (keV)
Composition
114
99m
Tc 99Mo 70%, 133Xe 20%
210
135
510
133
I 50%, 132I 10%, 91mY 10%, 140La 10%
654
132
I 45%, 97Nb 45%
744
97m
1590
140
1806
135
Xe 50%, 132Te 45%
Nb 45% ,132I 35%, 143Ce 5%
La 95%, 135I 5% I 70%, 97Zr 25%
Table 2.6: The approximate contributions of radioisotopes to the major peaks in the NaI spectrum recorded 2 days after irradiation, determined from the spectra recorded at the same time using the Ge detectors.
18
Figure 2.4: Background subtracted spectra produced by the summation of spectra recorded with the three detector systems 7 days after irradiation. The total livetimes for both Ge detectors were 40000s, the livetime for the NaI detector was 6000s. Approximate energies for some of the peaks are shown, with energies for the principal γ-rays observed in the Ge spectra given in table 2.7, and the compositions of the peaks in the NaI spectrum given in table 2.8.
19
γ-ray energy (keV) 81
Nuclide 133 147
91.1 140.5
Xe
Nd
99m
99
Tc, Mo
Half life 5.25d 10.98d
γ-ray energy (keV) 667.7 724.2
(2.75d)
739.5
Nuclide
Half life
132
I
(3.26d)
Zr
63.98d
Mo
2.75d
95 99
145.4
141
Ce
32.50d
756.7
95
162.6
140
Ba
12.74d
772.6
132
181.1
99
228.2
132
284.3 293.3 364.5
Mo
143
487.0 497.1
103
I
3.26d 8.04d 1.38d 8.04d
I
(3.26d)
815.8
La
(12.74d)
867.8
140
(12.74d)
925.2
140
(12.74d)
La La
954.6
132
I
(3.26d)
1136.0
132
I
(3.26d)
I
(3.26d)
I
(3.26d)
La
(12.74d)
La
(12.74d)
1295.3
Ru
39.35d
1398.7
132
132
I
(3.26d)
1596.2
Nd
10.98d
1921.1
147
537.3
140
Ba
132
I
12.74d
63.98d
140
132
531.0 630.2
I
Ce
131 140
522.7
Te
131
2.75d
Zr
2521.3
140
132
I
(3.26d)
La
(12.74d)
140
(3.26d)
Table 2.7: Principal γ-rays observed in spectra recorded using the Ge detectors 7 days after irradiation.
Peak Energy (keV)
Composition
144
99m
99
Tc Mo 70%, 141Ce 20%
228
132
366
131
505
140
666
132
I 95%
774
132
I 45%, 95Zr 20%, 140La 15%, 99Mo 10%
942
132
I 60%, 140La 30%
1392
132
I
1596
140
Te 95% I 90%, 143Ce 7%
La 140Ba 50%, 132I 20%, 103Ru 15%
La
Table 2.8: The approximate contributions of radioisotopes to the major peaks in the NaI spectrum recorded 7 days after irradiation, determined from the spectra recorded at the same time using the Ge detectors.
20
Figure 2.5: Background subtracted spectra produced by the summation of spectra recorded with the three detector systems 14 days after irradiation. The total livetimes for both Ge detectors were 40000s, the livetime for the NaI detector was 6000s. Approximate energies for some of the peaks are shown, with energies of the principal γ-rays observed in the Ge spectra given in table 2.9, and the compositions of the peaks in the NaI spectrum given in table 2.10.
21
γ-ray energy (keV) 81
Nuclide 133 147
91.1 140.5
Xe
Nd
99m
Ce
32.50d
141
162.6
140
181.1
99
228.2
132
Ba
Mo
304.9 328.8
140
423.7 431.9
La
131 140
I
Ba I
Ba
132
487.0
140
497.1
103
522.7
Te
131 140
364.5
10.98d (2.75d)
145.4
284.3
5.25d
99
Tc, Mo
I
La
Ru
132
I
γ-ray energy (keV) 531.0
Half life
Nuclide
537.3
12.74d 2.75d 3.26d 8.04d 12.74d
147
Nd
140
Ba
Half life 10.98d 12.74d
630.2
132
I
(3.26d)
637.0
131
I
8.04d
667.7
132
I
(3.26d)
724.2
95
Zr
63.98d
756.7
95
Zr
63.98d
765.8
95
Nb
(63.98d)
772.6
132
I
(3.26d)
La
(12.74d)
(12.74d)
815.8
140
8.04d
867.8
140
(12.74d)
12.74d
925.2
140
(12.74d)
(3.26d)
954.6
132
I
(3.26d)
1398.7
132
(12.74d) 39.35d (3.26d)
La La I
(3.26d)
1596.2
140
La
(12.74d)
2347.8
140
(12.74d)
2521.3
140
(12.74d)
La La
Table 2.9: Principal γ-rays measured in spectra recorded using the Ge detectors 2 weeks after irradiation.
Peak Energy (keV) 144
Composition 141
Ce 50%,
228
132
348
131
498
140
684
132
762
95
936
140
1128
132
1596
140
99m
Tc 99Mo 45%
Te 95% I 60%, 140La 35%
La 140Ba 70%, 103Ru 20%, 132I 5% I
Zr 95Nb 45%, 140La 30%, 132I 20% La 60%, 132I 35% I 85%
La
Table 2.10: The approximate contributions of radionuclides to the major peaks in the NaI spectrum recorded 2 weeks after irradiation, determined from the spectra recorded at the same time using the Ge detectors.
22
Figure 2.6: Background subtracted spectra produced by the summation of spectra recorded with the three detector systems 1 month after irradiation. The total livetime for the NaI spectrum was 6000s, the livetimes for both Ge spectra were 40000s. Approximate energies for some of the peaks are shown, with energies of the principal γ-rays observed in the Ge spectra given in table 2.11, and the compositions of the peaks in the NaI spectrum given in table 2.12.
23
γ-ray energy (keV) 81
Nuclide 133
Xe
91.1
147
133.5
144
145.4
Nd
Half life 5.25d
γ-ray energy (keV) 537.3
Nuclide 140
Ba
12.74d
103
Ru
39.35d
10.98d
610.3
Ce
284.90d
637.0
141
Ce
32.50d
661.6
162.6
140
Ba
12.74d
667.7
132
228.2
132
3.26d
724.2
I
8.04d
Ba
I
8.04d
Cs
30.00y
137
(3.26d)
95
Zr
63.98d
756.7
95
Zr
63.98d
12.74d
765.8
95
Nb
(63.98d)
(12.74d)
815.8
140
(12.74d)
I
8.04d
867.8
140
(12.74d)
Ba
12.74d
925.2
140
(12.74d)
304.9
140
328.8
140
Te
La
131
364.5
131
I
131
284.3
Half life
La La
423.7
140
487.0
140
La
(12.74d)
1596.2
140
(12.74d)
497.1
103
Ru
39.35d
2521.3
140
(12.74d)
531.0
147
Nd
10.98d
La La La
Table 2.11: Principal γ-rays observed in spectra recorded with the Ge detectors 1 month after irradiation.
Peak Energy (keV)
Composition
138
144
Ce 50%, 147Nd 50%
336
140
492
140
756
95
930
140
1596
140
Ba 140La 55%, 131I 45% Ba 140La 60%, 103Ru 35%
Nb 95Zr 80%, 140La 20% La La
Table 2.12: The approximate contributions of radioisotopes to the major peaks in the NaI spectrum recorded 1 month after irradiation, determined from the spectra recorded at the same time using the Ge detectors.
24
Figure 2.7: Background subtracted spectra produced by the summation of spectra recorded with the three detector systems 2 months after irradiation. The total livetimes for the Ge detectors were 40000s, the livetime for the NaI spectrum was 6000s. Approximate energies for some of the peaks are shown, with energies of the principal γ-rays observed in the Ge spectra given in table 2.13, and the compositions of the peaks in the NaI spectrum given in table 2.14.
25
γ-ray energy (keV) 91.1
Nuclide 147
Nd
Half life 10.98d
γ-ray energy (keV) 661.6
Nuclide
Half life
137
Cs
30.00y
Zr
63.98d
133.5
144
Ce
284.90d
724.2
95
145.4
141
Ce
32.50d
756.7
95
Zr
63.98d
162.6
140
Ba
12.74d
765.8
95
Nb
(63.98d)
328.8
140
(12.74d)
815.8
140
(12.74d)
I
8.04d
867.8
140
(12.74d)
La
(12.74d)
925.2
140
(12.74d)
Ru
39.35d
1596.2
140
(12.74d)
Ba
12.74d
2521.3
140
(12.74d)
Ru
39.35d
La
131
364.5 487.0
140
497.1
103
537.3
140
610.3
103
La La La La La
Table 2.13: Principal γ-rays observed in spectra recorded with the Ge detectors 2 months after irradiation.
Peak Energy (keV)
Composition
138
141
Ce 85%, 140Ba 15%
330
140
498
103
756
95
1596
140
Ba Ru 50%, 140La 140Ba 45%
Zr 95Nb 97%, 140La 3% La
Table 2.14: The approximate contributions of radioisotopes to the major peaks in the NaI spectrum recorded 2 months after irradiation, determined from the spectra recorded at the same time using the Ge detectors.
26
Figure 2.8: Background subtracted spectra produced by the summation of spectra recorded with the three detector systems 6 months after irradiation. The total livetimes for the Ge detectors were 40000s, and for the NaI detector 6000s. Approximate energies for some of the peaks are shown, with energies for the principal γ-rays observed in the Ge spectra given in table 2.15, and the compositions of the peaks in the NaI spectrum given in table 2.16.
27
Figure 2.9: Background subtracted spectra produced by the summation of spectra recorded with the three detector systems 11 months after irradiation. The total livetimes for the Ge detectors were 40000s, and 6000s for the NaI detector. Approximate energies for some of the peaks are shown, with energies for the principal γ-rays observed in the Ge spectra given in table 2.17, and the composition of the peaks in the NaI spectrum given in table 2.18.
28
γ-ray energy (keV) 91.1
Nuclide 147
Nd
γ-ray energy (keV) 661.6
Half life 10.98d
Nuclide
Half life
137
Cs
30.00y
Zr
63.98d
133.5
144
Ce
284.90d
724.2
95
145.4
141
Ce
32.50d
756.7
95
Zr
63.98d
497.1
103
Ru
39.35d
765.8
95
Nb
(63.98d)
Table 2.15: Principal γ-rays observed in spectra recorded with the Ge detectors 6 months after irradiation.
Peak Energy (keV)
Composition
498
103
750
95
Ru
Zr 95Nb
Table 2.16: The approximate contributions of radioisotopes to the major peaks in the NaI spectrum recorded 6 months after irradiation, determined from the spectra recorded at the same time using the Ge detectors.
γ-ray energy (keV) 133.5
284.90d
γ-ray energy (keV) 756.7
Cs
30.00y
765.8
Zr
63.98d
Nuclide 144
Ce
661.6
137
724.2
95
Half life
Nuclide
Half life
95
Zr
63.98d
95
Nb
(63.98d)
Table 2.17: γ-rays observed in spectra recorded with the Ge detectors 11 months after irradiation.
Peak Energy (keV) 750
Composition 95
Zr 95Nb 90%, 137Cs 10%
Table 2.18: The approximate contributions of various radioisotopes to the major peak in the NaI spectrum recorded 11 months after irradiation, determined from the spectra recorded at the same time using the Ge detectors.
29
2.7 Decay Characteristics The composition of the peaks in the NaI spectra was verified by studying the decay of these peaks over time, and determining the half-lives of the components. This also helps determine the proportions of different components within composite peaks, and at what time in the decay the peaks approximate to being composed of one dominant component. It also helps to indicate where complex decay corrections might be needed when analysing spectra from reactor accidents. The NaI spectra were gain matched, a background was subtracted and they were then combined into spectra with longer effective live times to increase counting statistics. A computer code was written which determined the net area of predefined peaks, found from a window around each peak and two other windows on nearby background areas. The background was determined from the mean counts in the background area and then subtracted from the gross area under the peak. This code was then run for each of the sets of measurements to give the variation of the net counts for the different peaks over time. The net counts for each peak were plotted against time, and least squares fits to a function containing either one or two exponentials conducted. Figures 2.10-2.15 show the net counts and fitted curves of the peaks in the NaI spectra at various stages after irradiation. The points were fitted to functions of the form A = A1e-λ1t + A2e-λ2t
(2.1)
where A1 and A2 are constants representing the activity of each component when the sources were removed from the reactor, and λ1 and λ2 are the decay constants for each component. The half life and decay constants are related by t½=ln2/λ. Attempts at fitting three or more exponentials resulted in very large errors in the parameters, and so were not pursued. For some sets of points only one component was significant, for others the second component was effectively constant (λ2=0) due either to a background component or an isotope with a half life which is very long compared to the length of time over which the observations were made. Tables 2.19-2.23 give the parameters and associated half lives for the fits, along with the major components for these peaks previously determined from the corresponding Ge spectra for comparison. The use of the double exponential function results in reasonable fits to the data points, which in some cases are widely scattered around the fitted curve. There is good agreement between the half lives of the major components of the NaI peaks identified from the Ge spectra and the half lives determined from the decay curves. These half life measurements confirm the assignments of radioisotopic contributions to the peaks in the NaI spectra, and provide valuable information on how the compositions of these peaks vary with time. The different components are best determined from data sets recorded over a period of time that is long compared to the half lives of the components. This is especially evident in figure 2.11 and table 2.20 where only one component for each peak is distinguished. It would be possible to combine several data sets recorded with different sources or geometries, however this has not so far been attempted.
30
Figure 2.10: Net counts for seven peaks in the NaI spectra recorded over the first day of measurements.
Energy (keV)
Parameters
Half lives
A1
λ1 (h-1)
A2
λ2 (h-1)
528
58000
0.68
23000
0.058
642
160000
0.47
11100
0.10
864
1900000
0.83
-
1380
135000
0.330
1494
130000
0.53
Composition
134
-
(1.0±1.0)h (12.0±1.6)h (1.5±0.3)h (7±5)h (50±3)m
900
-
(2.1±0.1)h
92
7000
0.11
88
1830
24000
0.36
-
-
(1.3±0.2)h (6±3)h (1.9±0.1)h
2400
23000
0.33
450
-
(2.1±0.1)h
I (52.60m), 138Cs (32.20m) 91m Y (9.52h), 133I (20.80h) 142 La (1.52h), 134I (52.60m) 97 Nb (16.90h) 134 I (52.60m) 133mTe (55.40m) Sr (2.71h)
Kr (2.84h) I (6.61h) 88 Rb (17.80m), 134I (52.60m), 135I (6.61h) 142 La (1.52h), 88Kr (2.84h) 135
Table 2.19: Parameters of fits to the decay curves for seven peaks in the NaI spectra recorded over the first day of measurements, with corresponding half lives and compositions from table 2.2.
31
Figure 2.11: Net counts for five peaks in the NaI spectra recorded over the second day of measurements.
Energy (keV)
Parameters A1
λ1 (h-1)
Half lives
A2
λ2 (h-1)
Composition
222
8600000 0.0419
-
-
(16.5±0.4)h
135
Xe (9.09h), 132Te (3.26d)
516
6180000 0.0386
-
-
(18.0±0.3)h
133
648
3670000 0.0322
-
-
(21.5±0.3)h
97
744
2120000 0.0340
-
-
(20.4±0.6)h
1014
1970000 0.0679
-
-
I (20.80h), 91mY (9.52h)
Nb (16.90h), 132I (3.26d)
97m
Nb (16.90h), 132I (3.26d), (9.52h) (10.2±0.1)h 91Sr (9.52h), 135I (6.61h)
91
Table 2.20: Parameters of fits to the decay curves for five peaks in the NaI spectra recorded over the second day of measurements, with corresponding half lives and compositions from table 2.4.
32
Sr
Figure 2.12: Net counts for four peaks in the NaI spectra recorded 3-9 days after irradiation.
Energy (keV) 210
Parameters
Half lives
A1
λ1 (d-1)
A2
λ 2 (d-1)
25000000
1.09
2800000
0.192
366
3900000
0.70
83000
-
510
11900000
0.709
800000
0.047
654
17200000
0.80
3060000
0.165
(15±2)h (3.6±0.2)d (23.8±0.7)h
Composition
135
Xe (9.09h) Te (3.26d) 143 Ce (1.38d) 131 I (8.04d) 133 (23.5±0.6)h I (20.80h) (14±2)d 132I (3.26d), 140La (12.74d) (20.8±0.8)h 97Nb (16.90h) (4.2±0.1)d 132I (3.26d) 132
Table 2.21: Parameters of fits to the decay curves for four peaks in the NaI spectra recorded 3-9 days after irradiation, with corresponding half lives and compositions from tables 2.6 and 2.8.
33
Figure 2.13: Net counts for seven peaks in the NaI spectra recorded 10-45 days after irradiation. Energy (keV)
Parameters
Half lives
Composition
A1
λ1 (d-1)
A2
λ2 (d-1)
144
14200000
0.170
517000
-
(4.08±0.07)d
228
6900000
0.199
57000
-
(3.48±0.05)d
348
4530000
0.0851
196000
-
(8.1±0.1)d
131
498
4210000
0.0561
364000
-
(12.36±0.15)d
140
684
12000000
0.22
1000000
0.13
132
762
8100000
0.172
1240000 0.0067
(3.2±0.7)d (5±5)d (4.03±0.09)d (103±9)d (1.7±0.3)d (14.0±0.1)d
1596
6000000
0.40
2320000 0.0495
141
Ce (32.50d), 99mTc 99Mo (2.75d) 132 Te (3.26d) I (8.04d), 140La (12.74d) La (12.74d), 103Ru (39.35d) I (3.26d)
140
La (12.74d), 132I (3.26d) Zr,Nb (63.98d) 132 I (3.26d) 140 La (12.74d) 95
Table 2.22: Parameters of fits to the decay curves for seven peaks in the NaI spectra recorded 1045 days after irradiation, with corresponding half lives and compositions from table 2.10.
34
Figure 2.14: Net counts for four peaks in the NaI spectra recorded 50-75 days after irradiation Energy (keV)
Parameters
Half lives
Composition
A1
λ1 (d-1)
A2
λ2 (d-1)
330
1870000
0.0375
-
-
(18.5±0.4)d
140
498
4950000
0.0268
-
-
(25.9±0.3)d
130
756
2680000 0.00819
-
-
(84.6±1.3)d
95
1596
8400000
-
-
(11.2±0.5)d
140
0.062
Ba (12.74d) Ru (39.35d), 140La Ba (12.74d)
Zr Nb (63.98d) La (12.74d)
Table 2.23: Parameters of fits to the decay curves for four peaks in the NaI spectra recorded 50-75 days after irradiation, with corresponding half lives and compositions from table 2.14.
35
Figure 2.15: Net counts for two peaks in NaI spectra recorded 3-11 months after irradiation. Energy (keV)
Parameters
Half lives
A1
λ1 (d-1)
A2
λ2 (d-1)
498
1270000
0.0140
28000
-
(49.5±1.8)d
750
860000
0.00969
-
-
(71.5±0.6)d
Composition
103
Ru (39.35d)
95
Zr Nb (63.98d)
Table 2.23: Parameters of fits to the decay curves for two peaks in the NaI spectra recorded 3-11 months after irradiation, with corresponding half lives and compositions from table 2.16.
36
2.8 Source Composition During the course of the experiment γ-rays from 42 different isotopes were identified. Table 2.24 lists these isotopes in the order in which they cease to be observable in the Ge spectra, with their half lives, periods during which they were observable and additional comments mostly relating to the NaI detector. Except for 151Pm and 137Cs γ-rays from all these isotopes were observed in at least one detector during the first day. All the isotopes listed in table 1.1 were observed, in addition some further isotopes with half lives less than one hour were observed in the first day after irradiation. Nuclide 133
Te
12.50m
Period Comments observable first day only Not observed in NaI spectra
141
Ba
18.27m
first day only Not observed in NaI spectra
131
23.00m
first day only Not observed in NaI spectra
131
25.00m
first day only Not observed in NaI spectra
138
32.20m
first day only Component of 2 NaI peaks
134
41.83m
first day only Component of two NaI peaks
134
I
52.60m
first day only The major component of one NaI peak, contributes to 5 other peaks
133m
Te
55.40m
first day only Minor contribution to NaI spectra
87
1.27h
first day only Slight contribution to NaI spectra
1.38h
first day only Not observed in NaI spectra
142
La
1.52h
first day only Component of 2 NaI peaks
149
Nd
1.73h
first day only Not observed in NaI spectra
88
Kr
2.84h
first day only Major component of two NaI peaks
88
Rb
(2.84h)
→ 1 day
Contribution to one peak in NaI spectra
4.44h
→ 1 day
I
6.61h
→ 2 days
135
Xe
9.09h
→ 2 days
Not resolved in Ge spectra in first few hours, not observed in NaI spectra Major component of 2 peaks in NaI spectra, especially from the end of day one Major component of one NaI peak
Sr-91mY
9.52h
→ 2 days
Major component of one peak in NaI spectra at 1 day
10.10h
→ 2 days
Not observed in NaI spectra
I
20.80h
→ 2 days
Major component of one peak in NaI spectra, especially at 2 days
Rh
1.47d
→ 2 days
Not observed in NaI spectra
Zr-Nb, Nb 151 Pm
16.90h
→ 1 week
Sb Te Cs
Te
Kr
139
Ba
105
Ru
135
91
93
Y
133 105 97
Half life
97m
1.18d
Major components of NaI spectra at 1-2 days, not observed in NaI spectra at 1 week 1 → 14 days Not observed in NaI spectra
37
143
Ce
1.38d
1 month
Mixed with 99mTc in NaI spectra from 2 weeks
Te-I
3.26d
1 month
Major component to peaks in NaI at 2 days, clearly resolved at 1 week
Xe
5.25d
1 month
Not resolved from 144Ce in LoAx
Mo-99mTc
2.75d
2 months
Major component of NaI spectra from 2 days
I
8.04d
3 months
Part of poorly resolved NaI peak from 1 day, resolved from 1 week
Nd
10.98d
6 months
Component of low energy NaI peak
Ba-La
12.74d
6 months
1596 keV peak resolved in NaI by 1 week
141
Ce
32.50d
entire year
103
Ru
39.35d
entire year
Zr-Nb
63.98d
entire year
284.90d
entire year
30.00y
1 month
132
133 99
131 147 140
95
144
Ce
137
Cs
Major component in NaI spectra from 2 weeks, mixed only with 140Ba from 2 months In NaI; mixed with 140Ba,La after 1 month, fully resolved after 6 months In NaI; mixed with 140La at 1 month, resolved at six months, mixing with 137Cs by 11 months Not resolved from 133Xe in LoAx, component of low energy NaI peak from one month Not fully resolved from 95Zr-Nb in NaI
Table 2.24: Isotopes observed in the experiment, with their half lives and the periods over which they were observed. The comments relate mostly to the NaI detector. The isotopes are listed in the order in which they cease to be observable in the Ge spectra.
38
3. SOURCE TERM AND γ-RAY SPECTRUM SIMULATION 3.1 Nuclear Fission Nuclear fission is the process whereby heavy nuclei, typically actinides, split into two lighter nuclei, with an accompanying release of energy. For several nuclei fission follows the capture of a thermal neutron; such nuclei are said to be fissile. Nuclear reactors operate on a chain reaction in which a fissile nucleus (usually 235U) absorbs a thermal neutron (ie neutrons which are in thermal equilibrium with the reactor, with energies of about 0.03eV) which induces fission. The fission releases energy and a number of fast neutrons, these neutrons are then moderated, slowing them down to thermal energies. If, on average, one of these neutrons is absorbed by another fissile nucleus resulting in fission then a self-sustaining chain reaction occurs, and the reactor is said to be critical. If, on average, more than one neutron is absorbed by a fissile nucleus then the reactor is said to be super-critical, if less than one neutron is absorbed the reactor is sub-critical. Following fission a broad range of products is formed with masses mostly in the range from 60170 atomic mass units (amu‟s); the yield of any one isotope being at most a few percent. Most of the nuclei formed are unstable, having an excess of neutrons, and decay by β-emission (with half lives ranging from milliseconds to several years), or very occasionally by neutron emission (with half-lives of less than a few seconds). The radioisotope inventory of a nuclear reactor consists of a complex cocktail of fuel material, fission products, decay products and activation products caused by the capture of neutrons by other material in the reactor (fuel cladding, moderators, structural materials etc.). The composition of this inventory will change over time as fission products are produced, and then decay or absorb neutrons. In the event of an accident the composition of the radionuclides released will depend upon the current radioisotope inventory of the reactor and the type and severity of the accident. The fission rate in a reactor (Rf) depends on the number of fissile nuclei present (NU), the neutron flux (φ) and the fission cross section (σf). Rf = NUφσf
(3.1)
The number of any particular isotope formed by fission (dNf) during a time interval (dt) will depend on the fission yield (Yf) for that isotope. dNf = RfYfdt
(3.2)
The isotopes thus formed then decay, usually by β-decay, with a characteristic half-life (t½). The number that decay (dNd) depends on the number present (N) and a decay constant (λ). The number of daughter isotopes also increases by the same amount. Where there is more than one decay path the increase in population is divided between the daughter isotopes according to a branching ratio. dNd = N e-λdt
39
(3.3)
The population of a particular isotope will also decrease as a result of neutron capture (or “burnup”), depending on the neutron capture cross section (σc). There will also be a corresponding increase in the population of the resulting isotope. dNc = N φ σc dt
(3.4)
The resulting change in the population of a particular isotope in time interval dt is thus the product of these processes. dN = dNf – dNd – dNc + dNd’ + dNc’
(3.5)
Where dNd’ and dNc’ are the changes in population due to the decay of and neutron capture by other isotopes. To simulate a fission product inventory one simply has to evaluate dN for all isotopes formed in the fission process or by neutron capture by fission products over a series of time intervals. 3.2 Simulation Code Development A simple code to simulate fission product inventories has been developed using the C++ programming language (Cresswell 1997). It assumes that fission of 235U induced by thermal neutrons is the only fission process that occurs, ie: it ignores fission induced by fast neutrons on 235 U or fission of other isotopes. The formation of activation products by neutron capture on reactor material is also ignored, as is the production of trans-uranic isotopes by neutron capture on fuel. The code also assumes that the neutron flux is constant throughout the entire mass of fissile material and fission products. The code consists of a series of modules which handle the nuclear data and the population of the isotopes of interest, the simulation of fission product inventories, the simulation of the decay of inventories and various file handling functions. The relationship between these modules is shown in figure 3.1, and details of each module are given below. The Nuclear Data and Population Module The nuclear data and the population of nuclear states is handled by a class (which is a C++ data structure containing mixed data types and functions). For each isotope and metastate nuclear data for independent and cumulative fission yields, half-lives, thermal neutron capture cross-sections, decay modes and γ-ray energies and intensities are stored. In addition, there are variables for the population and change in population of each state. The data used was derived from the JEF 2.2 database using the JEF-PC package (OECD 1994). The class also contains a number of functions to allow other parts of the program to access the data, and to read or write to the population information. Upon execution the class is initialised, at which point the nuclear data is loaded from an ASCII file. This provides flexibility in the data used by the simulation, allowing the inclusion of further data (eg: data for reactor materials and their activation products). At present the program uses data for 785 nuclear states.
40
Figure 3.1: The relationship between the different modules of the simulation code. The Simulation Code Module The program loops through all the nuclear states calculating the change in population for each using equation 3.5, for an initial mass of 235U, neutron flux and time interval entered by the user. After each loop the population of each state is updated, and the simulation time increased by the time interval until the final simulation time (which is also entered by the user) is reached. This routine is illustrated in figure 3.2. The Decay Code Module The decay code module is the similar to the simulation code module, except that only the decay terms are considered. The user inputs the simulation time and time interval, the 235U mass and neutron flux are not required. The Spectral Simulation Module The spectral simulation module uses the population information and the γ-ray energies and intensities from nuclear data to produce simulated γ-ray spectra. The code calculates the activity of each isotope, and then the associated γ-ray information is collated into a line spectrum at 1 keV per channel. This spectrum is then compressed into a 5 keV per channel array from which a simulated NaI spectrum is formed by using spectra produced by separate Monte Carlo codes. These are calculated for a source on a concrete surface with the detector either 1.6m or 50m above it for γ-ray energies at 5keV intervals. These spectra are stored as ASCII files and recalled when needed. The total spectrum is formed by summing the spectra corresponding to each of the channels in the compressed array multiplied by the intensity of that channel. Spectra were simulated for channels with intensities greater than 1% of the maximum intensity, for channels with less intensity a nearby spectrum (within 50KeV) was used and stretched to the correct energy using the technique of Paatero 1964. Two Monte Carlo codes had been developed previously to simulate the response of AGS detectors to natural radiation fields and some generalized
41
Figure 3.2: Schematic of the inventory simulation module. The decay module is similar, except only the decay term dNd is used.
anthropogenic sources (Allyson 1994, Allyson & Sanderson 1997). A full analogue code (MCI) was validated and experimentally used for the close-coupled geometries. For AGS geometries a statistical estimation technique (MCII) was developed to increase simulation speeds. For this work a further code incorporating an inverted source-detector geometry was developed (MCIII), which results in further efficiency improvements for uniform planar sources (Allyson 1997). In addition to producing the NaI spectrum it is also possible to output the 1keV per channel line spectrum. It is also possible to produce NaI spectra for a single mass chain or isotope in addition to the entire inventory. This information, along with the activities of all the states in the source, enables one to quantify the contributions of each state to the peaks in the NaI spectra, and produce spectra for each of these components. This is a potentially very useful tool in spectral deconvolution studies, although it has not been used for this purpose in the current study. The File Handling Module The file handling module handles the saving and loading of the inventory data. The data are saved as ASCII files consisting of a user supplied header string identifying the file contents, the number of 235U nuclei and the fission product inventory saved as a string identifying the isotope (as “A[m]X”, where A is the mass, „m‟ is included for metastates, and X is the elemental symbol), the number of nuclei and activity in becquerels, and a file terminator. The file format allows one
42
to enter inventories from other sources (eg: the source terms of past accidents). Data can be saved either from the main menu, at the end of a simulation or automatically at intervals during a simulation. In the later instance the time into the simulation is added to the header string. When loading the inventory data the option of replacing or adding to existing data is given. An additional routine allows the output of the fractional contribution of the activity of each state to the total source activity. This can be given in isotopic order or in order of decreasing activity, and an activity threshold can be used. 3.3 Verification of Code In order to verify that the simulation code was working correctly, it was run to produce simulated spectra for the previously measured experimental system. The spectra were normalized to the experimental spectra using the known livetimes, and geometrical correction factors determined from spectra recorded with the calibration sources. Figure 3.3 shows six of these simulated spectra with the corresponding experimental spectra. It can be seen that, with a few exceptions, there is good agreement between the simulated and measured spectra. The exceptions are peaks in the experimental spectra due to poorly subtracted background, particularly from the 2614keV 208Tl peak, and the high low energy background at 3 hours (spectrum (a)) due to scatter from the sides of the floor pit. One significant difference between the experimentally measured and simulated spectra is the absence of the shoulder on the 750keV peak at 6 months (spectrum (f)) due to 137Cs. The contribution of 137Cs calculated from the Ge spectra and the simulation both agree, and are both insufficient to account for the experimentally observed shoulder. The shoulder is probably due to incomplete subtraction of a laboratory background. The simulation output includes the activities of each fission fragment and a list of γ-ray energies (to 1keV) and intensities. From these it is possible to determine the main components of each of the peaks in the NaI spectra, which can be used to confirm the identifications derived from the Ge spectra. Table 3.1 compares the identification of selected peaks determined from the simulation and experimental measurements. It can be seen that, for most peaks, the agreement is very good, confirming that the simulation code accurately models the experimental data.
43
Figure 3.3: Spectra generated by the simulation of the experimental system (solid lines) with the corresponding experimentally measured spectra (dashed lines) for six different periods after irradiation. (a) 3 hours, (b) 1 day, (c) 2 days, (d) 7 days, (e) 14 days and (f) 6 months after irradiation.
44
Peak Energy (keV)
Time after irradiation
Main isotopic contributions Experimental
114
2 days
99m
144
7 days
222
99
Simulation
Xe 20%
99m
99m
Tc 99Mo 70%, 141Ce 20%
99m
1 day
135
Xe 75%, 132Te 20%
135
366
7 days
131
131
505
7 days
140
140
510
2 days
133
133
516
1 day
133
133
528
3 hours
133
91m
654
2 days
132
97
642
3 hours
142
142
666
7 days
132
132
648
1 day
97
97
744
2 days
97m
744
1 day
97m
750
6 months
95
774
7 days
132
132
864
3 hours
134
134
942
7 days
132
132
1014
1 day
91
91
1116
1 day
135
1266
1 day
135
135
1380
3 hours
92
92
1392
7 days
132
1446
1 day
135
1590
2 days
Tc Mo 70%,
133
Tc Mo 70%, 131Te 20% Tc 99Mo 75%, 141Ce 15%
Xe 50%, 132Te 20%, 143Ce 20%
I 90%, 143Ce 7%
I 65%, 140La 17%, 143Ce 12%
Ba-La 50%, 132I 20%, 103Ru 15% I 50%,132I 10%,140La 10%,91mY 10% I 60%, 91mY 25%, 97Zr 5% I 30%, 91mY 25%, 134I 20% I 45%, 97Nb 45%
Ba-La 60%, 103Ru 15%, 132I 12% I 60%, 140Ba-La 10%, 91mY 10% I 65%, 91mY 25% Y 30%, 133I 30%, 134I 20%
Nb 97Zr 50%, 132I 45%
La 40%, 134I 30%, 97Nb 15%
La 40%, 134I 25%, 97Nb 20% I 85%, 131I 5%
I 95%
Nb 65%, 132I 20%, 91Sr 5% I 35%,
143
Nb 55%, 132I 15%,
91
Nb 45%,
132
Ce 5% Sr 10%
Zr-Nb 98%, 137Cs 2% I 45%,95Zr 20%,140La 15%,99Mo 10% I 80%, 133mTe 10%
Nb 85%
97m
Nb 45%, 132I 30%
97m
Nb 55%, 132I 15%, 91Sr 10%
95
Zr-Nb 98%, 137Cs 1% I 55%, 95Zr 25%, 99Mo 10% I 85%, 133mTe 7%
I 60%, 140La 30%
I 45%, 140La 40%
Sr 85%, 135I 13% I 60%,
Sr 75%
131m
97
Te 20%, Zr 10%
I 70%, 133I 25%
135
I 50%, 131mTe 15%, 97Zr 15% I 55%, 132I 15%
Sr 75%, 138Cs 25%
Sr 65%, 138Cs 25%
132
I
I 95%
91
92
140
La 95%, 135I 5%
140
7 days
140
140
1830
3 hours
88
2400
3 hours
88
1596
99
Sr 92Y 45%, 135I 25%, 132I 20%
I 70%, Sr 15%
La 98%
La
Rb 45%,
La 99%
134
I 30%,
135
I 20%
Kr 55%, 142La 45%
88
Rb 35%, 134I 25%, 142La 20%
88
Kr 55%, 142La 40%
Table 3.1: Comparison between compositions of selected NaI peaks determined experimentally from Ge spectra and from the simulation.
45
3.4 Simulation of airborne geometry Spectra corresponding to an airborne geometry, with the detector place 50m above a uniform plane deposition with the same isotopic composition as the simulated experimental sources, were also simulated. Figure 3.4 shows some of the resulting spectra with the corresponding closecoupled simulated spectra for comparison. The airborne spectra shown in this figure have been scaled by arbitrary factors to produce spectral features of similar intensities to the close-coupled geometry spectra, and thus ease comparison between the two. The airborne spectra are similar to the ground based spectra, except at energies below about 600keV where the scattering of γrays by the intervening atmosphere creates a large background which swamps the peaks in this region. However, this background can be removed from experimental spectra by the use of altitude dependent stripping factors, which can be determined from experimental measurements or Monte Carlo simulation (Allyson 1994, Allyson & Sanderson 1997). 3.5 Simulation of long irradiation periods The spectra described so far, both experimental and simulated, have been produced by sources that have undergone short irradiation periods of at most 1.5 hours. However it would be expected that the source term from real nuclear accidents would be from material that had experienced much longer irradiation periods. The code has been used to simulate a six month irradiation of 235 U, with full retention of fission products, to provide further information on the spectra that would be observed from more realistic source terms. Simulated airborne NaI spectra for various times after irradiation were produced, some of which are shown in figure 3.5 with the corresponding spectra for a short irradiation for comparison. The major components of the peaks in these spectra are given in table 3.2. These spectra clearly show the greater influence of longer lived isotopes, with a corresponding reduction in the contribution of shorter lived isotopes. This is particularly noticeable in the earlier spectra where the 140La peak at 1596keV is present in the spectra produced following the longer irradiation but not in the spectra for the short irradiation. Conversely, the 864keV peak due to 134I is present in the 3 hour spectrum for a short irradiation, but absent in the spectrum for longer irradiation times. For later periods after irradiation the spectra for short and long irradiations become progressively more alike.
46
Figure 3.4: Spectra generated by the simulation of the experimental sources for airborne geometry (solid lines) with the corresponding ground based simulated spectra (dashed lines) for six different periods after irradiation. (a) 3 hours, (b) 1 day, (c) 2 days, (d) 7 days, (e) 14 days and (f) 1 month after irradiation.
47
Figure 3.5: NaI spectra, for the airborne geometry, for sources produced by long (solid lines) and short irradiation (dashed lines) periods, at (a) 3 hours, (b) 1 day, and (c) 2 days after irradiation. With the energies of peaks in the spectrum produced from the long irradiated source indicated.
48
Peak Energy (keV)
Time
Composition
370
2 days
143
490
1 day
133
490
2 days
140
500
3 hours
140
650
3 hours
132
660
1 day
132
670
2 days
131
745
3 hours
95
745
1 day
95
760
2 days
132
915
1 day
140
915
2 days
140
1125
3 hours
135
1135
1 day
131m
1145
2 days
132
1370
2 days
132
1375
3 hours
92
1595
3 hours-2 days
140
1835
3 hours
88
1970
1 day
132
1995
2 days
132
2000
3 hours
88
2205
3 hours
88
2310
1 day
140
2315
2 days
140
2395
3 hours
88
2500
3 hours
140
2525
1 day
140
2535
2 days
140
Ce 30%, 131mTe 25%, 99Mo 15% I 55%, 140Ba 25% Ba 35%, 133I 30%, 132I 15% Ba 40%, 132I 25%, 135Xe 13%, 147Nd 8%, 97Zr 7% I 45%, 97Nb 40% I 80% I 70%, 97Nb 15%
Zr-Nb 70%, 132I 20%
Zr-Nb 55%, 132I 12%, 97mNb 10% I 30%, 95Zr 30%, 140La 20%, 97mNb 10%, 99Mo 10% La 65% La 90% I 50%, 131mTe 10%, 134I 8% Te 35%, 135I 30%, 132I 28%
I 50%, 131mTe 25% I 80%, 133I 10%
Sr 60%, 132I 20% La
Rb I 55%, 131mTe 25%, 93Y 10% I 75%, 131mTe 15%
Kr 45%, 132I 30%, 135I 20% Kr 70%, 142La 10% La 75% La
Kr 55%, 142La 10% La 75%, 142La 15% La La
Table 3.2: Composition of peaks in the simulated NaI spectra for a long irradiation period.
49
4. DISCUSSION Over the course of a year gamma-ray spectra were recorded from a fission product source using three different detectors and two spectrometry systems. Analysis of these spectra showed that most of the peaks arise from an initial set of 42 different isotopes which could be resolved using the Ge detectors. This set of isotopes simplified rapidly; after one day some 28 isotopes remained, by one week this had reduced to some 20 isotopes, by one month to 18, and by 6 months to 7 isotopes. The NaI detectors were able to resolve some of these nuclides at all stages, albeit with interferences which would need to be stripped out, particularly at the early stages. Those isotopes most readily measurable in the experimental NaI spectra are listed in table 4.1 with the period over which they were observed and the peaks which they contributed to. Inert gases have not been included in this table. In the event of an accidental release of fission products these would not be expected to contribute to deposited activity, which we take to be the principle target for airborne gamma spectrometry. However, noble gases could contribute to spectra recorded from any plume, and may well represent a significant external dose contributor. From this point of view the most significant isotopes would be 87Kr, 88Kr and 135Xe, all of which would be detected over the first few days. From table 4.1 it is possible to indicate how one might undertake the mapping of radiologically important nuclides deposited after an accident using NaI spectrometers. While such high volume scintillation detectors are not able to resolve the full range of nuclides, they are clearly able to retrieve information on important sets of nuclides. Dealing with the earliest stages first, it is notable, and possibly not widely recognised, that 92Sr (t½ = 2.71 h) and 91Sr (t½ = 9.52 h) both have high fission yields with sufficiently high energy γray emission to be readily detected within the first day or two using AGS systems. The significance of this is observation is that 89Sr and 90Sr are pure β-emitters which are difficult to quantify in the environment, but can potentially contaminate milk and accumulate in bone. In past accidents considerably less is known about the spatial distribution of Sr isotopes than the more readily determined I or Cs isotopes, partly as a consequence of the need for radiochemical separations in their determination. The possibility of inferring the distribution of β-emitting Sr isotopes by γ-ray surveys represents a potentially important role for AGS, and one which has not previously been recognised. However to be effective it would depend on (i) the release of activity taking place within 1-2 days of irradiation and (ii) rapid deployment of the survey, since the window of opportunity for detection of 92Sr and 91Sr is short. It should be borne in mind that rapid deployment may raise the risks of contaminating the aircraft, and that these should be balanced against the value of the information which could be gathered. The iodine isotopes are another critically important group of radiologically important nuclides, since they are volatile, and thus likely to be released in an accident. Furthermore, if inhaled or ingested, they can accumulate in the thyroid with a resulting increased chance of thyroid cancer. In the NaI spectra, 134I (t½ = 52.6 m) and 133mTe (t½ = 55.4 m) produce a single peak at 864keV that is resolved for the first five hours after irradiation. After a few hours the 135I (t½ = 6.6 h) peak at 1458keV and the 133I (t½ = 20.8h) peak at 530keV are readily quantifiable for a couple of days. The longer lived isotopes 132I (with its associated 132Te parent, t½ = 3.26d) and 131I (t½ = 8.04 d) are quantifiable after one day and one week respectively, although both require the stripping out of other components. Both of these isotopes remain quantifiable for several weeks. It is evident
50
Isotope
Half life
134
52.60m 55.40m 1.52h
→ 10 hours
2.71h
→ 15 hours
I Te 142 La
133m
92
Sr
Period quantifiable Method of measurement → 5 hours
135
I
6.61h
5 hours → 2 days
133
I
20.80h
5 hours → 3 days
Zr-Nb
16.90h
97
91
Sr
9.52h
Te-I
3.26d
Mo 99mTc
2.75d
132
99
140
Ba-La 131
12.74d
I
8.04d
Zr-Nb
63.98d
103
39.35d
95
Ru
137
Cs
30.00y
864keV peak composed of 864keV 1334Te and 847keV, 884keV 134I γ-rays. 2400keV peak composed of 2398keV and 2543keV 142 La and 2392keV 88Kr γ-rays 1380keV peak due largely to 1384keV 92Sr γ-rays 1494keV peak composed of 1458keV 135I and 1530keV 88Kr γ-rays 522keV peak has strong 530keV 133I γ-rays component
10 hours → 5 days 648keV peak composed of 658keV 97Nb and 621keV, 630keV 132I γ-rays 744keV peak composed of 743keV 97mNb and 772keV 132 I γ-rays 1 day → 2 days 1014keV peak composed of 973keV, 1039keV 135I and 1024keV 91Sr γ-rays 1 day → 2-3 weeks 222keV peak composed of 228kev 132Te and 250keV 135 Xe γ-rays 942keV peak composed of 952keV 132I and 925keV 140 La γ-rays (subtracting 140La from 2 days) 1392keV peak composed of 1372keV and 1399keV 132 I γ-rays from 5 days 2 days → 2 months 144keV peak composed of 141keV 99mTc and 81keV 133 Xe γ-rays, with 145keV 141Ce γ-rays from 7 days. If threshold is not too high 2 days → 6 months 1596keV peak due to 1596keV 140La γ-rays 1 week → 1 month 348keV peak composed of 284keV, 365keV 131I and 305keV, 329keV 140Ba-La γ-rays (subtracting 140 Ba-La) from 1 week 750keV peak composed of 724keV, 757keV, 766keV 95 Zr-Nb and 752keV 140La γ-rays (subtracting 140La) also 661keV 137Cs γ-rays from 10 months from 1 week 498keV peak composed of 497keV 103Ru and 424keV, 487keV 140Ba-La γ-rays (subtracting 140Ba-La) from 6 months Shoulder on side of 750keV peak due to 661keV γ-ray
Table 4.1: The isotopes that are readily quantifiable in the NaI spectra recorded in this experiment at various stages after irradiation, giving the approximate periods when they are identifiable, with details of the peaks they are measurable in and what, if anything, would need stripping out.
51
from the data examined in this project that the preferred I peaks and interferences which would need to be stripped out change rapidly over the first few days after irradiation. Nevertheless it would be possible to quantify I nuclides (using an appropriate time dependent model) at all stages. The volatility of these nuclides has been noted, and it is further notable that after both the Windscale fire in 1957 and the Chernobyl accident, where I nuclides comprised a major component of the environmental source terms, that 131I was detected by AGS methods (Williams et. al. 1958, Mellander 1989, Grasty et. al. 1997). Table 4.1 also shows that a range of less volatile and non-volatile fission products are also detectable. Of these 99Mo-99mTc (t½ = 2.75d) could be detected in the low energy spectral region (