Proceedings of the 2001 IEEE International Conference on Robotics & Automation Seoul, Korea • May 21-26, 2001
Computer Vision Based Object Detection and Recognition for Vehicle Driving
Li-Chen Fu Computer Science & Information Engineering, National Taiwan University Taipei 106,Taiwan E-mail :
[email protected] Cheng-Yi Liu Computer Science & Information Engineering, National Taiwan University Taipei 106,Taiwan E-mail :
[email protected]
a system can detect the existence of an obstacle and tell if it may affect the safety of the vehicle driving, then the diver can be asked to be more careful of such a condition so that a possible traffic accident may be avoided. This is especially important when the driver is drunk or when the vehicle is traveling at a very high speed, and then many lives, including the driver and pedestrians, could be saved. On the other hand, the system may also facilitate the subsequent design of an automatic vehicle guiding system whereby the driver only needs to specify the destination or to choose the strategy for cruising when he is inside a vehicle for driving.
ABSTRACT Applying computer technology to vehicle driving has been studied for many years. Most of the studies focused on autonomous vehicle driving in a simplified environment like freeways, or life independent systems like GPS. A general case where kind of unexpectedly fatal conditions may occur which we are driving in an urban area, however, has not been considered. In this paper, we proposed a system to satisfy the basic criteria for such a general driving assistance. We detect the obstacles on the ground in front of the vehicle we are driving, and then classify them into three predefined categories: pedestrians, vehicles, and others. In the proposed system, we exploit a simplified stereovision system to detect the obstacles instantly. After that, to search and track pedestrians and vehicles, different methods are used for adapting to their heterogeneity. For the sake of implementation, we also propose a method to decide the maximal speed of driving to keep such kind of systems working.
Related Work For generic obstacle detection, Badal et al. [1] developed a practical obstacle detection and avoidance system. They obtain the range information through stereo images by computing a disparity picture from the image pair and by extracting points above the ground plane. Obstacles are detected and located to guide the vehicle to move toward the direction with the least obstacles. Bertozzi and Broggi proposed the so-called GOLD system which both detects the generic obstacles and the lane position in a structured environment [2]. It also uses stereovision based hardware and software architecture to extract obstacles, and the robustness of their system under some conditions like shadows, changing illuminations, and different road textures is tested. A similar result can be found in [3]. The existent methods to recognize pedestrians can be classified into four types: generalized cylinder model-based, stick model-based, rhythm model-based, and distance transform-based methods [4]. The fore two types of methods are too complex for real-time purpose, while Mori and Charkari performed a sign pattern-based method
1. Introduction Motivation & Objective In the past hundred years, humans have made tremendous advancements in transportation. We made cars, trains, aircrafts, etc., that go faster and faster to meet our unlimited desire. However, the space and the speed the traffic tools can achieve are becoming larger and higher than that humans can control. To resolve such problems, many driving assistant tools are developed. However, the gap of speed causes many more subtle-problems of which few of them are exactly resolved. Obstacle detection and warning is the most important one in the unresolved set. If
0-7803-6475-9/01/$10.00© 2001 IEEE
2634
which can quickly recognize a specific type of obstacle depending on its respective sign pattern [4]. The sign pattern for pedestrians is the rhythm of walking. Distance transform-based method is used to adapt to a variety of shapes of non-rigid bodies. Huttenlocher et al. have demonstrated applying the method to human recognition [5] [6], while a real-time obstacle detection method in the following used it for obstacle recognition [7]. In vehicle recognition, Wetzel et al. [8] presented a fully automatic system, MOSAIK, which recognizes and describes all visual vehicles on or near the road. They used geometrical hypothesis and verification method to recognize vehicles instead of prototypes of vehicles for recognition. In the contrast, Tan et al. proposed a 3D model construction, recognition, and localization method [9] based on the simple rectangular shapes of vehicles. They constructed four models depending on the type of vehicle: saloon, minibus, transit van, and high-roof van. Few complete studies have done on both obstacle detection and recognition for real vehicle driving. Gavrila and Philomin [7] perform real-time object detection for vehicle driving. They used a distance transform based matching to detect pedestrians and to recognize traffic signs. Their source code was optimized by the SIMD instructions of Pentium II. The performance of the system is about 1 to 5 Hz, a near real-time detecting speed.
know if there are some generic obstacles on the ground and then decide if it is worth or not to do further processing. The existence problem is to extract objects satisfying the definition of generic obstacles as described above. We emphasize that the existence problem is just to check the existence of generic obstacles instead of the exact number of generic obstacles, because an obstacle may be occluded by or very close to another. Without object identification or distance measuring, we can hardly assure that each instance of existence detected is just a single obstacle. Thus, we simply name the detected instances as “obstacle groups”. To get more precise information on the obstacle group, we have to separate each obstacle from it. In the paper, we are only just interested in pedestrians and vehicles. Thereby the classification problem here is to distinguish the generic obstacles into three categories: 1) pedestrians 2) vehicles 3) others. After we have confirmed the existence and the type of generic obstacles in front of the vehicle, the locations of each obstacle should be calculated. The objective here is to find the relative homogeneous Obstacle coordinate transform TVehicle (t ) for each of the found obstacles, from the image data at time t. And then we know how “far” an obstacle is from our vehicle.
2. Preliminaries
In this paper, a simplified binocular stereopsis for obstacle detection is proposed. The idea is to get rid of the disparity computations in traditional models. The ground plane can be removed easily and obstacles are detected at the same time. On the other hand, the distance measure of an obstacle in this method is more precise than the old ones. The reason we can have a simplified version of the binocular stereopsis is that the main objective of our work is to verify the existence of pedestrians or vehicles, not to reconstruct the whole three-dimensional environment. In the proposed method, two cameras are placed such that one is above the other along a vertical line, but not right and left. Assume the ground plane is completely flat, the optical axes of the two cameras are parallel to the ground plane. For simplicity, we also assume that the two cameras are the same, and the intrinsic parameters of them
3. Obstacle Detection
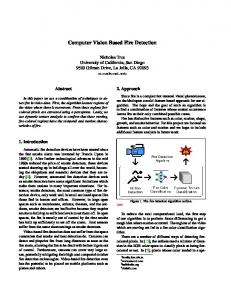
Before we proceed, we must first define what obstacles are. Assume that vehicles drive on a flat ground plane, then obstacles are those on the ground and are higher than the ground plane. They include buildings, landmarks, trees, pedestrians, vehicles, motorcycles, and so on. More precisely, we call them “generic obstacles”. Although there are so many kinds of objects belonging to the generic obstacle, pedestrians and vehicles are no doubt the most important obstacles to be concerned with. The overall system in this paper can be defined as: - At time t, the system gets information of the traffic condition Info(t), then decides four things from Info(t): 1) Is there any generic obstacle? 2) Is there any pedestrian or vehicle in the detected generic obstacles? 3) Where are the obstacles? 4) In such a situation, should the driver pay more attention to the road condition the system responds at time t+1? Since we almost always drive forward, the obstacles are now those just detected in front of the vehicle. Info(t) may be provided by any kind of sensor attached on the vehicle; for example, radar sensors, infra-images, or sonar. In this paper, we use stereo computer vision to get the most complete information since it can detect large range of space but subject to less limitation on detecting a variety of obstacles. The sub-problems described in the following paragraph have to be resolved in order to construct such a system. Before any other analysis that can start, we need to
Figure 3-1 The projection of a point on the ground plane in the two frames
2635
detect generic obstacles simply by getting I d . On the other hand, we can construct a distance map Distr ( y ) for each row of I lp , which indicates the effective range on the ground that will be projected onto some particular row. The construction relies on some prior knowledge of the size of a pixel on the CCD and the focal length of the camera, which should be obtained by some off-line experiments under appropriate settings. Assume that the height of a pixel in the CCD is h p and the distance between the CCD and the lens is f , the effective range Y r for the r_th row ( Yl = r , r > 0 ) can be assessed by the inequality:
are both adjusted to be equal. Let the images be obtained by the two cameras are I u and I l , respectively. In the following, we will show the properties held by such a configuration of stereovision. In Figure 3-1, we use the pinhole camera model to show how a point P on the ground plane will be projected onto the image planes of the upper and lower cameras, respectively. The pinhole model describes that each ray of lights passes through a common center of projection and intersects the image plane at a unique position. We define two two-dimension (2D) image coordinates for the upper and the lower image, respectively, namely, X u − Yu and X l − Y l . For convenience, in the following discussions, G represents the ground plane.
æ æ OO l ö÷ OO l ö f ⋅ ç1 + ≤ Yr < f ⋅ ç1 + ç ÷ ç (r + 1) ⋅ h p r ⋅ hp è è
Property 3.1: For any point P ∈ G , P = ( X , Yc ,0 ) , where Yc is a constant, the projections of P onto I u and I l , are Pu = ( x u , y u ) and Pl = ( x l , y l ) , respectively, which also lie on the two horizontal lines Yu = y u and Yl = y l , respectively. On the other hand, x u = x l .
Similarly, Distc ( x ) can be constructed in a similar manner. If the width of a pixel in the CCD is w p , the effective range X c for the c_th column ( X u = c and X l = c ) is:
In Fact, since the intrinsic parameters are equal for the two cameras, O u C u = O l C l = f , where Ou and Ol are the origins of the two 2D image coordinates, one for the above and one for the lower, and f is the distance between the image plane and the lens center, and C u and C l are the lens centers for the upper and the lower cameras, respectively. In Figure 3-2, the projections of a point A = (0, Yc ,0 ) onto I u and I l , are Au and Al . Due to similarity between triangles △ PAC u and △ Pu Au C u , we have y u = Au Ou = f ⋅ OO u (Y − f ) , and similarly we have y l = Al Ol = f ⋅ OO l (Y − f ) , y u y l = OO u OOl . This implies that the y-direction offset of the projections in the two images will depend on the height of the two cameras.
(
ì
î
≤ X r < (c + 1) ⋅ w p ⋅
OO l , r ⋅ hp
(r + 1) ⋅ h p
c ⋅ wp ⋅
OO l OO l ≤ X r < (c + 1) ⋅ w p ⋅ , r ⋅ hp (r + 1) ⋅ h p
for X r ≥ 0
else. ( 3.1 )
We define the area of interest (AOI) in I d since we only care about pedestrians or vehicles on G that would be mapped to the AOI. Others are too far for us to recognize, and are less important than those in the AOI. The AOI is shown in Figure 3-2. Before tracking and matching a specific type of obstacle, we can first produce an appropriate obstacle map (OM) for it that only obstacles with some obstacle type-specific properties will be in the map. The obstacle map for pedestrians is called POM, whereas that for vehicles is called VOM. An obstacle map is a binary image as large as I lp . All pixels out of AOI in the map is set to black, and only obstacles with specific properties in AOI will be set to white. The procedural steps are: (1) Image Preprocessing: We should remove signals of difference which are too small in size and too small in value to avoid quantization error and digitizing error. And the pixels which are considered to be obstacles are set to be 255 in gray level, whereas the ground plane is set to be 0. (2) Obstacle Hypothesis: We assume each of the “on”(gray value = 255) pixels in I d represents that there is an obstacle of our interested type which stands on the ground plane. (3) Hypothesis Verification and Localization: Although the “on” pixels in I d are indeed produced by generic obstacles, we need to reduce the number of hypotheses to speed up our searching and tracking process. Since the bottom of an object often results in an edge, we first apply thinning operator to the “on” pixels and then only keep the
)
Property 3.3: If there is nothing on G, the lower half of I u can be zoomed in the Yu direction by a scalar c , c = OO l OOu , 0 < c ≤ 1 , such that the zoomed image is equal to the ( 0.5 ⋅ c ⋅ Im age Height ) rows start from Yl = 0 of I l . We call the zoomed I u referred in property 3.3 I us , and the respective equal part in I l I lp . The image I d is defined as the absolute difference between I us and I lp . Without losing generalities, any generic obstacle would result in its respective pixels in I d with large values. Because the row scaling value we take for G to coincide is not appropriate for parts higher than G, which is considered at a different plane. The respective scaling value for a specific height h is OO l − h OO u − h , not OO l OO u . This becomes the basic idea that we can
)(
OO l
c ⋅ wp ⋅
í
Property 3.2: For any point P ∈ G , P = X ,Y ,0 , where Y ≈ ∞ , the projections of P onto I u and I l , namely Pu = ( x u , y u ) and Pl = ( x l , y l ) , respectively, will fall on the center horizontal lines Yu = 0 and Yl = 0 , respectively. We call them “vanishing lines”.
(
( 3.0 )
)
2636
hM − HD ( A, B ) =
ρ ( D(a, B)) a∈ A
( 4.0 )
A two stage clustering strategy is used to construct the 4-level hierarchical database. Stored in it are binarized pedestrian contour images and some other necessary information that we will explain later. The inputs are hundreds of gray level single pedestrian images. These pedestrians wear roughly single color clothes since the texture of clothes is not a good feature to separate a pedestrian from the general surrounding environment, and it may deteriorate the matching accuracy in our method. In each image, the shape of a pedestrian and the high frequency elements like eyes, noses, and mouths are extracted by a Sobel edge detector. Two numbers h and w are taken in advance. Each edge image is scaled to let the height of the pedestrian be h, shifted horizontally to keep the pedestrian stay at the center of the image, and then cut to be h in height and w in width. We call the shifted one a normalized edge image. In the hierarchical pedestrian template database, a rule is obeyed that each descendant template is more similar to its parent template than any other templates in the same level with its parent. We select a predefined number of images to be the seed images for the first stage clustering. They are level 1 images in our hierarchical template database. Each of the level 1 images contains a walking or standing pedestrian viewed from a different viewpoint, including front, back, left, right, front-left, front-right, back-left, and back-right. Such a division can help us to track down a pedestrian we have found in the further processing. Other edge images are then separately assigned to the nearest cluster according to the minimum M-HD between the seed image of a cluster and the edge image we want to classify. The second stage occurs in the clusters we have constructed in the first stage. We apply GKA to each cluster with K = 8. The distance measure we use in GKA is again the M-HD. The centroid of a sub-division is a synthetic image, where each pixel value is the average of pixel values at the same location in all images that belong to this sub-division. We cannot directly use a centroid image to be a level 2 image since no edge pixel exists. Instead, we find an image nearest to the synthetic centroid image by the directed M-HD, hM − HD ( A, B ) , to be a level 2 image. This image is called the “physical centroid image” of the sub-division. The level 3 images are all the contour images. The parent image (level 2 image) of a level 3 image is the physical centroid of the sub-division to which this level 3 image belongs. On the other hand, we calculate an average image of the level 1 images, and then find the level 1 image nearest to the average image to be the level 0 image. For a pedestrian template in the database, we store not only the binarized edge image (template image) but a matching threshold of it for the matching purpose Assume the maximal M-HD value between the template image Ti
Id
Road
Figure 3-2 Area of Interest: The dotted rectangle area is I d , and we defined the AOI as the two rectangle shade areas. pixels that its respective pixels in the upper and lower images are both edges. After that, we can use the image coordinate of the “on” pixel to approximate the location of the obstacle. It is done by finding the respective ranges in the x and y coordinates on the map. We will send the respective obstacle maps to the pedestrian tracking process and the vehicle tracking process separately. Either of the tracking processes will remove the obstacles which are successfully tracked from the respective obstacle map. The rest of the map is sent to the searching process to find new obstacles. After such a localization procedure, if a hypothesis is verified by the following tracking or searching processes, Obstacle we can solve the transformation TCamera (t ) for the obstacle. Therefore, the location problem is implicitly resolved in the detection process.
4. Pedestrian Matching Template Construction In this paper, we use template matching for pedestrian searching. A large pedestrian template data set is obtained. It consists of faces and shapes of pedestrians with various clothes, sexes, and motions. The searching process becomes a problem whose objective is to find a template which is sufficiently similar to the tested image. To construct the database structurally, we use GKA [12] to obtain a near optimal clustering result. We select a variation of the Hausdorff distance, the M-HD [11], to be our distance measure, i.e., dissimilarity measure for the pedestrian templates. M-HD replaces the Euclidean distance by the cost function that can eliminate outliers and occlusion problems. The cost function ρ is defined as:
ì x, x ≤τ ρ ( x) = í τ, x >τ
1 NA
( 4.0 )
where τ is a threshold value. On the other hand, the directed Hausdorff distance based on M-estimation is defined as:
2637
and all other the same level template images having the i same parent (level number – 1) is d level , a matching i threshold value ε is calculated depending on one of the two types of location the template image is in the database: 1) If the template image is a leaf image (level 3) in the i database, ε i = d level . 2) If the template image is an internal image belonging to level l in the database, ε i is defined as: ε i = max M - HD (i, j) + ε j ∀T j ∈ Ti ' s child, T j ∈ level 3 .
(
)
5. Searching and Tracking of Movable Obstacles
The scaled height of the template image is hs , and the three stored parameters x ll , x l , and w p becomes xlls , xls , and w ps in the scaled template image. We will use the w ps × hs rectangle Rst with its lower left pixel coincident with ( xls , hs ) to be our matching area. b) Define the area to be matched in I l _ bin as the w ps × hs rectangle Rob , where the lower left pixel of the rectangle is ( x − ( xlls − xls ), y ) . c) Calculate the directed M-HD, hM − HD ( Rst , Rob ) , to be the dissimilarity measure. If the dissimilarity measure is i less than ε × s , the measure is saved and the template image matching is considered to be passed. We proceed our matching with all the same level template images, and then choose the most similar template image Ti among the passed ones. Such a process will be applied to all the next level images belonging to Ti . If no template is passed at the same level, the matching process for this pixel fails and stops so that RPOM(x,y) will be marked black. If a level 3 template matching is passed, we believe that there is a pedestrian with this template shape standing there. The whole pedestrian area in RPOM will then be set black to avoid duplicate matching. A best first search without backtracking should be effective if the pedestrian templates we take distribute averagely. The reason why we just use the directed version of the M-HD is that our goal is to check if a pedestrian similar to the template is in the image, but the distance measure of the other direction may include the information about dissimilarity between non-pedestrian edges in the environment and our template image so that an unreasonable large amount of undirected M-HD occurs. (5) Parameter Creation for Pedestrian Tracking: If a pedestrian is matched at RPOM(x,y), we add a new pedestrian tracking data node to the pedestrian found list. It means that we have found a new pedestrian and will track him subsequently. In the data node, the location Pedestrian TVehicle (t ) transferred from RPOM(x,y) and the gray level image in Rob area of I l , which includes the pedestrian shape, are saved. In the tracking stage, assume that the time period of our pedestrian detecting-tracking-searching cycle is a constant, and we use the period to be our unit of time. Let a POM be produced at time t, then it is first sent to the tracking process. We track each found pedestrians node by node in the pedestrian found list, and use POM to speed up our tracking. An inverse array is produced to indicate that Pedestrian if we know the location of the pedestrian TVehicle (t ) , where should the feet of the pedestrian appear in the lower image I l . Another assumption is that the motion of a pedestrian is relatively slow and steady in the sequence of images. We can then estimate the location of a found pedestrian at time t by extrapolating. However, we don’t have enough data to extrapolate for a pedestrian we have just found at t-1. If the pedestrian is stationary, the processing steps described above are still
Pedestrian Searching and Tracking In the searching process, a new pedestrian in the input image should be matched against a template in our hierarchical template database. All generic obstacles that might be pedestrians have been extracted and the related information is stored in the pedestrian obstacle map during the obstacle detection stage. The pedestrian obstacle map is first sent to the tracking process to remove the already found pedestrians. The rest of the map will contain the candidates of new pedestrians, and is the so-called a “residual pedestrian obstacle map”(RPOM). We will use it for the guidance of our subsequent pedestrian searching process. Before matching, a scaling table scale(y) refers to the scaling factor we should apply to our pedestrian templates for matching a pedestrian whose feet is in the input image. It is constructed by the unified height of our pedestrian templates in the previous section, and the fixed camera configuration parameters. The matching process consists of edge detection, Hausdorff distance transform, location determination, hierarchical template matching, and parameter creation for a pedestrian. We now describe them in detail. (1) Edge Detection: We use the lower image I l to be our source image for matching. A Sobel edge detector is performed on I l to extract edge pixels, and the resulting image is I l _ bin (2) Hausdorff Distance Transform: Like the pedestrian template database construction, we use M-HD to be our distance measure, and construct the distance transform ∆[x, y ] for I l _ bin (x, y ) by the chamfer method. (3) Location Determination: Consider all the obstacle pixels in RPOM to be P. For a pixel RPOM (x, y ) ∈ P , assume that it indicates a pedestrian standing there. The location of the pedestrian can be determined by the two distance map Distc ( x ) and Distr ( y ) as described in Chapter 3, and then a scaling factor for our pedestrian templates, s, is extracted by the scaling table scale(y). (4) Hierarchical Template Matching: We start our hierarchical template matching from the root template image. For each matching template image, we perform the following three steps: a) Scale the template image by s in height and in width.
2638
available for this case. Unfortunately, if the pedestrian is actually moving, the applied tracking area does not work. We then use the routing direction of the matching template image we got in the searching process to extrapolate the location of the pedestrian. The extrapolating values of x and y coordinates depend on two things: A predefined distance that an average pedestrian will move in our time unit, and the routing direction. The correlation-based matching is again applied to the newly estimated area for tracking.
when the warning system sends out a message, the total stopping process distance becomes: Total Stopping Distance = Warning System Distance +
2 × Perception Distance + Reaction Distance + Braking Distance where we defined the warning system time is the time period during which the warning system completes an obstacle detection-recognition-warning cycle. The warning system distance is the distance the vehicle traverses during the warning system time. We count the perception distance twice in the above equation because our warning message is also a perceptional signal to human. After the driver receives the massage he will start the normal stopping process. Assume the acceleration of the vehicle is ac = −2.5 m s 2 , which is typical for strong braking and good weather [13], and the perception time as well as the reaction time are both 0.75 seconds, the total stopping distance for an effective obstacle warning system is: Vi × (warning system time + 2.25 + Vi 5) . However, if the obstacle is moving, the equation should include the consideration of velocity of the obstacle. The term Vi becomes the relative velocity between our vehicle and the obstacle in our moving direction.
Vehicle Searching and Tracking Unlike pedestrians, the shapes of vehicles are simpler to describe since they are rigid bodies. Although the Hausdorff distance can also be used for vehicle matching, we employ an easier and fast method based on sign pattern (SP) [4] for vehicle searching to exploit the advantage of fixed shapes. The SP of vehicle is dark underneath. It is observed that the underneath of a vehicle is obviously darker than shaded parts of the road. The complete inductions can be found in [4]. In the paper, vehicles need not to be moving since we detect them in a different manner to the work done in [4]. Another important difference between our work and the original SP based vehicle detecting algorithm lies in the tracking stage. They still apply the underneath window method shifting to the lower side of the image for an incoming vehicle, and then use the same searching routines for vehicle tracking. However, if the tracking speed of our system turns out to be slow relative to the vehicle, the method will make a mistake since it only detects the existence of a vehicle without checking the similarity between the two vehicles obtained in the sequent images. To avoid this, we choose the Kalman filter to estimate the dynamic parameters of the vehicle and then apply a correlation based matching to verify that the vehicle we have tracked is indeed the one we want.
6. Experiment The sequence of images for our experiments are taken from two SONY DCR PC-100 digital video cameras (DV). The Matrox Image Library (MIL) 6.01 is used to develop our whole program. The system runs on a PC with an Intel Pentium II 450MHz CPU and 256MB RAM. To construct the pedestrian template database, we still use a DV to capture a series of pedestrian motion sequences. These sequences include pedestrians of different sexes and in different dresses. We choose the proper images from the continuous sequences to be our source pedestrian shape images, and about 1,000 images are saved. In this research, we have just used 562 images to construct the basic structure of our hierarchical pedestrian template database. Any other pedestrian shape image can be added to the database later by searching for the most similar level 2 image in the constructed hierarchical structure and then appending it to the database as a level 3 image. Figure 6-1 shows the different stage images which will be produced during the database construction process for an input pedestrian shape image.
System Speed Requirement Generally speaking, a complete braking process includes three stages: perception, reaction, and braking [14]. In each stage, some time is consumed, and the vehicle keeps moving until the braking stage is complete. So the total stopping distance is:
Total Stopping Distance = Perception Distance + Reaction Distance + Braking Distance The fateful case is that the driver does not see an existent obstacle, or fails keep enough safe distance to stop when he or she has perceived the obstacle existence. An obstacle warning system for vehicle driving should be able to send a message by text, voice, or light to assure that the driver must get the message and have enough distance to complete the stopping process. In the worst case where the driver always takes a look in front of the vehicle only
Original
Edge
Normalized Edge
DT
Figure 6-1 Different Images for a Pedestrian template In our system configuration, one digital video camera
2639
We demonstrate our pedestrian matching result in Figure 6-4. The pedestrian is detected and bounded by a rectangle. A simple scene can inspire us to enlarge the threshold values for each node in the hierarchical database to accept a pedestrian more easily, and then he or she can be tracked in the following sequences. But if the scene is too complex, a tradeoff between the rate of false alarm and that of miss detection appears, we have to follow a strict version of the threshold values to insure the most probability of which the matched ones are indeed pedestrians. On the other hand, the vehicle searching cycle is about 330ms~660ms, and the miss rate is about 17%.
Scaling Subtract
Figure 6-2 The Original Input Image Pair and the Respective Subtraction Result
Figure 6-4 Pedestrian Matching and Tracking
7. Conclusion Figure 6-3 Obstacle Map is put at a height of 85cm, and the other is put at a height of 170cm. The compression factor for the upper image is then 85 / 170 = 0.5 , and the effective range of the overall system is 9m ~ ∞ . In Figure 6-2, the original two images grabbed from the upper and lower digital video cameras and the resulting image after subtraction are shown. We can find that only the objects higher than the ground plane will result in a large difference value. However, the nearest lane mark also makes a large difference blob because the degrees of vibration of the two digital video cameras are not the same. The nearer the landmark is, the greater the effect takes. After taking our assumption selection operator, we can compare the actual obstacle map we produced in Figure 6-3 with the original version in Figure 6-2. Only the foot points of the obstacles will remain, and the further processing steps can take only those pixels for some complex operations. The time for image compression and subtraction is about 10ms in our system, whereas the hypothesis verification operator takes about 60ms. If we only apply the pedestrian matching process in our system, the pedestrians are indeed detected in the scene, but it requires about 1 to 3 seconds to complete. On the other hand, the performance of which after the tracking process is added in depends on the proportion of the tracked points to the whole obstacle points in the obstacle map. If the portion of the tracked point in the obstacle map is small, we can hope small advantage from the tracking process since the matching process still need much time to check for new pedestrians. However, if the number of obstacles in front of our vehicle is not large, the tracking process may helps us bypass this time consuming operation because most of the obstacle points in the obstacle map are deleted by it. In our experiment, the tracking process can even shorten our tracking-matching cycle to 690ms, and the miss rate is 15%.
In this paper, an obstacle detection and recognition system for vehicle driving based on computer vision is proposed. We have developed a complete mechanism including obstacle detection, pedestrian matching and tracking, vehicle searching and tracking, and warning signal sending decision. A fast generic obstacle detection method by the simplified stereovision is presented. Any existing algorithm for obstacle recognition, no matter it bases on computer vision or not, can be speeded up by our method to minimize the number of recognition candidates in the environment. On the other hand, for our own system, although the obstacles we processed are just pedestrians and vehicles, a searching and tracking algorithm for any other kind of obstacles can be developed on the established detection base and then concentrate ourselves on processing the features of such kind of obstacles. Even we can reduce the obstacle map by the features if it is fast enough to get the feature information from the upper and lower images. To avoid time-consuming matching for complex human models, we choose the M-estimation Hausdorff distance as our dissimilarity measure. It uses the shape of an object as the matching feature, and provides a smoother matching score to adapt the variability of pedestrians. A hierarchical template database is used in this paper. We construct the database not only for speeding up our matching process, but also for the pedestrian moving direction prediction in the tracking process. We have also presented a meaningful matching threshold setting strategy for each node in the hierarchical template database which satisfies the coarse to fine property when matching. Although the processing speed now is not fast enough to meet the requirement of real driving, some heuristics may be added into our system to obtain a better
2640
International Road Signs And Conventions. [14] http://www.ganet.org/dps/gcdl/2-6.htm, State of Georgia, Department of Public Safety.
performance in the real world. On the other hand, since the tracking process has some chases of speeding up the searching process, a more efficient tracking method for a movable observer and movable obstacles may be helpful. Due to the objective obstacles we have processed in this paper are the most complex and movable ones, other obstacles should be able to be recognized in some simpler manner which costs a shorter processing cycle time in our system.
Reference [1] S. Badal, S. Ravela, B. Draper, and A. Hanson, “A practical obstacle detection and avoidance system Applications of Computer Vision,” Applications of Computer Vision, 1994., Proceedings of the Second IEEE Workshop on , 1994 , pp. 97 -104. [2] M. Bertozzi, and A. Broggi, “GOLD: a parallel real-time stereo vision system for generic obstacle and lane detection,” Image Processing, IEEE Transactions on, Vol. 7 1, Jan. 1998, pp. 62-81. [3] Q.-T. Luong, J. Weber, D. Koller, and J. Malik, “An integrated stereo-based approach to automatic vehicle guidance,” Computer Vision, 1995. Proceedings., Fifth International Conference on , 1995 , pp. 52-57. [4] H. Mori, N. M. Charkari, and T. Matsushita, “On-line vehicle and pedestrian detections based on sign pattern,” Industrial Electronics, IEEE Transactions on, Vol. 41 4, Aug. 1994, pp. 384-391. [5] D. P. Huttenlocher, G. A. Klanderman, and W. J. Rucklidge, “Comparing images using the Hausdorff distance,” Pattern Analysis and Machine Intelligence, IEEE Transactions on, Vol. 15 9, Sept. 1993, pp. 850 -863. [6] C. F. Olson, D. P. Huttenlocher, “Automatic target recognition by matching oriented edge pixels,” Vol. 6 1, Jan. 1997, pp. 103-113. [7] D. M. Gavrila, and V. Philomin, “Real-time object detection for "smart" vehicles,” Computer Vision, 1999. The Proceedings of the Seventh IEEE International Conference on, Vol. 1, 1999, pp. 87 -93 vol.1. [8] D. Wetzel, H. Niemann, and S. Richter, “A robust cognitive approach to traffic scene analysis,” Applications of Computer Vision, 1994., Proceedings of the Second IEEE Workshop on, 1994 , pp. 65-72. [9] T. N. Tan, K. D. Baker, and G. D. Sullivan, “Model-independent recovery of object orientations,” Robotics and Automation, IEEE Transactions on, Vol. 13 4, Aug. 1997, pp. 602-606. [10] Dong-Gyu Sim, Oh-Kyu Kwon, and Rae-Hong Park, “Object matching algorithms using robust Hausdorff distance measures,” Image Processing, IEEE Transactions on, Vol. 8 3, March 1999, pp. 425 -429. [11] W. Rucklidge, Efficient Visual Recognition Using the Hausdorff Distance, Springer-Verlag, 1996. [12] K. Krishna, and M. Narasimha Murty, “Genetic K-Means algorithm,” Systems, Man and Cybernetics, Part B, IEEE Transactions on, Vol. 29 3, June 1999, pp. 433 -439. [13] http://www.travlang.com /signs/index.html, European
2641