Computing-Kernels Performance Prediction Using Dataflow Analysis and Microbenchmarking Eric Petit, Pablo De Oliveira Castro Herrero, Tarek Menouer, Bettina Krammer, Jalby William
To cite this version: Eric Petit, Pablo De Oliveira Castro Herrero, Tarek Menouer, Bettina Krammer, Jalby William. Computing-Kernels Performance Prediction Using Dataflow Analysis and Microbenchmarking. 16th Workshop on Compilers for Parallel Computing (CPC 2012), Jan 2012, Padova, Italy.
HAL Id: hal-00699525 https://hal.archives-ouvertes.fr/hal-00699525 Submitted on 21 May 2012
HAL is a multi-disciplinary open access archive for the deposit and dissemination of scientific research documents, whether they are published or not. The documents may come from teaching and research institutions in France or abroad, or from public or private research centers.
L’archive ouverte pluridisciplinaire HAL, est destin´ee au d´epˆot et `a la diffusion de documents scientifiques de niveau recherche, publi´es ou non, ´emanant des ´etablissements d’enseignement et de recherche fran¸cais ou ´etrangers, des laboratoires publics ou priv´es.
Computing-Kernels Performance Prediction Using data flow Analysis and Microbenchmarking Eric Petit1 , Pablo de Oliveira Castro2 , Tarek Menouer2 , Bettina Krammer1 , and William Jalby1 1
LRC ITACA, University of Versailles - UVSQ, France
[email protected] 2 Exascale Computing Research - ECR, France
[email protected]
Abstract. On modern multi-core processors, the growing gap between memory size, bandwidth and latency compared to computing capability makes the memory hierarchy predominant for performance. The Microkernel-Description-Language based Performance Evaluation Framework, MDL-PEF, accurately predicts optimized inner-loops performance depending on the loop’s data access. The MDL-PEF approach revolves around a data flow description language, MDL. A static analysis step extracts the data flow structures of the assembly code. Then the predictor uses pattern matching against an MDL-Microkernel database for predicting performance. Finally, MDL-PEF provides an automatic tool to initialize a pattern matching database for the target architecture. The overall system can predict the kernel performance on different platforms and optimizations, helping the user choose the best architecture for a given kernel. Preliminary experiments, with a 56 elements database, predict the innermost loop throughput of 636 binary loops of the NAS benchmarks with an average 10% of relative error. The performance predictor is part of the Modular Assembly Quality Analyzer and Optimizer (MAQAO) performance tool framework. Future works will extend MDLPEF to other architecture paradigms and more complex control flows such as outer loops. Keywords: Performance analysis, Performance prediction, Dataflow, Microbenchmarking
1
Introduction
New architectures use an increasing number of cores, more complex hardware mechanisms for performance, and wider memory hierarchy. The growing complexity of the system makes their performance fuzzier, to the extent where building accurate analytical models is not possible anymore. Furthermore, to build empirical models, exhaustive approaches are not realistic. Manual or compiler optimizations require a cost model and performance analyzer to drive the process. Cost models predict where to apply the optimizations
and their potential efficiency; performance analysis quantifies their impact. Optimizing is a costly and error prone iterative-process which must converge as fast as possible. Therefore, both the performance model and analysis need to be accurate. To tackle the emerging challenge of performance analysis on complex manycore systems, we propose a new approach based on micro-benchmarking and pattern matching. To be more precise, the remainder of the article will use the three following definitions: – MDL-Kernel: code snippet abstraction from an external application and candidate for matching against micro-kernels (µKernels), – µKernel : atomic element of an MDL-Kernel representing a single connected dependency graph, – Micro-benchmark: machine specific code fragment instantiating a particular µKernel which MDL-PEF benchmarks to build the matching database. Since the gap between memory and flops bandwidth in modern architectures is getting wider and wider, we base our approach on the following assumption: memory access patterns dominate performance when the accessed memory is far from the CPU. Therefore, at the core of the MDL-PEF framework is a data flow description language, MDL, which models memory access performance. The framework addresses three different issues: 1. Code abstraction: An application’s code snippet is broken down into a set of independent µKernels. Each µKernel conveys the data flow and arithmetic intensity characteristics of a small code segment. 2. Pattern matching: MDL-PEF matches newly extracted µKernels against a database of existing µKernels with known performance. By identifying similar µKernels in the database it predicts the performance. 3. Micro-Benchmark code generation: To initialize the database, MDL-PEF measures a set of seed µKernels on different platforms and execution contexts. From each abstract MDL kernel, MDL-PEF generates many concrete machine specific binaries, called micro-benchmarks. Instantiated microbenchmarks have explicit addressing, operations, loop trip, and scheduling. New hardware or software developments provide new optimization opportunities and can make older design choices obsolete or even counter productive, especially when dealing with legacy applications, in HPC or in embedded systems. In this context, MDL-PEF is useful in two ways: 1. Code optimization (a) Performance debugging: an application segment’s performance being far from what is expected is a performance bug. MDL-PEF spots performance bugs by predicting the expected performance of the kernel and comparing it to the measured performance. (b) Identify code segments with high potential for optimization: MDL-PEF can predict when it is possible to perform the same data flow pattern with better performance. Examples include using a different architecture
or applying new optimizations: unrolling, blocking, loop splitting, loop interchange, etc. MDF-PEF measures the potential return on investment of the proposed optimizations. 2. Hardware-software co-design either in HPC or embedded systems (a) Extract from a whole application the set of abstract µKernels used in loops: Instead of executing the whole application, MDL-PEF benchmarks and tunes the loops one by one. (b) Help tune the optimizing compiler on the target system while determining the best performing optimizations and their parameters on a set of representative benchmarks. The remainder of this article is organized as follows. Section 2 presents related works. Section 3 details the design of MDL-PEF: it describes the MDL grammar, how to extract the MDL representation of a code segment, and how to use pattern matching on MDL. Section 4 exposes the specific algorithms used for implementing micro-benchmarks code generation during the µKernel concretization step. Section 5 presents first experiments, with a case study and preliminary results on NAS parallel benchmarks. Section 6 concludes and gives an outlook on future works.
2
Related Works
There are two main families of performance analysis tools: dynamic and static ones. Dynamic analysis tools, like gprof [1], Scalasca [2], TAU [3], Intel Vtune, or Likwid [4], analyze the live execution of a program, based on the execution trace or hardware-counter-based profile, and help users spot the performance bottlenecks. Their results are deeply linked to compiler, execution context, system, and processor. They perform on-site specific code quality measurement, optimizations and hotspots detection. Other dynamic tools, like Perpi [5] or Acumem [6], are independent of the target system since they use architectureindependent interpretation models of the trace. Static analysis tools, like MAQAO [7], Salto [8] or Intel IACA, determine the potential lower-bound of application performance based on a static model. They compute their output with various metrics such as estimated floating-point operation count, estimated data flow analysis, estimated number of live variables, register count, etc. The static tools are language and compiler dependent. They are useful for analyzing and optimizing the code quality produced by a compiler. MDL-PEF uses fine grain static analysis based on the MAQAO [7] framework to construct the MDL-Kernels and it optionally uses the dynamic profile to specialize the prediction context. The basic usage helps to determine and quantify the potential optimizations to apply at loop level. Furthermore, during the abstraction process, it extracts new static metrics about the code characteristic and the compiler work quality. All optimization work starts with the kernel-to-optimize detection and extraction. ASTEX [9] is an existing source-level approach based on application
instrumentation and profiling. Avoiding full-scale application execution is a necessity to make iterative optimization possible. The objective is to specialize the code generation and optimization for the hotspot using complex and costly approaches. MDL-PEF offers such a possibility with MDL concretization and replay in the micro-benchmark framework. Since the MDL-PEF replay the compiler-optimized kernel, it does not influence the process from the source code to the optimized binary. Contrary to ASTEX, MDL-PEF does not yet capture the real application working-set. The finality of performance analysis is performance optimization. The collected metrics and performance properties need a translation into hardware or software optimizations. Performance prediction and cost model can help to explore the design space, as done in SPIRAL[10] for signal applications. Some approaches base their predictions on a theoretical and empirical model. For instance, the Acumem Threadspotter [6] tool varies the cache parameters, such as associativity and size. By replaying the sample trace with new parameters, it characterizes the cache effect in single and multi-core execution. Other approaches use an adaptive model based on machine learning, collecting data from experiments and predicting the set of design properties based on similarities with known results. GCC milepost [11], for instance, measures the relation between compiler flags and performance for several codes. Based on syntactic similarities, it predicts the flags to use for a new input. Its drawback is to be a blind optimizer: it optimizes, but does not explain why the optimizations are successful. MDL-PEF explores both approaches, respectively for performance prediction and affinity between architecture and kernel. Contrary to GCC milepost [11], and similarly to XARK [12], the MDL-PEF metrics computation and pattern matching approach is based on semantic features, mostly related to polyhedral model. Thanks to code abstraction, MDL-PEF uses a reduced database of microbenchmarks compared to [11]. Therefore, there is no large system requirement and the MDL-PEF pattern matching is much cheaper.
3
Design of MDL-PEF
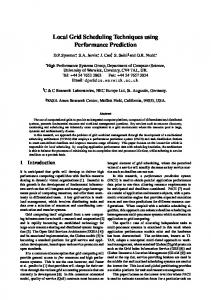
This section describes the Microkernel Description Language Performance Evaluation Framework. Figure 1 represents a schematic view of the framework. The figure can be read from two different points of view: 1. Daily user : the framework’s input is an application code snippet. The framework abstracts the input into the MDL language, described in section 3.1. Then it refines the raw MDL description to its canonical form using the algorithm of section 4.1. The canonical MDL form is then matched against the MDL-µKernels database using the k-NN algorithm of section 4.2. The framework predicts the best performance and the best optimization using the information from the closest neighbors. 2. Tool provider or database builder : MDL-PEF relies on performance results in its MDL-µKernels database. To fill it, MDL-PEF prepares concretized
OUT
Normalization ISA Abstraction
IN Binaries / Assembly / Source
Concretize
Performance Prediction on Various Targets
Pattern Matching
...
µKernel n #best unroll factor #input streams and size #output streams and size #add and #mul
Performance Issue
MDL-Kernel
-Perf L1 -Perf L2 -Perf L3 -Perf RAM
MicroBenchmark generator
µKernel2
µKernel1
MDL Database Execution Engine
Fig. 1: The MDL-PEF organization
versions of the database µKernels to run through a micro-benchmarking tool such as MicroTools or Likwid [4]. Section 4.3 describes this process. The two previous utilizations are grouped in one single framework presenting two concepts: the MDL language described in section 3.1 and the framework, PEF, described in section 4. 3.1
Microkernel Description Language
The intuition behind MDL’s abstraction is that, whatever the implementation of a kernel is, it will always use the same number of input and output data flows to compute a result-element. For instance, a Finite Impulse Response (FIR) filter is composed of one input data flow, reading N elements backwards, and one output data flow writing one output element. The description does not change after applying compiler optimizations. What makes a difference for the stencil, with unrolling for instance, is the flop/byte metrics. Thus, MDL description language focuses on the access pattern and arithmetic intensity description. The following guidelines lead the MDL design: – The abstraction should allow efficient pattern matching and be abstract enough so that similar programs share the same MDL representation. In addition, the number of MDL seeds in the database should be reduced to the minimum to reduce matching complexity. Therefore, complex patterns should be broken into combinations of simpler patterns using the same memory stream. – The language should be architecture independent. A machine description file is used at the concretization step to produce micro-benchmarks. This file
hides the architecture specifics, such as Instruction Set Architecture’s (ISA), type sizing, register mapping, from the MDL abstraction. 3.2
MDL Kernel Description
An MDL-kernel description is composed of three parts: meta-data, data and body. The meta-data part describes all the associated metrics embodied in the MDL description, but not related to the abstract data flow pattern. It captures information specific to the original code implementation of the kernel such as unrolling factor, spill-fill, loop bounds, and array physical addresses. The metrics are produced either by the static analysis, a dynamic profiling, or any external tool. The data section contains the set of variables describing the working set of the benchmark code such as memory streams identifier, strides value, offsets value, and immediate values. Finally, the body describes the abstract data flow accesses of the kernel and the arithmetic intensity. The full grammar of the body follows: hloopi ::= houter loopi | hinner loopi houter loopi ::= ’Trip:’.hexpr i.’I/O:’.hInOuti.’LoopBody:’.(hflow bindingi)*.hloopi) hinner loopi ::= ’Trip:’.hexpr i.’I/O:’.hInOuti.’LoopBody:’.hukernelsi. hInOuti ::= ’In:’ (hflow i.hexpr i.)* . ’Out:’ (hflow i.hexpr i)* hflow bindingi ::= hfixedi | hstridedi | hswitchi hfixedi ::= ’fixed ’ hflow i hstridedi ::= ’strided ’.hflow i.hexpr i hswitchi ::= ’switch’.hflow i.’in’.hflow i* hexpr i ::= (hvaluei|’(’.hexpr i.’)’).((’+’|’-’|’*’|’mod’|’div’).(hvaluei|’(’.hexpr i.’)’))* hukernelsi ::= hukerneli* hukerneli ::= hmem accessi*.harithi hmem accessi ::= (hflow i.’Stride:’.hvaluei.’Offset:’.hvaluei.’Size:’.hvaluei)* harithi ::= (’Add:’.hvaluei.’Mul:’.hvaluei) | AST hflow i ::= stream identifier hvaluei ::= integer | scalar identifier
The terminal elements of the grammar are of two kinds: integer immediate values and identifiers for flow and scalar parameters declared in the data section. The body description starts with the outermost loops expression. For each loop level, the description contains a loop trip count variable and the list of the polyhedric expression of the in and out accesses. They are computed from the current level code and the lower-level loop-components in and out expression. Then, it contains a list of the next level loop. The inner loop description is the lowest loop level; it contains a list of µKernels instead of a lower loop-level list. Each µKernel is built from memory accesses description and arithmetic characterization. Currently, we only consider the arithmetic intensity for addition and multiplication. The current assembly abstraction is limited to the innermost loop expression. We are also not considering indirect accesses, conditional branching, and irreducible loops. Since our first target result is the asymptotic innermost and branch-free loop body throughput prediction for MAQAO [7] in L2, L3, and RAM memory level, the current limitations have no significant impact.
Access duplication
Spill-fill detection and removal
DDG connected subgraph detection
MDL µKernels fomation
MDL Kernel
µKernel n #unroll factor #spill-fill #flop/byte #add/mul ratio
Renaming
MDL access coalescing
...
µKernel2 #unroll factor #spill-fill #flop/byte #add/mul ratio
Asm or binary kernel MDL rerolling
ASM/ IR
MDL
µKernel1 #unroll factor #spill-fill #flop/byte #add/mul ratio
Fig. 2: The MDL kernel computation pipeline
4
Implementation of MDL-PEF
This section describes the PEF prototype implementing the pattern matching and replay features. As described before, the PEF pipeline has three steps: normalization of the µKernels to their canonical form, pattern matching and concretization of the µKernels for replay. 4.1
MDL-Kernel Construction and Normalization
Figure 2 shows the full MDL-kernel construction from the asssembly and normalization process. It removes ISA artificial limitations to get a canonical data flow representation which assumes an unlimited number of registers, arbitrarily large memory moves, and is identical for different unroll factors. First, MDL-PEF renames registers assuming a virtual infinite number of registers and removes obsolete spill-fill code abstracting the code from any register pressure impact. During this process, to clearly separate the memory and arithmetic streams, the instructions combining arithmetic and memory access, are fissed. Then the modified assembly code segment is broken into elementary and independent µKernels. Compiler unrolled code makes this process difficult, because unrolling factorizes instructions from different iterations. To reconstruct the original instruction stream, all the factorized memory accesses are fissed. After this process, every connected sub-graph of the Data Dependency Graph (DDG) represents a separate computation segment and Tarjan’s connected components algorithm [13] extracts the set of µKernels. Next, memory coalescing abstracts the access instruction size limitations of the ISA, by fusing contiguous memory accesses. The MDL language considers an ideal memory access with arbitrarily large memory stores or loads. The final
step is re-rolling. µKernels that are unrolled instances of the same code segment will have a unique canonical representation after this step. Normalization removes ISA and compiler side effects from the MDL representation, to avoid hindering the pattern matching with such effects. During the whole process, PEF extracts related static metrics for each µKernel: the unrollfactor, the spill-fill, the flop per byte and the ADD per MUL ratio. 4.2
MDL Pattern Matching
The MDL-PEF approach for pattern matching is based on the k-Nearest Neighbor [14], k-NN, algorithm. The µKernel studied and each seed in the database are tagged with a feature vector. In the MDL context, feature vectors are built from five metrics: the load per stream, the store per stream, the number of streams, the ADD number, and the MUL number. In Section 5 we will show empirically that these metrics work well for the Nehalem x86 architecture. More complex feature vectors capturing the structural matches between different data flows will be studied in future. The algorithm finds the closest k seeds to the studied µKernel and predicts its performance by combining the closest seeds’ performance. We iteratively apply the following algorithm: find the closest neighbor, scale it to minimize the distance, add the scaled performance to the accumulator, substract (saturated arithmetic) the scaled feature from the target vector, loop until target vector is null. Then the algorithm searches for next order performance prediction. Therefore, the closest neighbor has the higher impact on the result. The k-NN approach works well when predicting a single µKernel’s performance. In cases where multiple µKernels interact, it is not clear how to combine their individual predictions for the whole application’s performance prediction. The problem is difficult because multiple µKernels performance is rarely additive [15]. Indeed, an out-of-order machine can overlap the work as long as the superscalar resources are not saturated and the access overhead in higher memory hierarchy benefits from the pipelining effect. 4.3
MDL Concretization: x86 Binary Generation
Concretization produces many binary versions from a single MDL seed to explore performance and optimization trade-offs. Concretization can be used in two ways: 1. Replay mode: Replay a specific µKernel with different parameters to precisely explore performance trade-offs. 2. Populate the database with performance and optimization information: Concretization can help explore the unroll factor, best amount of thread-parallelism, most efficient blocking size, etc. The database concretization should provide accurate lower-bound throughput performance to reveal the optimization potential, whereas the replay concretization must measure real performance accurately. Therefore the replay does
not normalize the µKernel to preserve the original code dependencies, aliases and alignment issues. Concretization is performed in three stages: 1. Choose assembly instructions to execute the kernel. For memory instructions, the selection policy is to maximize vector-load instructions, to produce quality vectorized code. For arithmetic instructions, current Intel x86 Nehalem architectures are able to dispatch one vectorized ADD and MUL per cycle. By avoiding clusters of ADD and MUL instructions, Algorithm 1 produces balanced schedules which maximize Instruction-Level Parallelism (ILP). 2. Schedule memory and arithmetic instructions streams together. Algorithm 2 ensures that flow dependencies between memory and arithmetic are satisfied. Therefore, each bundle is composed of a load section, an arithmetic section, and a final store section. The bundle scheduling granularity can be tuned with the nb bundles parameter in algorithm 2. The coarsest granularity is composed of only one large bundle; the finest granularity is composed of small interleaved bundles. The scheduler is able to produce all the intermediate granularity schedulings. Figure 3 shows schedules of different granularities, from one to three bundles. 3. Allocate the physical registers. Algorithm 3 is our register allocator. It is a modified round robin register allocation which minimizes registers’ dependencies and maximizes the distance between definition and store in the same register. It is important to note the register allocator breaks the semantics of the original kernel assembly to be as performance-neutral as possible during the allocation. MDL’s register allocation allows studying the performance of a code without worrying about register dependencies slow-downs. Finally, MDL sends the assembly produced to an external tool, the MicroTools framework, which handles memory allocation, initialization, time measurement and the loop trip count.
5
Preliminary Experiments
This section presents preliminary experiments validating the MDL-PEF concept and prototype implementation. Section 5.1 explores the characterization of the OpenMP NAS 3.0 and the MDL database. It shows that the feature vector’s distribution in the database is compatible with the feature vector’s distribution in the OpenMP NAS 3.0 benchmarks [16]. Section 5.2 analyses PEF’s prediction accuracy on NAS benchmarks. The section focuses on lower-bound performance estimation and across-architecture performance prediction. 5.1
Database Generation
The prototype database contains 56 seed µKernels distributed as follows:
Require: int nbadd , nbmul nbf op ← nbmul + nbadd minop ← min(nbmul , nbadd ) if minop 6= 0 then ratio ← nbf op ÷ minop ratiomul ← ratioadd ← 1 if nbmul ≥ nbadd then ratiomul ← ratio else ratioadd ← ratio end if while nbmul and nbadd do print ratiomul ∗ mul print ratioadd ∗ add nbmul ← nbmul − ratiomul nbadd ← nbadd − ratioadd end while end if print nbmul ∗ mul + nbadd ∗ add
Algorithm 1: Arith pre sched Require: Stream input lastreg = −1 reglast def [7] = 0 while currline == input.getLine() do if isLoad(currline ) then lastreg = (lastreg + 1)%8 insert load(lastreg ) reglast def [lastreg ] = currline .id else if isArith(currline ) then f irstreg = (lastreg + 1)%8 lastreg = (lastreg + 2)%8 insert arith(f irstreg , lastreg ) reglast def [lastreg ] = currline .id else if isStore(currline ) then lastreg = search older(reglast def ) insert store(lastreg ) end if end while
Algorithm 3: Neutral alloc
Require: Dbundle , nload , nstore , nadd , nmul f oplist ← Arith − pre − sched(nbadd , nbstore ) Nbundle ← min(Dbundle , nload , nstore , nadd + nmul ) nf op per bundle ← f op/Nbundle nload per bundle ← nload /Nbundle nstore per bundle ← nstore /Nbundle while i < N bbundle − 1 do print Nload per bundle ∗ load print Nf op per bundle ∗ get line(f oplist ) print Nstore per bundle ∗ store end while print (nload − nload per bundle ∗ nbundle ) ∗ load print (nf op − nf op per bundle ∗ nbundle ) ∗ get line(f oplist ) print (nstore −nstore per bundle ∗nbundle )∗store
Algorithm 2: LSA sched
MDL Kernel Desc.
Load select
Store Select
L A
A Arith. Select
S
A Arithmetic scheduling
S
Register Neutral_alloc()
L
S L A
S 1
S
A L
Arith. Sched.
L A
L
2
S 3
LSA_sched
Output x86 Assembly
Fig. 3: x86 code generation pipeline
– 36 memory-only µKernels: six of them are the single stream memory kernels which are shipped inside MAQAO. The remaining thirty are synthetic kernels generated by all the combinations of loads and stores with a maximum of 8 loads and 4 stores. – 20 Numerical Recipes µKernels: ten of the µKernels are synthetic memoryarithmetics µKernels whose memory/arithmetic, load/store and add/mul ratios are representative of the Numerical Recipes benchmarks. The other ten seeds are extracted from long, vectorized kernels from the Numerical Recipes benchmarks [17]. The right part of figure 4 presents the database load/store and flop/byte distributions. The left part presents the same distributions for all the vectorized floating point µKernels extracted from the NAS benchmarks.
The database distribution range for store over load ratio is close to the NAS distribution range: less than 5% of the NAS µKernels are outside the database distribution bounds. In the NAS benchmarks, balanced load-store kernels predominate. Therefore, the future base extension will have a particular focus on those configurations. Database and NAS arithmetic distributions are very close up to 0.8. For higher intensity, we rely on the scaling step of the pattern matching. Indeed, the database focus is mainly on memory-only seeds since we assume memory access cost predominates. However, to reduce the scaling factor, a future MDL database should explore larger arithmetic intensity bound. Comparing the database and NAS distributions shows no large discrepancy. Therefore, we conclude that the current database correctly captures the features of the studied NAS benchmarks and it can be used to predict NAS performance.
0.3
0.3
0.25
0.25
0.2
0.2
0.15
0.15
0.1
0.1
0.05
0.05
0 3
0
39 111 183 255 327 399 471 543 615 687 759 831 903 975 1047 1119 1191 1263 1335 1407 1479 75 147 219 291 363 435 507 579 651 723 795 867 939 1011 1083 1155 1227 1299 1371 1443
10
8
8
6
6
4
4
2
2 3
39 111 183 255 327 399 471 543 615 687 759 831 903 975 1047 1119 1191 1263 1335 1407 1479 75 147 219 291 363 435 507 579 651 723 795 867 939 1011 1083 1155 1227 1299 1371 1443
(c) NAS store/load ratio
4 3
6 5
7
8 10 12 14 16 18 20 22 24 26 28 30 32 34 36 38 40 42 44 46 48 50 52 54 56 9 11 13 15 17 19 21 23 25 27 29 31 33 35 37 39 41 43 45 47 49 51 53 55
(b) MDL-base flop/byte ratio
10
0
2 1
(a) NAS flop/byte ratio
0
2 1
4 3
6 5
7
8 10 12 14 16 18 20 22 24 26 28 30 32 34 36 38 40 42 44 46 48 50 52 54 56 9 11 13 15 17 19 21 23 25 27 29 31 33 35 37 39 41 43 45 47 49 51 53 55
(d) MDL-base store/load ratio
Fig. 4: NAS FP-SSE loops and MDL prototype database profiles.
5.2
Performance Replay and Prediction
The first case study is based on an industrial Gauss filter kernel implementation. Figure 5 compares the loop throughput in cycles and time per iteration of the MDL replay and the real code execution for different array sizes and architectures. The test architecture are: an Intel Xeon
[email protected], an Intel Xeon
[email protected] and an Intel Core i5
[email protected]. The mean relative error in replay is 8.66% and the absolute error average is 2.28 cycles. When comparing performance across architectures, cycles per iteration throughput is a misleading metrics. Indeed, the number of cycles is
18 16 14 L1 12 L2 10 L3 8 RAM6 4 2 0
Time(ns)
Cycles
45 40 35 30 25 20 15 10 5 0 replay
exec
Xeon L5609 @1.87GHz
replay
exec
Core i5M560 @2.67GHz
replay
exec
Xeon E5620 @2.40GHz
(b) NAS replay cycle
18 16 14 12 10 8 6 4 2 0
L1 L1 L2 L2 L3 L3 RAM RAM
replay
replay
exec
Xeon L5609 exec replay @1.87GHz
Xeon L5609 @1.87GHz
replay
exec
replay
exec
Core i5M560replayXeonexec E5620 exec @2.67GHz @2.40GHz
Core i5M560 @2.67GHz
Xeon E5620 @2.40GHz
(d) MDL replay time
Fig. 5: MDL replay of the Gauss filter on multiple architecture and input datasize.
not a time measure. When dividing by the frequency, the time in L1 and L2 appear to be proportional to the frequency, weheras in L3 there is no gain by moving from 2.40 to 2.67GHz, and in RAM the Xeon E5620 is clearly the fastest architecture for this code. Therefore, the user can save energy and money by choosing the best fitting architecture for an application. The larger prediction experiment is based on the NAS benchmarks. MDLPEF identifies 1499 FP-SSE loops in the eight benchmarks of the NAS suite. Since MDL-PEF predicts the perfectly vectorized bottom performance of the loop, the accuracy measurement of the prediction has to be checked against the vectorized FP-SSE loop. It represents 956 loops from the original set, among which 636 run with the current extraction and replay engine. Figure 6 presents the results on the 636 loops for two different architectures: a Nehalem Intel Xeon
[email protected] and a Xeon
[email protected]. The four lines present respectively L1, L2, L3, and RAM predictions. The whisker representation shows the relative error of the MDL prediction against the real loop in single thread execution. Each box is bounded by the first and third quantile value, with the bar inside each box being the median value. In L1 the median is very close to the first quantile value. In this experiment, MDL-PEF used the database described in section 5.1. The real execution time was measured by running the original assembly through MicroTools: – Base registers were rewritten with the adresses of the MicroTools allocated arrays. – Indirect access loops, large offset access and loops using more than 7 distinct memory streams were blacklisted. – The current approach does not consider aliasing, therefore two different baseaddress registers are always considered as different streams. The average relative error of the prediction is presented in array 6c. For unrolled and very large kernels, results are worse because of the performance nonadditivity issues described in section 4.2. One should notice that the prediction is
L1
0.2
● ●
● ●
● ● ● ●
● ●
● ● ● ● ●
● ● ● ● ●
● ● ● ● ● ●
● ● ● ● ● ●
0.6 ● ● ● ●
0.4 relative error
●
●
● ● ●
●
● ●
●
● ● ●
●
● ● ●
●
●
●
●
●
●
mg
sp
● ●
0.2
0.6
● ● ● ● ●
L3
L3
● ●
L2
● ● ●
0.6 0.5 0.4 0.3 0.2 0.1
0.4 0.2
● ● ● ● ● ● ●
● ● ● ● ● ● ● ● ●
0.6
● ●
●
●
● ●
●
●
●
●
●
●
●
● ●
● ●
● ●
● ●
●
●
●
●
●
●
●
0.4
●
●
0.2
●
RAM
●
● ●
RAM
0.6 0.5 0.4 0.3 0.2 0.1
0.4
L2
0.6 0.5 0.4 0.3 0.2 0.1
0.6 L1
relative error
0.6 0.5 0.4 0.3 0.2 0.1
●
bt
cg
ep
ft is bench
lu
mg
sp
(a) Intel Xeon
[email protected] Cache level L1 L2 L3 RAM Average
bt
cg
ep
ft is bench
lu
(b) Intel Xeon
[email protected]
[email protected] 0.076 0.085 0.153 0.0768 0.097
[email protected] 0.077 0.088 0.139 0.073 0.094
(c) Statistical summary
Fig. 6: Performance prediction relative error to real measurement sequence on the 636 loops extracted from the NAS benchmarks. The left plot is on an Intel Xeon
[email protected], the right one on an Intel Xeon
[email protected]
much more accurate in L1 and RAM. L2 and L3 predictions are unstable mostly because the pattern matching algorithm does not yet deal with stride iand offset matching. To overcome this problem we have to consider using data-mining to explore all the concretization parameters more extensively. From our experiments, we conclude that the first objective to replace the MAQAO performance predictor by a new extensible framework is reached. Future developments on the inner loop throughput prediction will have to exploit a more advanced model for performance combination of µKernels, and explore more unroll and stride parameters.
6
Conclusion and Future Works
This paper presents the MDL-PEF concept and its early prototype. The first implementation focus is setting the software stack of MDL-PEF. The first step converts an x86 assembly kernel to its MDL description. Then MDL-PEF simplifies the kernel using memory access coalescing, spill-fill removal,
and renaming. The final step splits the kernel in µKernels and refolds the unrolled one. MDL-PEF matches each µKernel with the closest seeds of the database and combines their predicted performance to predict the kernel throughput. The current implementation of MDL-PEF predicts the performance of a set of 1499 inner-loops extracted from the NAS benchmarks. The prediction average relative error over the 636 studied vectorized loops is 10%. In addition, MDL-PEF enables early exploration of the impact of the unroll factor and instruction scheduling using multiple MDL kernels. To improve the current model, we identify three priority actions. MDL represents a kernel as a data flow abstraction of the memory accesses decorated with arithmetic intensity information. Despite MDL’s architecture independent representation, the MDL construction and refinement process is not ISA agnostic. To tackle this problem we propose to use an intermediate representation (IR) assembly in MDL, such as KIMPLE [18] or GIMPLE [19]. The low level IR will enable more accurate replays and facilitate interfacing MDL with new ISA. Performance is not additive. The performance predictor needs to model more precisely the interactions among µKernels on the target architecture. Lastly, to enhance the accuracy of the pattern matching and the replay, we are exploring the MAQAO binary instrumentation for value profiling. It makes the execution context determinate and allows the extension of metric-quantification to loop-nests. To conclude, the current development and experiments clearly validate the interest of our concept. With the future software and model extension and large experimental validation, MDL-PEF will be a great complement to existing tools.
Acknowledgements This work done at LRC-ITACA/UVSQ is funded by the ITEA2-H4H project. The authors thank ECR and the MicroTools development team for their support.
References 1. S. L. Graham, P. B. Kessler, and M. K. McKusick. gprof: a call graph execution profiler. SIGPLAN Not., 39(4):49–57, 2004. ´ 2. M. Geimer, F. Wolf, B. J. N. Wylie, E. Abrah´ am, D. Becker, and B. Mohr. The Scalasca performance toolset architecture. Concurr. Comput. : Pract. Exper., 22:702–719, April 2010. 3. S. S. Shende and A. D. Malony. The Tau Parallel Performance System. Int. J. High Perform. Comput. Appl., 20(2):287–311, 2006. 4. J. Treibig, G. Hager, and G. Wellein. Likwid: A lightweight performance-oriented tool suite for x86 multicore environments. In Proceedings of the 2010 39th International Conference on Parallel Processing Workshops, ICPPW ’10, pages 207–216, Washington, DC, USA, 2010. IEEE Computer Society. 5. Bernard Goossens, Philippe Langlois, David Parello, and Eric Petit. Performance Evaluation of Core Numerical Algorithms: A Tool to Measure Instruction Level
Parallelism. In Para 2010: State of the Art in Scientific and Parallel Computing. University of Iceland, June 2010. 6. D. Eklov, D. Black-Schaffer, and E. Hagersten. Fast modeling of shared caches in multicore systems. In Proceedings of the 6th International Conference on High Performance and Embedded Architectures and Compilers, HiPEAC ’11, pages 147– 157, New York, NY, USA, 2011. ACM. 7. L. Djoudi, D. Barthou, P. Carribault, C. Lemuet, J. Acquaviva, and W. Jalby. Exploring application performance: a new tool for a static/dynamic approach. In Los Alamos Computer Science Institute Symp., Santa Fe, NM, 2005. 8. E. Rohou, F. Bodin, A. Seznec, G. Le Fol, F. Charot, and F. Raimbault. SALTO : System for Assembly-Language Transformation and Optimization. Research Report RR-2980, INRIA, 1996. 9. E. Petit, F. Bodin, G. Papaure, and F. Dru. ASTEX: a hot path based thread extractor for distributed memory system on a chip. In Proceedings of the 2006 ACM/IEEE conference on Supercomputing, SC ’06, New York, NY, USA, 2006. ACM. 10. M. Pushel, J. M. F. Moura, J. Johnson, D. Padua, M. Veloso, B. Singer, J. Xiong, F. Franchetti, A. Gacic, Y. Voronenko, K. Chen, R. W. Johnson, and N. Rizzolo. SPIRAL: Code generation for DSP transforms. Proceedings of the IEEE, special issue on “Program Generation, Optimization, and Adaptation”, 93(2):232– 275, 2005. 11. G. Fursin, Y. Kashnikov, A. Memon, Z. Chamski, O. Temam, M. Namolaru, E. Yom-Tov, B. Mendelson, A. Zaks, E. Courtois, F. Bodin, P. Barnard, E. Ashton, E. Bonilla, J. Thomson, C. Williams, and M. O’Boyle. Milepost GCC: Machine Learning Enabled Self-tuning Compiler. International Journal of Parallel Programming, pages 1–32, 2011. 12. M. Arenaz, J. Touri˜ no, and R. Doallo. XARK: An extensible framework for automatic recognition of computational kernels. ACM Trans. Program. Lang. Syst., 30:32:1–32:56, October 2008. 13. R. Tarjan. Depth-first search and linear graph algorithms. In Switching and Automata Theory, 1971., 12th Annual Symposium on, pages 114–121. IEEE, 1972. 14. T. Cover and P. Hart. Nearest neighbor pattern classification. Information Theory, IEEE Transactions on, 13(1):21–27, 1967. 15. W. Jalby et al. Measuring computer performance. HPC, 2011. 16. D.H. Bailey, E. Barszcz, J.T. Barton, D.S. Browning, R.L. Carter, L. Dagum, R.A. Fatoohi, P.O. Frederickson, T.A. Lasinski, R.S. Schreiber, et al. The NAS Parallel Benchmarks. Int. Journal of High Performance Computing Applications, 5(3):63, 1991. 17. W.H. Press, B.P. Flannery, S.A. Teukolsky, W.T. Vetterling, et al. Numerical recipes, volume 3. Cambridge Univ Press, 2007. 18. N. Benoit and S. Louise. Kimble: a Hierarchical Intermediate Representation for Multi-Grain Parallelism. In Proceedings of the 1st Workshop on Intermediate Representations, 2011. 19. J. Merrill. Generic and GIMPLE: A new tree representation for entire functions. In Proceedings of the 2003 GCC Developers Summit, pages 171–179, 2003.


![Branch Prediction and the Performance of Interpreters - Don't ... - Hal [PDF]](https://m.moam.info/img/260x300/branch-prediction-and-the-performance-of-interpret_6479932c098a9e90778b4607.jpg)