Confocal Volume Rendering: Fast Segmentation-Free Visualization of Internal Structures Rakesh Mullicka, PhD, R. Nick Bryanb, MD, PhD, and John Butmana, MD, PhD a
Diagnostic Radiology Department, Clinical Center, National Institutes of Health (NIH), Bethesda, MD 20892 EMail:
[email protected] b
Department of Radiology, University of Pennsylvania Health System 3400 Spruce St., Philadelphia, PA 19104
ABSTRACT Volume rendering is now a common tool for multidimensional data exploration in biology, medicine, meteorology, geology, material science, and other fields. In order to perform volume rendering, users are often forced to preprocess and segment their data. This step of processing before visualization often inhibits the use of volume rendering as it can be quite cumbersome and can also introduce undesirable artifacts. In order to enhance the use of direct volume visualization, powerful, yet easyto-use methods need to be developed. In this paper, we present an approach that offers the user data-dependent control over the focal region (in physical depth terms) of the visualization. This approach enables the user to easily visualize interior structures in the dataset by controlling physically defined parameters, without performing segmentation. Keywords: Volume rendering, segmentation, visualization, diagnostic evaluation, screening, surgery pre-planning.
1. INTRODUCTION The quest for "seeing" through the volume to study the relationship between the internal structures has materialized in direct volume rendering [1, 2, 3]. Volume rendering is a powerful technique for visualizing volumetric datasets, which represent discrete models of inherently 3-D continuous scene. Three-dimensional biomedical visualization has been in place for several years to assist clinicians, educators, and medical researchers [4, 5, 6]. The availability of highspeed low-cost general-purpose graphics workstations is enabling the use of computers in providing visual interpretations of data acquired from imaging systems. In the simplest form of volume rendering, a dataset is arranged in regular intervals as a rectilinear lattice. Each grid point or voxel is characterized by a scalar value (density as in CT, or signal strength as in MR) or color tuple (24-bit RGB as in the confocal microscopy or cyrosection (Visible Human Project) [7, 14] photo images). The rendered image is generated directly from the data
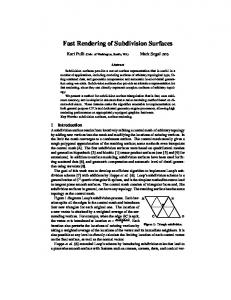
without an intermediate step, in contrast to surface rendering, which fits geometric primitives to a specified surface before rendering. Volume rendering is accomplished by classifying each voxel into colors and opacity and integrating a transport function through the volume [8]. Figure 1 shows the volume rendering stages.
Volume Data
Pre-processing
Transformation (linear/non-linear)
Classification
Shading & Lighting Compositing
Display
Figure 1: Overview of volume rendering pipeline. In radiological imaging, we are often interested in visualizing and quantifying isolated features in the data. These features can be gross normal structures such as organs and vessels, pathologies like tumors, abnormal growth patterns, arterio-venous malformations, or deep convolutions of sulcal anatomy within the brain. Most important is the ability to demonstrate the lesion in relation to the surrounding normal anatomy in a concise readily interpretable form. In the ideal case, the user is interested in viewing a region of interest with complete clarity along with neighboring structure with little or no pre-processing. This is specially the case when surgeons’
use acquired 3D data for intra-operative procedures and for pre-surgery planning. Routinely, these features of interest are identified using semi-automated image/volume segmentation techniques [20-25] or by manual specification of a region of interest (ROI). The methods for segmentation are often arduous, time-consuming, inexact, and prone to inter- and intraobserver variability. Data segmentation may also involve some pre-processing like noise reduction and nonuniformity correction. Some methods also require continuous operator supervision. Even after very careful specification of the region-of-interest, special volume rendering methods are required to visualize segmented data. In addition, the user is burdened with the management and handling of segmented data. Researchers [15-18] have used these techniques for visualization of 3D structures with some success. In this paper, we present an easy-to-use method that addresses some of these issues and offers an alternative for visualization of internal structures using direct volume rendering without pre-segmentation. Confocal Volume Rendering (CVR) has its origin in 3D MR imaging of the brain in order to view the cortical surface. Effective volume rendering of these datasets to highlight the cortex require that higher density structure such as skin, fat and bone be first stripped. The aim of CVR is to avoid these and similar pre-processing steps. CVR manipulates the opacity composition during ray casting using three main controls to allow the user to visualize only those internal structures that lie within a desired focal band.
Cnew and α new are the color and opacity values of the newly calculated voxel contributing to a particular pixel, while, C out ,in and α out ,in are the accumulated color and opacity values at the pixel from which the ray is emanating after and before the ray passes through the new voxel [12]. Front-to-back methods are suitable for those models, which can take advantage of data dependent acceleration techniques like early ray termination. On the other hand, back-to-front order provides higher image quality and added efficiency in higher degrees of gradient approximation. The following paragraphs highlight, in a step-wise manner, the qualitative enhancements to this method that gives the effect of visualizing 3D data with confocal-like controls. In the first step, the compositing operation steps-over a finite depth (a physical quantity, like mm) of the tissue beyond the exterior surface called the See-Through Band (S-Band). This is controlled by the confocal depth parameter specified by the user. The blank (air) to surface (usually skin) interface is defined by the opacity mapping (intensity vs. opacity graph) routinely used in volume rendering. The second compositing control in CVR, the Transition-Band (T-Band), scales the opacity of the tissue (as a function of depth) over a user-defined depth (in mm beyond the S-Band. In essence, the S-Band eliminates dominating structures intervening in the visualization of deeper features of the data, while the T-Band enhances the underlying structure by controlling translucency of the exposed region. Furthermore, numerous opacity scaling functions can be applied in the Transition-Band under the interactive control of the user.
2. TECHNIQUE Confocal Volume Rendering (CVR) is based on depthdependent modification of the opacity of voxels during the compositing stage of the core volume rendering process. The core volume rendering method is based on object-space projection rendering. This basic approach has been modified to resample all voxels to planes transverse to the viewing direction, then project them onto the viewing plane in front-to-back order using a color blending equation as described by Levoy [3]. A detailed description of this method is given in [11]. Compositing involves integrating the color-opacity pair assigned to the voxels along the ray. This operation can be done in either direction along each ray. For back-to-front order, the composition equation is:
C out = C in (1 − α new ) + C newα new
and for front-to-back order:
C out = C newα new (1 − α in ) + C inα in
α out = (1 − α in )α new + α in
2.1 S-Band (See-Through Band) The opacity-intensity mapping used in the core rendering process defines the overall translucency properties of the rendered image and eliminates undesirable noise intervening in the rendering process. As the first step, it establishes the distinction between empty space and the exterior edge of the object in the data (e.g. skin surface). During ray-compositing, this transition in the data is used to define the start of the S-Band and the end of the SBand is defined by the confocal depth parameter. This control allows the user to “erase” intervening structures (e.g. skin and skull) leading directly into the region of interest (e.g. brain surface). 2.2 T-Band (Transition Band) As opposed to the S-Band, the T-Band or confocal width is more loosely defined. Whereas the confocal depth allows the user to define what he is not interested in viewing, the confocal width is used for identifying exactly how much (in terms of depth) of the structure the user desires to see. It is important to note the distinction
between “how much” and “how”. The “how” is defined by the specific scaling of the opacity done in the T-Band.
Rendering was performed on a 550 MHz, 512 MB, Pentium III running Windows NT. The average time to generate an image was 10-20 seconds. Amongst the cases presented here, the common volume rendering parameters used were: Front-to-Back compositing, two light sources, material values (ambient=0.50, diffuse=0.70, specular coefficient=0.50, specular power=25), and ZuckerHummel gradient computation (See Appendix A).
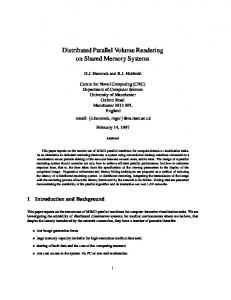
Ray Object
S-Band
obtained following the intravenous administration of a Gadolinium chelate for contrast enhancement of lesions.
T-Band
4. RESULTS
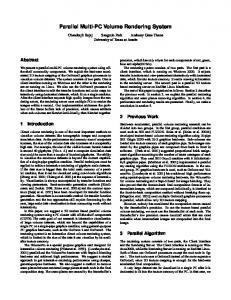
Eye Figure 2: Illustrating the S-Band & T-Band . 2.3 The Scaling Function The scaling of the opacity can be defined in one of many ways. In the simplest form, the opacity can be linearly scaled from the start of the T-Band (end of the S-Band) to the end of the T-Band (deep into the structure of interest). The visualization created is closely dependent on the type of scaling used. The scaling just described above allows a gradual increase of the upcoming structures along the ray. Conversely, if the desired effect is to enhance the surface characteristics of the object a linearly decaying curve may be more suitable. Based on the type of depth enhancement desired a corresponding scaling function can be defined. At present, our approach uses a combination of linearly increasing and then linearly decaying scaling function (See Figure 3). Furthermore, the time to render the dataset is considerably reduced by terminating the ray compositing at the end of the T-Band.
Case I – varying S-band Normal brain (23 year old male): Using successive increase in the depth of the S-band keeping the T-band constant, the cortical sulcation pattern is clearly demonstrated (particularly in the 3rd panel at a depth of 9mm). Note that no segmentation has been performed. MR was obtained axially with a slice thickness of 1.1 mm for a 0.94x0.94x1.1 mm3 voxel size. Rendering parameters were S-Band = 0-10 cm. T-Band = 22 mm, Depth Enhance (Peak) 9mm.
Depth Enhance Eye
S-Band T-Band Figure 3: Scaling function
Ray
3. METHODS MR volume data were obtained during the course of routine clinical work or research performed at the NIH. Data were obtained on 1.5T GE Signa MRI platforms. Heavily T1 weighted data volumes were obtained using a 3D spoiled gradient technique (3D SPGR TR=12.5, TE=5.3) or magnetization prepared fast SPGR (TI = 300.0 ms, TR = 6-10.0 ms, TE = 1.7-2.0 ms) with a field of view 24 cm, matrix size 256x256, slice thickness 1.0-1.5 mm, axial or sagittal acquisition planes. Some were
Figure 4: Case I Case II – varying depth enhance peak Normal brain (30 year old female): Different obliquity demonstrating most of the cortical gyri of the left hemisphere, particularly the left frontal lobe, again without segmentation. Varying the Depth enhance peak from 2 mm (left panel) to 10 cm (on right panel) shifts the focus from superficial gyri to deep structures. MR parameters as in case I. Rendering parameters: SBand = 14mm, T-Band = 100mm, and Depth Enhance (Peak) 2-100mm.
Figure 5: Case II Case III – varying S-band Cerebellar hemangioblastoma (44 year old female, post contrast): Varying S-band demonstrates left cerebellar hemangioblastoma, just deep to the left transverse sinus. MR parameters: TR=150.0, TE=5.6. Rendering parameters: S-Band = 0-40mm, T-Band = 30mm, and Depth Enhance (Peak) 3mm.
Figure 7: Case IV
Figure 6: Case III Case IV – varying S-band Brain metastasis (43 year old female) Left hand images (post-contrast) show successive S-band depths illustrating a relatively superficial, punctate (3-4 mm), enhancing lesion in the right central sulcus near the midline. The relationship of the lesion to the overlying draining veins is well depicted. Right hand images (precontrast) show a deep hemorrhagic lesion in the right frontal lobe (the bright signal is due to the presence of hemorrhage, not contrast). MR parameters: magnetization prepared fast SPGR with TI = 300.0 ms TR 6.7 ms TE 1.7 ms. Rendering parameters: S-Band = 0-25mm, T-Band = 30-45mm, and Depth Enhance (Peak) 7-9mm.
Case V – varying S-Band Cerebellar metastasis (48 year old male, post-contrast): S-Band set at 0 mm (left) shows the skin surface. S-Band set at 15 mm shows enhancement of a target shaped lesion in the right cerebellum, immediately superior and adjacent to the enhancement of the right sigmoid sinus. MR parameters: magnetization prepared fast SPGR TI=300.0, TR=9.1, TE=2.0. Rendering parameters: S-Band = 015mm, T-Band = 20mm, & Depth Enhance (Peak) 0mm.
Figure 8: Case V
5. DISCUSSION Confocal volume rendering adds a new dimension to three-dimensional data visualization and allows the user more control to emphasize or suppress 3D structures in a dataset according to depth. It significantly reduces the time to visualization by offering a more controlled feature selection in the direct volume rendering process and thereby avoiding the pre-processing phase. Since the entire dataset is taken into the visualization process, CVR avoids the artifacts that are commonly caused by data segmentation and allows the capability to show referential landmarks on the objects’ exterior, as is the case for surgical pre-planning. The advantage of CVR over other methods is described here. An alternate method to visualizing the interior of an object is by control of the VOI (volume of interest) or by oblique sectioning. Since both these tasks perform data clipping, valuable information is sacrificed in the process. A comparative view is shown in Figure 9.
Figure 9: Comparison of Confocal Volume Rendering with Oblique slicing. Another method to look at internal structural detail is by segmentation. A comparison between direct CVR and segmented rendering using skull stripping [19] (through thresholding, morphological operations, and finally seedbased region growing) is highlighted in Figure 10. The limitations of the latter technique can be the inability to recover the exterior information, time/resources to perform the segmentation, inter- or intra-observer variation, and introduction of segmentation artifacts.
Figure 10: Comparison of Confocal Volume Rendering with volume rendering the skull-stripped version. Other methods that segment the 3D data into labeled voxel dataset cause other artifacts in the visualization. Once the data has been transformed to this “binary” form, the computation of the surface gradient from using traditional approaches for visualization leads to undesirable image artifacts. Gradient estimates are required for illustrating the effect of light on the surface, an important visual cue in visualizing surfaces. Traditional approaches to gradient computation [9, 10] include 6-neighbor, Adaptive, Zucker-Hummel, 3D Sobel and others. These estimates are based on the inherent gray-scale variation in the image data, which for segmented data is discontinuous and results in aliasing. Due to poor gradient estimation, the effect on specular reflection is even worse. Another difficulty when using segmented datasets is computing interpolated point values. Using tri-linear interpolation between any two labels leads to a third not belonging to either of the two regions. This requires a very data-specific computation or a “snap to nearest neighbor” type identification of the interpolated value. This leads to ambiguity in specifying a label and a corresponding opacity/color appropriate for compositing. This problem is magnified as the number of segmented structures in the dataset increases. Therefore, to generate visually realistic imagery from segmented data, one needs to either separate each structure into separate datasets and later recombine following rendering, or determine alternate methods to generate a smooth appearing surface. In particular, brain segmentation algorithms are designed to remove vessels that are found in the space between the brain surface and the inner table of the skull. Many segmentation algorithms have difficulty in removing these vessels in their entirety, and fragments of vessels may remain attached to the brain particularly in the presence of contrast enhancement. While removal of these vessels may be particularly important in research applications where brain volumes are registered or measured, it is important to keep these landmarks in clinical applications particularly neurosurgical planning. The cortical draining veins are essential landmarks in neurosurgery, and 3D
depiction of the relationship of lesions to the cortical veins as well as cortical gyri is valuable. The confocal technique described here preserves this information, as exemplified in cases III-V.
5.
Volume rendering also has a significant advantage over other visualization techniques, particularly surface rendering, is the numerous possibilities it can offer by control over any of its numerous parameters. These include gradient computation methods, region of interest, compositing methods, material properties (opacity & color), local neighborhood voxel information. The manipulation of these parameters significantly aids in highlighting the varying aspects of the data as demanded by different applications.
6.
7.
8. 9.
6. CONCLUSIONS A novel approach for visualization of internal structures in 3D data using volume rendering without segmentation has been developed. It allows the user to easily specify a See-Through-Band and a Transition-Band in physical terms to expose intricate internal structures hidden under dominating shells. Further investigation using other datasets and varying the compositing parameters will be conducted. This has proved effective in rendering the cortical surface without segmentation, as well as the cortical draining veins. Furthermore, the authors are looking into possible extensions of this approach and integration with a 3D controller device that would allow interactive confocal navigation of data.
10.
11.
12.
7. ACKNOWLEDGEMENTS This work has been supported by the Diagnostic Radiology Department, Clinical Center, National Institutes of Health.
13.
8. REFERENCES
14.
1.
2.
3.
4.
R. A. Drebin, L. Carpenter, and P. Hanrahan, “Volume rendering,” Computer Graphics, Vol. 22 , No. 4, pp. 65-74, August 1988. M. Keeler and C. Upson, “Vbuffer: Visible Volume Rendering,” Computer Graphics, ACM Siggraph '88 conference proceedings 1988, pp. 51-58, 1988. M. Levoy, “Display of Surfaces from Volume Data,” IEEE Computer Graphics & Applications, pp. 29-37, May 1988. M. W. Vannier, “Current Opinion In Radiology ,” Computer-Applications In Radiology, 3: (2) 258-266 APR 1991.
15.
16.
W. Shieh, D. Stredney, and M. Torella, “A Distributed Three-Dimensional Brain Visualization System”, IEEE International Conference on Engineering in Medicine and society, Vol. 12 , No. 3, pp. 1175-1177, 1990. D. Stredney, “3-D Brain Visualization for Biomedical education”, Visions, Issue 3.1, Winter 1990. V. Spitzer, et al., “The Visible Human Male: A Technical Report”, Journal of American Medical Informatics Association, 1995. http://www.nlm.nih.gov/research/visible/visibl e_human.html U. Tiede, K. H. Hoehne, M. Bomans, A. Pommert, M. Riemer, and G. Wiebecke, “Investigation of Medical 3D-Rendering Algorithms,” IEEE Computer Graphics and Applications, pp. 41-53, March 1990. M. J. Bentum, B. B. A. Lichtenbelt, and T. Malzbender, “Frequency analysis of gradient estimators in volume rendering,” Submitted for publication to IEEE Transactions in Medical Imaging, 1997. H. T. Nguyen and R. Mullick, “Partitioned Volume Rendering (ParVo): An Efficient Approach to Visualizing Large Datasets,” Submitted to the ACM Journal of Graphics Tools, Nov. ‘98. C. Barrilot, "Surface & Volume Rendering Techniques to Display 3D Data," IEEE Engineering in Medicine and Biology, pp. 111-3, March 1993. S. W. Zucker and R. A. Hummel, "A ThreeDimensional Edge Operator," IEEE Transactions on Pattern Analysis and Machine Intelligence, PAMI-3(3):324-331, May 1981. R. Mullick and H. T. Nguyen, "Visualization and Labeling of the Visible Humanª Dataset: Challenges and Resolves," Proceedings of Visualization in Biomedical Computing 1996, Lectures in Computer Science, SpringerVerlag, 1996. G. B. Avinash and A. M. Alyassin, “Data visualization enhancement through removal of dominating structures,” US Patent 5832134, General Electric Company, Schenectady, NY, Nov. 1998. A. Doi, K. Koyamada, and T. Miyazawa, “Volume rendering method which increases apparent opacity of semitransparent objects in regions having higher specular reflectivity,” US Patent 5499323, International Business Machines Corporation, Armonk, NY, Mar 1996.
17. W. E. Lorenson , “3D Fusion Using the Tissue Lens,” MMVR, 1998. 18. S. Matsumoto, R. Asato, and J. Konishi, “A fast way to visualize the brain surface with volume rendering of MRI data,” Journal Of Digital Imaging 1999, 12(4):185-190. 19. A. Goldszal et al, “An image-processing system for qualitative and quantitative volumetric analysis of brain images,” JCAT, 22(5):827-837, 1998. 20. M. Joliot and B. M. Mazoyer, “Threedimensional segmentation and interpolation of magnetic resonance images,” IEEE Transactions in Medical Imaging, 12:269-277, 1993. 21. H. E. Cline, C. L. Dumoulin, and H. R. Hart, “3D reconstruction of the brain from magnetic resonance images using connectivity algorithm,” Magnetic Resonance Imaging, 5:345-352, 1987. 22. J. W. Snell, M. B. Merickel, and J. M. Ortega, “Model-based boundary estimation of complex objects using hierarchical active surface templates,” Pattern Recognition, 28:1599-1609, 1995. 23. M. E. Brummer, R. M. Mersereau, and R. L. Eisner, “Automatic detection of brain contours in MRI data sets,” IEEE Transactions on Medical Imaging, 12:153-166, 1993. 24. P. A. Filipek, D. N. Kennedy, and V. S. Caviness, “Magnetic resonance imaging based brain morphometry: Development and application to normal subjects,” Annals of Neurology, 25:61-67, 1989. 25. M. Bomans, K. H. Hoehne, and U. Tiede, “3-D segmentation of MR images of the head for 3D display,” IEEE Transactions on Medical Imaging, 9:177-183, 1990.
APPENDIX A The Zucker-Hummel (ZH) gradient [13] computation method was used. The ZH gradient is a three-dimensional edge (surface detection) operator that incorporates information from a 3x3x3 adjacent voxels for a better approximation of the edge. The ZH gradient is defined as: Gx(i , j , k ) = d (i +1, j , k ) − d (i −1, j , k ) + k1 (d (i +1, j +1, k +1) − d(i −1, j +1, k +1) + d(i +1, j −1, k +1) − d (i −1, j −1, k +1) + d(i +1, j +1, k −1) − d(i −1, j +1, k −1) + d (i +1, j −1, k −1) − d (i −1, j −1, k −1) ) + k 2 (d(i +1, j , k +1) − d (i −1, j , k +1) + d(i +1, j +1, k +1) − d (i −1, j +1, k +1) + d(i +1, j , k −1) − d (i −1, j , k −1) + d (i +1, j −1, k ) − d (i −1, j −1, k ) )
Gy(i , j ,k ) = d (i , j +1,k ) − d (i , j −1,k ) + k1 (d (i −1, j +1,k −1) − d (i −1, j −1,k +1) + d (i +1, j −1,k +1) − d (i +1, j −1,k +1) + d (i −1, j +1,k −1) − d (i −1, j −1,k −1) + d (i +1, j +1,k −1) − d (i +1, j −1,k −1) ) + k 2 ( d (i , j +1,k +1) − d (i −1, j ,k +1) + d (i +1, j +1,k ) − d (i +1, j +1,k ) + d (i , j +1,k −1) − d (i , j −1,k −1) + d (i +1, j −1,k ) − d (i +1, j −1,k ) ) Gz (i , j , k ) = d (i , j , k +1) − d (i , j , k −1) + k1 (d (i −1, j +1, k +1) − d (i −1, j +1, k −1) + d (i +1, j1, k +1) − d (i +1, j +1, k −1) + d (i −1, j −1, k +1) − d (i −1, j −1, k −1) + d (i +1, j −1, k +1) − d (i +1, j −1, k −1) ) + k 2 (d (i , j +1, k +1) − d (i , j +1, k +1) + d (i , j −1, k +1) − d (i , j −1, k −1) + d (i +1, j , k +1) − d (i +1, j , k −1) + d (i −1, j , k +1) − d (i −1, j , k −1) ) where k1 =
3 2 and k 2 = 3 2