2c) around the fixed centroid c of the convex hull. The scaling is given by Eq. 4. ..... Kohavi, R., John, G.H.: Wrappers for feature subset selection. Artificial Intelli-.
P. Szczypiski and A. Klepaczko, Convex Hull-Based Feature Selection in Application to Classification of Wireless Capsule Endoscopic Images, in Book Series Lecture Notes in Computer Science, Volume 5807, Springer 2009, Pages 664-675
Convex Hull-Based Feature Selection in Application to Classification of Wireless Capsule Endoscopic Images Piotr Szczypi´ nski and Artur Klepaczko Technical University of Lodz, Institute of Electronics ul. Wolczanska 211/215, 90-924 Lodz, Lodz {pms,aklepaczko}@p.lodz.pl
Abstract. In this paper we propose and examine a Vector Supported Convex Hull method for feature subset selection. Within feature subspaces, the method checks locations of vectors belonging to one class with respect to the convex hull of vectors belonging to the other class. Based on such analysis a coefficient is proposed for evaluation of subspace discrimination ability. The method allows for finding subspaces in which vectors of one class cluster and they are surrounded by vectors of the other class. The method is applied for selection of color and texture descriptors of capsule endoscope images. The study aims at finding a small set of descriptors for detection of pathological changes in the gastrointestinal tract. The results obtained by means of the Vector Supported Convex Hull are compared with results produced by a Support Vector Machine with the radial basis function kernel. Keywords: Wireless capsule endoscopy, feature selection, convex hull, support vector machines.
1
Introduction
Wireless capsule endoscopy (WCE) becomes more and more frequently used diagnostic technique of digestive system disorders. This is mainly due to its ability for visualization of the human small intestine, while being non-invasive and thus less traumatic for a patient when compared to other diagnostic methods. However, interpretation of a video sequence produced by the capsule endoscope demands signigicant effort and remains a time consuming procedure. This research aims at development of a system that would allow automatic recognition of WCE video frames containing potentially abnormal patterns appearing on the gastrointestinal tract’s internal surface. The adopted approach utilizes texture analysis to numerically describe anatomical structures viewed in the endoscopic images. It is assumed that texture parameters enable automatic discrimination between normal and pathologically altered tissues. The main problem which arises here is the multidimensional feature space generated by texture analysis. In the literature ([1,2]), one can find several approaches to texture description. Due to the versatile nature of J. Blanc-Talon et al. (Eds.): ACIVS 2009, LNCS 5807, pp. 664–675, 2009. c Springer-Verlag Berlin Heidelberg 2009 �
Convex Hull-Based Feature Selection in Application
665
WCE images, it is difficult to arbitrarily choose a particular model as the best matching one. More reasonably, one should calculate many texture features and then select their most discriminative subset. However, as it will be shown, texture parameter vectors representing objectively different classes may be distributed evenly throughout the whole feature space in the endoscopic images domain. Accurate separation of features becomes feasible only when nonlinear decision boundaries are constructed. In this study it is proposed to select relevant texture parameters using a measure which respects a possibility of encapsulating all vectors from one chosen pathology type by a convex hull. Simultaneously, vectors representing other classes should remain outside the hull. The main motivation for such an approach is to minimize the rate of false negative errors committed by the classifier. Since the process of convex hull construction largely depends on data vectors lying closest to the decision boundary, the proposed method hereafter shall be referred to as Vector Supported Convex Hull (VSCH). The method not only identifies significant parameters, but it also determines a classification rule based on the mathematical definition of the best found convex hull. The remainder of this paper is structured as follows. Section2 reviews the main aspects of the WCE imaging technique. The notion of texture analysis and the software tools used in this research are described in Sect. 3. Details of the proposed VSCH method are presented in Sect. 4. In the experimental part (Sect. 6), efficiency of VSCH is tested in comparison with the feature selection method based on the Support Vector Machines algorithm (recalled in Sect. 5) on a sample set of WCE images. Finally, Sect. 7 concludes.
2
Capsule Endoscopy
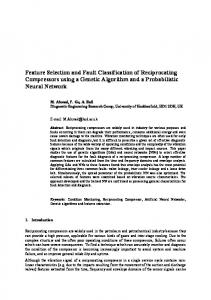
Wireless capsule endoscopy (WCE) [3,4], is a technique that facilitates the imaging of the human gastrointestinal system including small intestine. The WCE system consists of a pill-shaped capsule (cf. Fig. 1a) with built-in video camera, light-emitting diodes, video signal transmitter and battery, as well as a video signal receiver-recorder device. The wireless capsule endoscope used in this study produces color images of the internal lumen (cf. Fig. 1b). The images cover a circular 140◦ field of view. A patient under investigation ingests the capsule, which then passes through the gastrointestinal tract. When the capsule goes through the small bowel it is propelled by peristaltic movements. The capsule transmits video data at a rate of two frames per second for approximately 8 hours. Investigation of the recorded video is performed by a trained clinician. It is a tedious task that usually takes more than an hour. The video interpretation involves viewing the video and searching for abnormal-looking entities like bleedings, erosions, ulcers, polyps and narrowed sections of the bowel. There is a need for automatic methods which would aid in the investigation process, either by reduction of the time spent on the process or by focusing the attention of the clinician on medically relevant video fragments. Several research groups have recently reported methods for gastro-intestinal tract segmentation
666
P. Szczypi´ nski and A. Klepaczko
(a)
(b)
Fig. 1. Wireless capsule endoscope (a) and an example image (b)
into sections. In [5,6] image color and texture descriptors defined by the MPEG7 standard are used for topographic segmentation of the gastro-intestinal (GI) tract into sections. A similar approach has been presented in [7,8,9], where the color and texture descriptors are used for image classification and pylorus detection. Another classification procedure is presented in [10]. Image features, such as image intensity, contrast, and selected geometrical parameters, are extracted from WCE video frames. By comparison of feature vectors computed for nearby frames, video fragments presenting contractions can be detected. Authors demonstrate that fragments with contractions are of particular interest. Another approach is to obtain an image of the bowel surface [11] by preprocessing the video. Such an image, a bowel map, enables to quickly get an overview of the entire recording in terms of completeness and quality. The map also facilitates the identification of abnormal areas and focuses the efforts on relevant ones. In the presented approach we presume that image regions containing different pathologies and various aspects of normal mucosal appearance also differ in terms of color and texture descriptors. Such descriptors can be computed and then used for differentiation of image contents.
3
Texture Analysis
A texture is a visualization of complex patterns composed of spatially organized, repeated subpatterns, which have a characteristic, somewhat uniform appearance. The local subpatterns within an image are perceived to demonstrate specific brightness, color size, roughness, directivity, randomness, smoothness, granulation, etc. A texture may carry substantial information about the structure of physical objects. In medical images it may characterize the structure of human tissues or organs. Consequently, textural image analysis is an important issue in image processing and understanding in medical applications. To perform such analysis, mathematically defined texture properties are computed.
Convex Hull-Based Feature Selection in Application
667
In our study we use MaZda 4.7 software [12,13] for textural feature computation. The software is capable of conducting a quantitative analysis of texture within arbitrarily selected regions of interest (ROI) and can provide an interpretation of the computed results. There are three categories of feature computation approaches that MaZda utilizes: statistical (based on image histogram, gradient, co-ocurrence matrix, run-length matrix), model-based (implementation of the autoregressive model) and image transform (based on the Haar wavelet). MaZda may be used to compute textural descriptors based on color components of a color image, such as Y, R, G, B, U, V, I, Q, color saturation and hue. The textural features computed for different color components can be combined to obtain a comprehensive characterization of a colored texture. Therefore, feature vectors computed by MaZda may include over a thousand elements per individual region of interest. Such a large number of features, creating severalhundred-dimensional spaces, are not easy to handle by statistical analysis or by classifiers.
4
Vector Supported Convex Hull Method
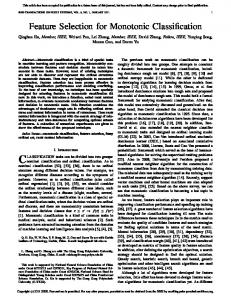
Since the main problem is to find a way of discriminating between various image classes, the Vector Supported Convex Hull Method aims at two objectives. The first is to reduce the dimensionality of the vector space by optimizing the number of vector features. This goal is achieved by selection of such subsets of features, which present best discrimination ability among other feature subsets. Usually only a limited number of features carry relevant information needed for discrimination and other features are redundant for classification. The profit of such selection is that redundant features are not calculated, which saves computation time. The second objective of the VSCH method is to propose a way for vector classification. The method produces a number of conditions - inequalities, which define a region of vectors as belonging to the class of interest. Thus, rules for classification are formulated throughout these inequalities. VSCH is a discriminant analysis method of supervised learning for reduction of vectors dimensionality and data classification. It aims at finding a subspace in feature vector space and produces a classification rule to separate the two classes. To explain the concept of VSCH let us assume input data consist of two sets (classes) of feature vectors in an n-dimensional space. All the features are real numbers and the feature vector space is also real. We search for a kdimensional subspace (k < n) such that vectors of the set number one form a cluster surrounded by vectors of the set number two (cf. Fig. 2). Θ ⊂ Ω; Θ ∈ Rk ; Ω ∈ Rn ; k < n.
(1)
Let us consider a convex hull of set one in a k-dimensional subspace of feature vectors space (k < n). The convex hull can be found by solving a system of equation (2) and inequality conditions (3). BT xΘ + b0 = 0
(2)
668
P. Szczypi´ nski and A. Klepaczko
(a)
(b)
(c)
(d)
Fig. 2. Illustration of convex hull method in 2D space (k=2)
BT xΘ + b0 ≤ 0.
(3)
Equation (2) defines a hyperplane in k-dimensional space. The equation (2) is solved for k+1 number of linearly independent vectors belonging to class number one. B is a versor of a hyperplane and parameter b0 are unknowns. There are two solutions of (2) per each subset of k + 1 vectors, since versor B may point toward the inside or outside of the convex hull. The boundary of the convex hull is then defined by such solutions, which in addition satisfy inequality (3) for all the vectors belonging to class one. Now we define a coefficient Q1 . It is the number of vectors belonging to the second class, which also belong to the convex hull built on class number one. It is the number of vectors of the second class satisfying inequality (3) defining the convex hull. The example in Fig. 2b shows one such vector. Therefore, in the case presented in the figure the Q1 = 1. Generally, the lower the value of Q1 , the better class separation for the analyzed Θ subspace. The next step is to find
Convex Hull-Based Feature Selection in Application
669
a centroid c of the convex hull. Then the convex hull is isotropically scaled up (cf. Fig. 2c) around the fixed centroid c of the convex hull. The scaling is given by Eq. 4. (4) x∗Θ = a(xΘ − c) + c. The parameter a defines a space enlargement. It is a maximum scaling factor for which Q1 does not increase. Now we define a Q2 coefficient which is equal to reciprocal of a (cf. Fig. 2d also). Q2 = a−1 =
d . d∗
(5)
Since, a is larger than 1, the coefficient Q2 is a fraction. On the other hand coefficient Q1 is an integer number equal or higher than 1. Now, we combine the two coefficients and define a comprehensive Q coefficient as: Q = Q1 + Q2 .
(6)
The Q specifies discriminative power of k-dimensional feature space. The lower value of the Q indicates the analyzed Θ subspace has better class separability. The algorithm for feature space reduction based on VSCH method was implemented. The algorithm searches through all the 1D, 2D and 3D feature subsets (Θ subspaces) and computes Q coefficient for each subset. For further analysis and classification purpose such subset is chosen, which exposes the lowest Q coefficient. The algorithm also produces rules of classification. The rules are given in form of inequalities (3). The inequalities define boundaries obtained by scaling-up the convex hull by factor of a/2. In many medical applications it is crucial not to overlook any indications of pathology. Such indications usually are later verified by medical experts and may be rejected. If they are mistakenly rejected by an automatic method, an expert may never notice the pathology. Therefore, it is important to find methods characterized by a minimal false negative error. The VSCH method reveals a property which is particularly useful in biomedical image analysis.. The method produces classification rules, for which (for the training set vectors) the false negative error is equal to zero. The minimization of false positive errors is a secondary goal, and is achieved directly by minimization of the Q1 coefficient. The VSCH can be compared with other method utilizing convex hull, the Nearest Convex Hull (NCH) classifier [14]. However, the NCH still requires radial basis function kernels in cases illustrated in Fig. 2. In contrast, the VSCH exploits natural ability of convex hull for separation of radially distributed vectors. Moreover, the NCH is not applicable for feature selection task.
5
Support Vector Machines
The proposed VSCH method presumes specific distribution of vectors. Similar concept underlies a well established classification algorithm – Support Vector Machine (SVM) with the radial basis function (RBF) kernel [15], which produces
670
P. Szczypi´ nski and A. Klepaczko
spherical shape of a decision boundary between two different classes. Thus, it is reasonable to evaluate VSCH performance in comparison with the SVM-RBF classifier. For the need of the comparative study reported below, SVM-RBF was employed for both feature selection and classification tasks. The SVM itself is a linear classification algorithm. The constructed decision hyperplane is defined as � αi yi xi · x, (7) y(x) = b + αi �=0
where parameters αi and b together with the support vectors xi determine location and orientation of the separating hyperplane. The learning procedure involves solving a constrained quadratic optimization problem which leads to determination of αi coefficients, whose values are non-zero only for those vectors in a training sample which lie closest (on either side) to a decision boundary. It must be noted, that SVM algorithm constructs a hyperplane which defines the largest margin between different data vectors classes in a particular feature subspace. In this aspect, the VSCH method behaves similarly to SVM. Another attractive property, which SVM possesses, allows its easy extension to non-linearly separable cases. The dot product (·) in (7) can be replaced by the kernel function which corresponds to the dot product of data vectors nonlinearly transformed into higher dimensional feature space. It is expected, that this hypothetical multidimensional space already allows linear discrimination of different classes. The main problem which arises here is to find appropriate transformation of the input data set. This reduces to choosing a kernel function for calculation of the dot product. Apart from the mentioned radial basis function, defined as (8) k(xi , xj ) = exp(−γ�xi − xj �2 ). The polynomial kernel constitute frequent alternatives: k(xi , xj ) = (xi · xj + 1)n .
(9)
From the reasons outlined above, in this research Eq. (8) was chosen. However, even if the general form of the kernel function is known, it still needs to be adjusted to the specific properties of a given data set. The value of γ coefficient cannot be determined automatically and several trials must be made before a trained classifier gains its discriminative power. In principle the larger γ is, the better accuracy on a training set is observed. On the other hand, there appears a risk of overfitting when the value of γ becomes too large. Hence, in every experiment one must find a good trade-off between error rate obtained for a training set and generalization capabilities of a trained SVM.
6
Experiment
To assess effectiveness of the VCSH method the following experiment was devised. Fifty images showing case of excessive ulceration were selected out of three
Convex Hull-Based Feature Selection in Application
(a)
(b)
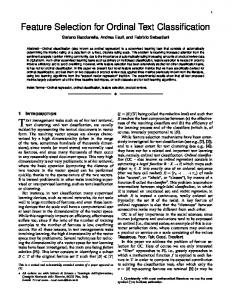
Fig. 3. Examples of class one (ulceration)
(a)
(b)
Fig. 4. Examples of class two (normal appearance of mucosal surface)
Fig. 5. Overlapping circular regions used in the study
671
672
P. Szczypi´ nski and A. Klepaczko
video files obtained for three different patients (cf. Fig. 3). Regions of ulceration (regions of interest) were manually depicted within the images. For reference, 200 images showing normal appearance (cf. Fig. 4) of mucosal surface were randomly chosen from other ten videos. Then all the selected images were divided into circular overlapping subregions, each of 2009 pixels area (cf. Fig. 5). For images showing ulcerations, textural features were computed within circular subregions enclosed within the depicted regions of ulceration. For other images textural features were computed within circular subregions enclosed within the image field of view. Features were computed by means of MaZda program. Feature vectors included histogram descriptors computed for 14 various color channels as well as gradient, co-ocurrence matrix, run-length matrix, autoregressive model and Haar wavelet transform descriptors computed for image brightness (together over 300 features per region). The number of vectors obtained was over 400 for class one (ulceration) and over 4800 for class two (normal). After that, training and testing sets were assembled. Training set was composed of 109 vectors of class one and 258 vectors of class two. Testing set was composed of 100 vectors of class one and 100 vectors of class two. In both cases vectors were picked randomly from the set of all the produced vectors. Then, VSCH and SVM methods were applied for attribute subset selection and data classification purpose. In both applications the goal of feature selection was to find a pair of features with the highest discrimination ability given the methods criteria. Feature space exploration was performed using exhaustive search. This eliminates the impact of local optima of criterion function or randomness associated with heuristic strategies such as genetic algorithm or sequential search methods [16,17,18]. Based on the training set, the VSCH method selected a pair of features computed from hue and green color components of the image. They are the mean value of the hue component (X Mean) and a tenth percentile of the green
(a)
(b)
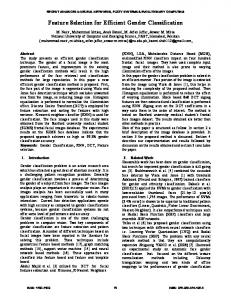
Fig. 6. Distributions of the training (a) and the testing (b) vectors in the feature subspace found by VSCH
Convex Hull-Based Feature Selection in Application
673
Table 1. Classification results
VSCH SVM
Training set
FPR [%]
Specificity
FNR [%]
Sensitivity
9.3
0.907
0.0
1.000
Testing set
7.0
0.930
6.0
0.940
Training set
4.3
0.958
6.4
0.936
Testing set
5.0
0.950
9.0
0.910
(a)
(b)
Fig. 7. Distributions of the training (a) and the testing (b) vectors in the feature subspace found by SVM-RBF
component (G Perc.10%) computed within the image region. Fig. 6a presents distribution of the training set vectors within feature space of X Mean, G Perc. 10% and additional W Mean (mean of brightness normalized U component). Fig 6b presents distribution of the testing set vectors within the feature space. In the case of SVM-based analysis the resulting attribute subspace also consisted of two first-order-histogram features calculated for color components of the images (W Perc.50% and U Perc.01%). Scatter plots of the training and testing data vectors in the reduced feature space are depicted in Fig. 7. The classification specificity, sensitivity, false positive rate and false negative rate computed for both selection methods are presented in Table 1.
7
Results Discussion and Conclusions
Analysis of the obtained results leads to the following conclusions. First of all, the performed experiments confirm that texture analasysis provides a practical numerical description of the WCE images. It is possible to accurately classify different types of visualized tissues basing on the selected, most relevant texture parameters. Among the calculated attributes, color component features appear to be the best at discriminating ulceration and normal regions.
674
P. Szczypi´ nski and A. Klepaczko
Secondly, the error rates as well as accuracy measures viewed in Table 1 are comparable for both tested approaches to feature selection. The VSCH method appears to be overoptimistic when predicting the False Negative Ratio (FNR) on the training set. This results directly from the very nature of the algorithm which aims at construction of a convex hull arround all vectors from a chosen pathology class. However, despite the observed increase in FNR calculated for the testing set, it is still lower than the score obtained for the SVM-based method. In the case of the latter, cost-sensitive learning should be applied to improve its performance with respect to positive class vectors misclassified as negatives. As it has already been mentioned, missing an image that contains important diagnostic information implies consequences that are potentially more dangerous for a patient. The False Positive Ratio (FPR) is not as important – a diagnostician allways has a chance to disregard images wrongly marked as containing pathologies. The proposed VSCH method ensures the desired behaviour without any explicit weighting of error types. Eventually, usage of SVM involves problem-specific parameterization of a kernel function. Frequently, one must experiment with several values of power exponents (both in polynomial or radial basis functions) before a final choice can be made. On the other hand, VSCH is a non-parametric method and does not require any fine-tuning to solve particular tasks. Moreover, it does not require any feature space standardization. Also any other linear transformation of feature space has no influence on the result produced by the method. The presented results constitute a preliminary study on classification of WCE images basing on their texture paramaters. This research shall be continued in order to further validate the proposed approach to feature selection. Furhter experiments are planned with the use of new sample images, possibly representing more than two classes. Acknowledgments. This work was supported by the Polish Ministry of Science and Higher Education grant no. 3263/B/T02/2008/35. The second author is a scholarship holder of the project entitled ”Innowacyjna dydaktyka bez ograniczen – zintegrowany rozwoj Politechniki Lodzkiej – zarzadzanie Uczelnia, nowoczesna oferta edukacyjna i wzmacnianie zdolnosci do zatrudniania, takze osob niepelnosprawnych” supported by the European Social Fund.
References 1. Haralick, R.: Statistical and structural approaches to texture. IEEE Proceedings 67(5), 768–804 (1979) 2. Tuceryan, M., Jain, A.: Texture Analysis. In: The Handbook of Pattern Recogntion and Computer Vision, pp. 207–248. World Scientific Publishing Co., Singapore (1998) 3. Iddan, G., Meron, G., Glukhowsky, A., Swain, P.: Wireless capsule endoscopy. Nature 405(6785), 417–418 (2000) 4. Swain, P., Fritscher-Ravens, A.: Role of video endoscopy in managing small bowel disease. GUT 53, 1866–1875 (2004)
Convex Hull-Based Feature Selection in Application
675
5. Coimbra, M., Campos, P., Cunha, J.: Extracting clinical information from endoscopic capsule exams using mpeg-7 visual descriptors. In: The 2nd European Workshop on the Integration of Knowledge, Semantics and Digital Media Technology, EWIMT 2005, pp. 105–110 (2005) 6. Coimbra, M., Cunha, J.: Mpeg-7 visual descriptors–contributions for automated feature extraction in capsule endoscopy. IEEE Transactions on Circuits and Systems for Video Technology 16(5), 628–637 (2006) 7. Mackiewicz, M., Berens, J., Fisher, M., Bell, G.: Colour and texture based gastrointestinal tissue discrimination. In: Proceedings of the IEEE International Conference on Acoustics, Speech and Signal Processing, ICASSP, May 2006, vol. 2, pp. 597–600 (2006) 8. Mackiewicz, M., Berens, J., Fisher, M.: Wireless capsule endoscopy video segmentation using support vector classifiers and hidden markov models. In: Proceedings of the International Conference on Medical Image Understanding and Analyses (June 2006) 9. Li, B., Meng, M.H.: Ulcer recognition in capsule endoscopy images by texture features. In: 7th World Congress on Intelligent Control and Automation, WCICA 2008, June 2008, pp. 234–239 (2008) 10. Vilarinao, F., Kuncheva, L.I., Radeva, P.: Roc curves and video analysis optimization in intestinal capsule endoscopy. Pattern Recogn. Lett. 27(8), 875–881 (2006) 11. Szczypinski, P., Sriram, R.D., Sriram, P., Reddy, D.: A model of deformable rings for interpretation of wireless capsule endoscopic videos. Medical Image Analysis 13(2), 312–324 (2009) 12. Szczypinski, P., Strzelecki, M., Materka, A., Klepaczko, A.: Mazda - a software package for image texture analysis. Computer Methods and Programs in Biomedicine 94, 66–76 (2009) 13. Szczypinski, P.: (2009), http://www.eletel.p.lodz.pl/MaZda (Visited: April 2009) 14. Nalbantov, G., Groenen, P., Bioch, J.: Nearest convex hull classification. Econometric Institute Report EI 2006-50 Revision Date: Erasmus University Rotterdam, Econometric Institute (January 2007) 15. Vapnik, V.: The Nature of Statistical Learning Theory. Springer, New York (1995) 16. Blum, A.L., Langley, P.: Selection of relevant features and examples in machine learning. Artificial Intelligence 97, 245–271 (1997) 17. Kohavi, R., John, G.H.: Wrappers for feature subset selection. Artificial Intelligence 97, 273–324 (1997) 18. Pudil, P., Somol, P.: Current feature selection techniques in statistical pattern recognition. In: Kurzynski, M., Puchala, E., Wozniak, M., Zolnierek, A. (eds.) Computer Recognition Systems. Advances in Sof. Computing, vol. 30, Springer, Heidelberg (2005)