CORE: Visualization tool for fault localization in concurrent programs
1.
Deepal Jayasinghe
Pengcheng Xiong
College of Computing Georgia Institute of Technology
College of Computing Georgia Institute of Technology
[email protected]
[email protected]
INTRODUCTION
With the widespread deployment of parallel systems based on multi-core processors, the increasing popularity of concurrent programming (for both the client side and on the server side) has brought the issue of concurrent defect analysis to the forefront [1].This motivates a large body of research that seeks to solve concurrency bugs as well as to improve the quality of multi-core, multi-threaded programs, both in academic circles and in industry. Concurrency bugs can be categorized in to a number of different types, and the main categories discussed in the literature are atomicity violations, ordering violations, locking discipline violations and data races. Concurrency bug is difficult to find due to non-deterministic behavior and huge interleaving space Ronsee et al. [2] developed a system to detect data races and provides record/replay capability. Lu et al. (AVIO)[3] and Lucia et al. (Atom-Aid)[4] detect atomicity violations using heuristics based on identifying unserializable interleavings. Savage et al. developed Eraser [5] tool to detect locking discipline violations using its lock-set algorithm. Lu et al.[6] presented a classes of bugs such as ordering violations and bugs involving multiple variables.
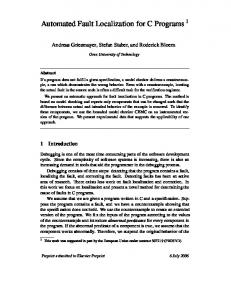
Figure 1: Instrumentation and Visualization of Multi-thread program
four pieces of information: (1) the memory access type as read (R) or write (W); (2) the thread that executes it, (3) the statement containing the access, and (4) the shared memory variable. And it can be denoted as T ypethread ;statement(var). For example, R1 ; S2 (x) indicates a read access to shared variable x in statement S2 of thread 1. Secondly, instrument the program and get the memory access to a shared variable. Count the total number of pass and failed patterns.
Park et al. [7] present a new dynamic fault-localization technique called “Falcon” that can pinpoint buggy data-access patterns in multi-threaded concurrent programs. Their technique monitors memory-access sequences among threads, detects data-access patterns associated with a program’s pass/fail results, and reports data-access patterns with suspiciousness scores. Their approach is based on Soot [8] framework for instrumentation and program analysis. Instead of running the program with multiple test cases, in their approach they run the program with same test case multiple times. This helps to localize and analyze buggy code in a concurrent program. The whole methodology is shown in Fig. 1.
Finally, use online pattern identification and pattern suspiciousness ranking to discover the cause pattern for the bug. For example, W1;1-W2;4-R1;3 is the cause for the order violation of shared variable X.
Firstly, denote a memory access to a shared variable with
The contribution of this paper is twofold. The main contribution is a new visualization technique for supporting the understanding of fault-localization technique to pinpoint buggy data-access patterns in multi-threaded concurrent programs. Another important contribution is to visualize those findings in more descriptive manner so that programmers and testers can easily understand the issues in the program. Our tool will help to bridge the gap between issues identification and visualization.
However, the results are presented in plain text format which is hard to read and analyze for programmers. Thus, using these tools, it is still difficult for developers to understand fault-localization in multi-threaded concurrent programs. This paper extends Falcon approach and proposes a virtualization tool which can not only show the order violation and atomicity violation results, but also relate the violations with source code.
The rest of the paper is organized as follows. In the next
section, first, we given a motivating example with possible concurrency violations, then we use that example to show what are order violation and atomicity violation and what information we can collect when we instrument the program. In section 3, we state our principles to design the visualization. We show how we implement the visualization in section 4. Finally, we make conclusion in section 5.
2.
BACKGROUND
In this section, we firstly give the definition of two kinds of concurrency violations, i.e., order violation and atomicity violation. Then we present an example for instrumentation information that we use throughout the paper.
2.1
A motivating example
Assume we have a class called “Account” as shown below (part of the program).
public class Account { synchronized void depsite(double money){ amount+=money; } synchronized void withdraw(double money){ amount-=money; } synchronized void transfer(Account ac,double mn){ amount-=mn; ac.amount+=mn; //no aquire for the other lock!! //+= might cause problem --it is not atomic. } }
And further assume that we have a class called “ManageAccount” as shown below (part of the program), which extends Thread class and override run method to invoke the methods defined in Account. public class ManageAccount
shared variables among multiple threads by a static thread escape analysis [9], and instruments the program to observe and record accesses at runtime. It also instruments methods, in order to provide detailed stack-trace information in subsequent bug analysis. It also provides an option to inject artificial delays that can increase the number of interleavings that occur, thereby increasing the chance of eliciting a concurrency bugs. It also computes suspiciousness values for each pattern, and reports the list of ranked suspicious patterns in a text format
2.2
Order violation
Order violation is defined as: the desired order between two memory accesses is flipped. An order violation occurs when a conflicting interleaving pattern appears that leads to unintended program behavior. The following is a part of execution status report generated by Falcon for execution information of order violation. It contains the following information. 9 1 10 10:ManageAccount.java_31|4 10:ManageAccount.java_31|4 6 8
Element 9 1
...
extends Thread{
public void run(){ account.depsite(300); account.withdraw(100); //transfering to the next account Account acc=accounts[(i+1)%num]; account.transfer(acc,99); } }
After initialization of several accounts, we will first deposit 300 to each account, withdraw 100 from each account and finally transfer 99 to the next account. Although each method for account has been labeled “synchronized”, it still suffers from concurrency violations. For example, if one thread for an account is trying to deposit 300 to this account while the other thread for another account is trying to transfer 99 to this account, there may be a concurrency violation. Falcon tool helps to localize fault in concurrent programs as in our example. It uses the Soot Analysis Framework for instrumentation. It determines which variables might be
...
Description We tested 10 times. There are 9 times when the test can pass. There is 1 time when the can fails There is 1 time when the Stack trace for variable 1. Set of methods which were executed before coming to the current line. The sequence is method 10 and then method 4. Stack trace for variable 2. The sequence is method 10 and then method 4.
Table 1: Execution information for order violation The following is an XML representation of instrumentation information which Falcon has used for a given program. It contains the following information 4 6 WF this. Account.java 24
Element 4 ... 6 ... 24
Description Method 4 Method 4 is “void transfer” Variable 6 Variable 6 is “double amount” at line 24 Line 24 is the code amount=mn;
Table 2: Execution information for Atomocity violation By combining the execution information and instrumentation information, we can find out why the order violation happens:
2.3
Atomicity violation
An atomic violation is defined as the desired atomicity among multiple memory accesses is violated. Atomicity is often referred to as serializability, which is satisfied if the resulting state of data in a concurrent execution is the same as that of a serialized execution. The following is a part of execution status report generated by Falcon for execution information of atomicity violation. It contains the following information 0 1 100 6:Main.java_59|3 10:ManageAccount.java_28|2 4 2 6 27
The execution information for atomicity violation is similar to that for order violation except that there is new element called stack3 and the first and the third stacks are with the same thread and the second stack is with a different thread.
the gathered requirements and our past experiences (Section 3.2). Finally, we present the three views of our visualization in detail (Section 3.3).
3.1
Most of the people expressed the need for viewing methods and variables that cause the concurrency violations in the source code because it would help them to understand the data visit patterns/sequences and their relationship to concurrency violations. Some of the people also express the need for viewing the suspiciousness ranking of visit patterns/sequences because it would help them to discover the cause pattern for the bug.
3.2
By combining the execution information and instrumentation information, we can find out why the atomicity violation happens:
3.
CONTRIBUTION AND DESCRIPTION
In this section, we describe our visualization techniques and our contributions. First, we describe the way in which we gathered the requirements for our visualization (Section 3.1). Then, we discuss the design decisions we made for the visualizations and the way in which these decisions were guided by
Design decisions
The consulting result indicates the need for representing concurrency violation related information at two levels of detail. The low-level representation provides detailed information about the methods and variables with respect to specific concurrency violation. The high high-level representation provides statistic information about suspiciousness ranking of visit patterns/sequences. We follow the concept relates to the information visualization mantra “Overview first, zoom and filter, then details-ondemand”, introduced by Shneiderman [12]. We then create two views for our visualization. The high-level view gives an overview of the name of the methods, variables and the statistic information about suspiciousness ranking of visit patterns/sequences. The low-level view gives the detailed statements which include the corresponding methods and variables.
3.3 The instrumentation information of for atomicity violation is the same as that for order violation.
Requirements
Shah et al. [10] gather general insights that developers might need to better understand exception-handling constructs by conducting a survey among software engineers from industry and academia. In Tarantula Jones et al. discussed how to use visualization techniques to analyze sequential program and relate the buggy code with the original program [11]. We use those techniques as the main guidelines for visualizing atomicity violation and order vitalization. Additionally we discussed with the few developers and researchers who would benefit from our tool and incorporated those suggestions also into the tool.
3.3.1
Detail of the views Summary View
The Summary view provides an overview of the tests execution; as shown in Fig. 2 the table represents all the test cases and number of pass test cases number of fail test cases and based on that the suspicious level. To easily understand the suspicious level we have used color hue; green less suspicious and red mean highly suspicious.
3.3.2
High-level view
The high-level view provides the interested variables; the methods visit those variables and the visiting pattern/sequence as shown in Fig.3
level view will give the exact statement for the variables/the methods and highlight the statement. For example, if the user chooses to find out where the variable “Variable 1: amount” is in the program, he/she can simply click the mouse. Then the view will navigate to the statement in the source code.
3.3.4
Figure 2: Summary view
Total view
The total view includes the summary view in the top-right and the high-level view in the left. Besides these two views, it also includes a low-level view in the bottom as shown in Fig.5 [Appendix section contains more clear figures for both order vialatio and atomicity vialation].
The user can first select the test case that he/she wants to show from the summary view. Then the high-level view will give the total number of tests that run in this test case, the pass count, the fail count and also the suspicious ratio. The view will also give the name of the variables and also the methods that visit the variable and their pattern/sequence. For example, there are 10 cases that run in test0, of which 9 passes and 1 fails. Then the suspicious ratio is 10%. The variables are both “account” and the method that visit these account are “run”, “clinit”. In thread 1, the visiting sequence is “run” then “run”. In thread 2, the visiting sequence is “clinit” then “run”. Figure 5: Total View
4.
IMPLEMENTATION AND EVALUATION
To evaluate our visualization technique, we developed the CORE (Concurrency violation visualization) prototype and conducted a case study. This section first presents the overview of our prototype implementation and then discusses a preliminary evaluation.
4.1
Figure 3: High-level View
3.3.3
Low-level view
The low-level view provides the details of the interested variables, the methods visit those variables in statement granularity as shown in Fig.4.
Prototype implementation
According to previous design decision of what to present and how to present while using techniques which do not try to overload the user with dozens of information, our implementation is based on information visualization mantra where we provide an overview first and then zoom and filter, and finally details-on-demand. There are a number of free and open source tools and packages for information visualization, among them Pre-puse [13] and GWT [14] were more in line with our project requirements. Unfortunately we need to change our dataset significantly to use those tools. As a result we use basic java awt and swing packages as the visualization libraries. Since our tool consists of a number of different views, we use Java tabbed pane to hold them and provide easy navigation among them.
Figure 4: Low-level View The user can first select the variables/the methods that he/she wants to find out for more details. Then the low-
In the view which presents the overall picture of the instrumentation we have used tabular representations since that helps to easily distinguish all the different instrumentations. And each row of the table represents a single instrumentation and linked with the source code, so just clicking on the
table row will lead user to the correct line of the source program. Each column of the table represents an attribute of execution and/or instrumentation. In order to better describe the execution information, we use Java drawing to draw colored circle (green for read and red for write) alone with the variable name, and by clicking on the drawn circle user can go the source code. And we also highlight the corresponding line in the source code. User can click on the corresponding code panel and open that in a new Window if he wishes to analyze further. The tool also features creating projects, which help developers to create a project with instrumentation, execution information and corresponding source code. Later on he can reuse the already created a project to analyze and visualize concurrent buggy access patterns, which helps them to save time on loading all the necessary files for the tool. Software evolution is inevitable as a result we need to develop the software in a way that we can evolve the application with minimum code changes, in our design and implementation we have considered the some immediate and long term features that we need to implement and have kept room for further improvements.
4.2
preliminary evaluation
We evaluate the tool in the following two aspects: • Aspect 1: Does CORE help programmer effectively localize faults for subject programs?
files which make it difficult to understand the thread interleaving in a program. In this paper, we present a visualization technique that shows information related to two kinds of concurrency violation, i.e., order violation and atomicity violation. We also consult programmers and professors to gather deeper insights into the problems. The consulting results our experiences guided the design of our visualization system, which we implemented as a tool called CORE (Concurrency violation visualization). It mainly composes of two views, i.e., the high-level view for the interested variables, the methods visit those variables and the visiting pattern/sequence and the low-level view for the details of the interested variables, the methods visit those variables in statement granularity. Programmer can sort the concurrency violation with various items, such as suspiciousness values or failing count. Then, if the programmer clicks one violation in the violation list, then we show the bug location in the file, and the stack trace of them, etc. Although CORE provides a number of unique capabilities that we believe will be useful for software engineers, our work is just the start of what is possible in the area of supporting the understanding of concurrency violation using visualizations. Future research includes: (1) Evaluate the CORE using more rigorous evaluation although we have conducted studies for performing preliminary evaluation of our system; (2) CORE uses the xml files for instrumentation and execution as input and output the result. In the future, we plan to generalize this approach by defining a standard format using XML to represent both the input and the output analysis results.
• Aspect 2: Does CORE help programmer efficiently work for subject programs while imposing small overhead?
6.
We use CORE to visualize the concurrency bugs in Contest benchmarks [15], which includes classes like Account, AirlinesTickets, BubbleSort2, BufWriter, Lottery, MergeSort, Shop and also Java Collection library like ArrayList, HashSet, StringBuffer, TreeSet, Vector. The result is that we can effectively show the concurrency bugs.
7.
As mentioned before, because CORE can create a project with instrumentation, execution information and corresponding source code, the programmer can reuse the already created a project to analyze and visualize concurrent buggy access patterns. Thus CORE can help programmer efficiently work for subject programs.
5.
CONCLUSION
Increasing use of multi-core based system, introduction of Web 2.0 technologies and use of multithread software have become a challenging task for enabling programmers to productively write and debug concurrent programs. This has motivated the development of several methods and tools for debugging and locating concurrency bugs. Park et al. [7] develop a tool called Falcon to discover the concurrency violations, with suspiciousness values. However, the concurrency violation information is stored in xml
ACKNOWLEDGMENTS
We would like to thank Sangmin Park for giving us a chance implement a visualization tool for better support his approach, and provide instrumentation and execution information to test our program.
REFERENCES
[1] P. Godefroid and N. Nagappan. Concurrency at Microsoft An Exploratory Survey. In Microsoft Research, Redmond, WA, 2008. [2] M. Ronsee and K. De Bosschere. RecPlay: A Fully Integrated Practical Record/Replay System In ToCS 1999. [3] S. Lu, J. Tucek, F. Qin, and Y. Zhou. AVIO: Detecting Atomicity Violations via Access Interleaving Invariants. In ASPLOS 2006. [4] B. Lucia, J. Devietti, K. Strauss, and L. Ceze. Atom-Aid: Detecting and Surviving Atomicity Violations. In ISCA 2008. [5] S. Savage, M. Burrows, G. Nelson, P. Sobalvarro, and T. Anderson. A Dynamic Data Race Detector for Multi-Threaded Programs. In ToCS 1997. [6] S. Lu, S. Park, E. Seo, and Y. Zhou. Learning from Mistakes- A Comprehensive Study on Real World Concurrency Bug Characteristics. In ASPLOS 2008. [7] Sangmin Park, Richard W. Vuduc, and Mary Jean Harrold. Falcon: Fault Localization in Concurrent Programs. [8] Soot Framework http://www.sable.mcgill.ca/soot/. [9] R. L. Halpert. Master’s thesis. McGill University 2008. [10] Hina Shah, Carsten G¨ org and Mary Jean Harrold. Visualization of Exception Handling Constructs to Support Program Understanding. In Proceedings of the 4th ACM
[11]
[12]
[13] [14] [15]
symposium on Software visualization, Ammersee, Germany, 2008. James A. Jones, Mary Jean Harrold, and John Stasko. Visualization for Fault Localization.. Proceedings of the Workshop on Software Visualization. In 23rd International Conference on Software Engineering, Toronto, Ontario, Canada, May 2001. Shneiderman, B. The eyes have it: A task by data type taxonomy for information visualizations. In In Proceedings ˝ of the IEEE Symposium on Visual Languages, 336U343 1996. PreFuse http://prefuse.org/. Elipse GWT http://www.eclipse.org/gef/. Y. Eytani, K. Havelund, S. D. Stoller, and S. Ur. Towards a framework and a benchmark for testing tools for multi-threaded programs. In Concurr. Comput. Pract. Exper., 19(3):267-279, 2007.
APPENDIX
Figure 6: Total view : Atomicity Vialation
Figure 7: Total view : Order Vialation