Hindawi Publishing Corporation Journal of Sensors Volume 2015, Article ID 245498, 10 pages http://dx.doi.org/10.1155/2015/245498
Research Article Correcting Air-Pressure Data Collected by MEMS Sensors in Smartphones Na-Young Kim,1 Yong-Hyuk Kim,2 Yourim Yoon,3 Hyo-Hyuc Im,1 Reno K. Y. Choi,4 and Yong Hee Lee5 1
Korea Oceanic and Atmospheric System Technology, No. 1503, 90 Gyeongin-ro 53-gil, Guro-gu, Seoul 152-865, Republic of Korea Department of Computer Science and Engineering, Kwangwoon University, 20 Kwangwoon-ro, Nowon-gu, Seoul 139-701, Republic of Korea 3 Department of Computer Engineering, College of Information Technology, Gachon University, 1342 Seongnam-daero, Sujeong-gu, Seongnam-si, Gyeonggi-do 461-701, Republic of Korea 4 Observation Research Division, National Institute of Meteorological Science, 33 Seohobuk-ro, Seogwipo-gi, Jeju-do 697-845, Republic of Korea 5 Numerical Data Application Division, National Institute of Meteorological Science, 61 Yeoeuidaebang-ro 16-gil, Dongjak-gu, Seoul 156-720, Republic of Korea 2
Correspondence should be addressed to Yong-Hyuk Kim;
[email protected] Received 11 May 2015; Revised 10 July 2015; Accepted 14 July 2015 Academic Editor: Geoffrey A. Cranch Copyright © 2015 Na-Young Kim et al. This is an open access article distributed under the Creative Commons Attribution License, which permits unrestricted use, distribution, and reproduction in any medium, provided the original work is properly cited. We present a novel correction method for air-pressure data collected by microelectromechanical pressure sensors embedded in Android-based smartphones, in order to render them usable as meteorological data. The first step of the proposed correction method involves removing the mechanically derived outliers existing beyond the physical limits and those existing outside 3𝜎, as well as a reduction to the mean sea level pressure using the altitude data from digital elevation models. The second correction step involves classifying data by location and linear-regression analysis utilizing the temperature and humidity sensed by the smartphone to reduce correction errors by performing the analysis according to personalized settings. Air-pressure data obtained from smartphones is subject to several influential factors, depending on the users’ external environment. However, once corrected for spatial location, temperature, and humidity and for individual users after a comprehensive quality control, the corrected airpressure data was highly reliable as an auxiliary resource for automatic weather stations.
1. Introduction In densely populated urban areas, environmental and meteorological data pertains to accurate decision-making regarding important socioeconomic issues, such as demographic changes, healthcare, food supply, security, conflict, and natural disasters. Disastrous weather events, such as localized torrential rains, gust of wind, extreme temperature, and rising sea levels, are among the several events that remind us of the importance of high resolution data regarding the ambient environment manifest as fine-scale climatic features [1–3]. However, an automatic weather station (AWS) operated by a public institution is limited insofar as it can
only provide very short-term (within one hour) weather forecasting [4–6], owing to the high social costs associated with installation and maintenance, and it requires large-scale investments in both time and money. Studies have been made for high resolution meteorological observations and forecasting in the United States, Japan, and South Korea by developing portable meteorological equipment, although installing portable meteorological equipment over a large area poses significant regional and economic challenges [7– 9]. Sensors have recently been available in smartphones with embedded microelectromechanical systems (MEMS) sensors for air pressure, temperature, and humidity to correct global
2 1025 1020
Air pressure (hPa)
positioning system (GPS) altitude data. Several Androidbased smartphones, in particular, are designed to collect meteorological data (Appendix A). With the increasing ubiquity of such smartphones, the higher the population in urban areas, the more densely distributed the meteorological data available. This study aims to develop a correction method to minimize the errors in meteorological data collected by smartphones vis-`a-vis reference data stored in the Korea Meteorological Administration (KMA). To do so, we developed an app (named Yeowoobi, which means sun shower in Korean) [10] that is capable of collecting and storing data observed by various weather sensors embedded in Androidbased smartphones, and we asked participants to use the app to collect meteorological data in June 2013. To our knowledge, this is the first study on correcting air-pressure data collected by smartphones, although guidelines and studies are available for correcting errors from public weather stations. Earlier studies [11–13] tried ambient temperature analysis using battery temperatures monitored by smartphones [14]. Unlike static weather stations, smartphones continually move from one place to another, and they are exposed to heating and cooling devices, the user’s body temperature, and a changing external environment, including spaces within automobiles or trains. Because such factors influence the smartphone’s sensors, the data cannot be used directly for weather forecasting. However, the data collected with the existing infrastructure in smartphones can be used as a low-cost auxiliary resource to provide information about the atmospheric environment in terms of fine-scale meteorological phenomena. To make this data more useful, the data must be adequately corrected. It is suggested to have a permissible error range of ±0.5 hPa, as specified in the KMA announcement number 2010-5 about the standard of automatic weather observation system (AWOS), which was provided by the KMA in 2011 [15]. This is done by performing a targeted quality control (QC) using preprocessing, statistical analysis, context awareness, and machine learning [16]. This study demonstrates the feasibility of such meteorological data collected by smartphones as an auxiliary resource for weather stations by analyzing and comparing the accuracy of the data with stored data from public weather stations. The remainder of this paper is organized as follows. Section 2 describes the data used in this study—namely, smartphone data, data from public weather stations, and data from digital elevation models (DEMs). Moreover, the preprocessing step for the proposed method is explained, involving the removal of mechanically derived outliers, a reduction to the mean sea level pressure (MSLP), and the removal of outliers lying outside 3𝜎. Section 3 explains the linear-regression analysis and statistical values. Section 4 describes the classification of locations by weather station, the inclusion or exclusion of temperature and humidity, enabling and disabling personalization, and the linear-regression analysis results depending on the user’s mobility. In Section 5, the results of the study are summarized and discussed. Finally, Section 6 presents the direction of future research.
Journal of Sensors
1015 1010 1005 1000 995 990
Time AWS User 1
User 2
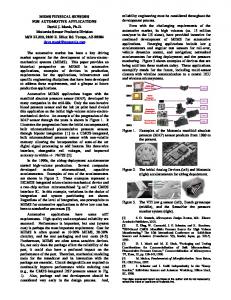
Figure 1: Sample plot of air-pressure data of two smartphones and AWS observed during a month (August 2014) at Station 108.
2. Meteorological Data 2.1. Data Collected by Smartphones. The following data is collected by a mobile app called Yeowoobi from general public: time of data acquisition, the user ID (encrypted), temporal information (year, month, day, hour, and minute), latitude (degree), longitude (degree), altitude (m), air pressure (hPa), temperature (∘ C), humidity (%), accuracy, speed (m/s), and mobile terminal information (Appendix B). Yeowoobi is designed to read and transmit the sensor values with the default interval, for collecting the air pressure, temperature, and humidity, which is set to 10 minutes. Users can change the settings to suit their needs with consideration to battery consumption, data-transfer costs, and notifications of abrupt changes to the air pressure. They can do so by choosing one of the nine observation intervals, ranging between one minute and three hours. Some screenshots of Yeowoobi app are given in Appendix C. 2.2. Data Collected by Public Weather Stations. The AWS run by the KMA has been using the Automated Surface Observing System (ASOS) data as public meteorological (PM) data. The PM data is spatially distributed from 692 public weather stations, currently active across the country as of November 2014. Only 256 stations (37%) of them collect air-pressure data, since AWS installed after the year 2007 includes air-pressure sensor in addition to conventional sensor arrangement—that of temperature, precipitation, rainfall occurrence, wind direction, and wind speed. Humidity has also been available since 2010. Nominal observation interval for each reading is one minute. The spatial distribution of the public weather stations is approximately 36 km with the ASOS and approximately 13.5 km for an AWS [15]. Figure 1 shows a sample plot of air-pressure data of two smartphones and AWS observed during a month (August 2014) at a station. 2.3. DEM Data. The following data was used in this study: (i) smartphone data: specifically the meteorological data
Journal of Sensors
3
Smartphone:162,387 locations
Public weather station: 692 stations
Gyeonggi-do
(a)
(b)
800 700 600 500 400 300 200 100 0 01
Mobile phones and data quantity
60,000 50,000 40,000 30,000 20,000
Data quantity
collected with smartphones via Yeowoobi between January 1, 2014, and August 31, 2014 (240 days); (ii) PM data: that is, the meteorological data stored in the KMA (AWS and ASOS data) from the same period; and (iii) DEM data: that is, altitude data at 30 m × 30 m resolution [17]. When app users are in building or underground, elevation information is not correctly collected by GPS in smartphones. Resultantly we could obtain elevation information as much as only 10 percent of the total collected data. So we used elevation information of DEM data for getting MSLP values of air-pressure data observed in smartphones. Excluded from the analysis were the smartphone and PM data collected from the spatial range of some public weather stations containing data flagged as having abnormal values after QC.
Mobile phones quantity
Figure 2: Locations of the collected smartphone data (a) and public weather stations (b).
10,000 02
03
04
05
06
07
08
09
0
Month (2014) Mobile phones quantity Data quantity
Figure 3: Quantity of smartphones and data collected.
2.4. Data Scale. In Figure 1, the locations of the datacollecting smartphones and public weather stations are plotted on a map. The total number of public weather stations was 692, as of October 2014, of which 217 stations are found in the area covered by the smartphone data. 162,387 locations out of the total number of locations for smartphone data collection (787,200) were found to be spatially distributed, as shown in Figure 2(a), when the latitude and longitude (unit: degree) were recalculated to three decimal places. In the plotted distribution of smartphones shown in Figure 2, the number of smartphone data collected across the country was 2,654,548 (a larger number than the number of locations, because different data can be collected from the same location at different times), of which over 50% (1,470,818) was distributed in Gyeonggi-do (including Seoul). Locations with high data density other than Gyeonggi-do were big cities with high population densities, such as Busan, Daejeon, Daegu, and Gwangju. By contrast, mountainous regions in Gangwon-do (in the northeast) and the Namhae plain region
(in the southwest) yielded a smaller volume of smartphone data. As for the temporal distribution, the number of smartphones and the volume of collected data were extremely low between January and May 2014. The volume of data from smartphone increased sharply between mid-June and late July, and the number of smartphones and the volume of collected data steadied at a level of 600/day and 47,000/day, respectively, from August onwards (Figure 3). Among the approximately 20 models of Android-based smartphones with embedded meteorological sensors for air pressure, temperature, humidity, and humidity, 17 models were used to collect the meteorological data (Appendix B). Whereas all of them could measure the air pressure, only a few had embedded sensors for temperature and humidity (namely, Galaxy 4, Galaxy Note 3, and Galaxy Round), with a data-acquisition rate as low as 35%. Speed and
4
Journal of Sensors
Table 1: Scale and rate of the meteorological data collected by smartphones. Data scale Time range Location range Latitude Longitude Number of users Number of total data Rate
Pressure
3,096 2,654,548 100%
Humidity
Temperature 01/01/2014–31/08/2014 (240 days) 33.20294–38.57546∘ N 124.6549–131.8698∘ E 929 949,859 35.78%
912 944,604 35.58%
elevation data accounted for only 10% of the air-pressure data (Table 1). Smartphones acquire location information by either the internet or GPS or both. The ones with internet adopt both the Wi-Fi transfer mode and the locations of peripheral communication stations as a reference standard. With GPS, speed and altitude cannot always be calculated. In fact, speed and altitude can be calculated via GPS-mediated communication for only 10% of the meteorological data. During the data collection period, a total of 2,934,718 data items were collected from 3,096 smartphone users. After removal of the data found to have abnormal values when checked against the equivalent data from the nearest public weather station, 2,654,548 (90.5%) of the smartphone data items were used in the final analysis.
Altitude
Speed
1,408 272,341 10.26%
1,406 268,651 10.12%
2.5.3. Removal of Outliers Existing outside 3𝜎. Smartphones are exposed to a number of factors that cause artificial airpressure changes as users move from one place to another using various means of transport (e.g., by driving along the highway, on high-speed trains, and in elevators). Figure 4 shows the distribution of air-pressure data of a representative user and AWS at two representative stations (108 and 410), during a month (August 2014). It was quite similar to a normal distribution. Thus, all data whose values were more than three times the standard deviation (SD; 𝜎) value of the total smartphone air-pressure data (𝜎 = 5.647) were considered as abnormal values and consequently removed. The data that remained after eliminating the outliers with abnormal values from the 3𝜎 test consisted of 2,636,328 data items, or 99.31% of the total number (2,654,548) of collected data before eliminating them (i.e., 18,220 or 0.69%).
2.5. Preprocessing: Quality Control (QC) 2.5.1. Physical Limit Test. According to the general meteorological standards from the World Meteorological Organization (WMO) [18], air-pressure values lower than 500 hPa and higher than 1,080 hPa are specified as abnormal. We removed these abnormal values from the smartphone data in accordance with this standard. 2.5.2. Reduction to Mean Sea Level Pressure (MSLP). The equation used for the reduction to the MSLP in this study is as follows [19]: 𝑃0 = 𝑃 (1 −
−5.257 0.0065ℎ ) (𝑇 + 0.0065ℎ + 273.15)
(1)
𝑃ℎ , = 0.03414 × (273 + 𝑇) where 𝑃0 is a sea level pressure (hPa), 𝑃 is a measured pressure (hPa), ℎ is an altitude obtained from 30 × 30 DEM (m), and 𝑇 is a temperature (∘ C). Based on the smartphone’s location information (i.e., the latitude and longitude), the DEM (30 m × 30 m) altitude data (ℎ), and the air temperature (𝑇) at the nearest public weather station, the data that remained after purging mechanical errors was reduced to the MSLP.
3. Linear-Regression Analysis We compared the MAE (4) and the RMSE (5) using linearregression analysis in the WEKA (Waikato Environment for Knowledge Analysis) suite [20]. For linear-regression analysis, we used the MSLP from the nearest public weather station temporally and spatially as the true value. As preprocessing, we used attribute selection using M5’s method (step through the attributes removing the one with the smallest standardized coefficient until no improvement is observed in the estimate of the error given by the Akaike information criterion) and a greedy selection using the Akaike information metric [21]. We tested our linear-regression method through 10-fold cross-validation. After calculating the weight from the training data (𝑛 = number of training data), 𝑥̂(𝑖) = 𝑤0 𝑎0 (𝑖) + 𝑤1 𝑎1 (𝑖) + 𝑤2 𝑎2 (𝑖) + ⋅ ⋅ ⋅ + 𝑤𝑘 𝑎𝑘 (𝑖) 𝑘
(2)
= ∑𝑤𝑗 𝑎𝑗 (𝑖) , 𝑗=0
and estimating each training data item, as per (2), 𝑛
2
∑ (𝑥(𝑖) − 𝑥̂(𝑖) ) , 𝑖=1
(3)
Journal of Sensors
5 Data observed from smartphone of a user at Station 108
Data observed from AWS at Station 108
700
700
600
600 500
400
Frequency
300 200
400 300 200
100
100
1019
1017
1015
1013
1011
1009
1007
1005
Data observed from AWS at Station 410 250
200
150
150
Air pressure (hPa)
1019
1017
1015
1013
1011
1009
1007
1005
1003
1001
999
991
1019
1017
1015
1013
1011
1009
1007
1005
1003
1001
999
0
997
0
995
50
993
50
997
100
995
100
993
Frequency
200
991
Frequency
Air pressure (hPa)
Data observed from smartphone of a user at Station 410
250
1003
Air pressure (hPa)
1001
995
997
0
1019
1017
1015
1013
1011
1009
1007
1005
1003
1001
999
995
997
0
999
Frequency
500
Air pressure (hPa)
(a)
(b)
Figure 4: Distribution of air-pressure data of a representative user (a) and AWS (b) at two representative stations (108 and 410), during a month (August 2014).
we obtain the linear-regression equation by selecting the weight (𝑤𝑗 𝑠) that minimizes the training data’s error, as per (3): MAE =
1 𝑚 (𝑖) ∑ 𝑦 − 𝑦̂(𝑖) , 𝑚 𝑖=1
RMSE = √
1 𝑚 (𝑖) 2 ∑ (𝑦 − 𝑦̂(𝑖) ) . 𝑚 𝑖=1
(4)
(5)
The resultant values from the test data (𝑚 = number of test data) are obtained by calculating (4) and (5).
4. Analysis of Results 4.1. Removal of Outliers Existing outside 3𝜎. Table 2 shows the results from the linear-regression analysis throughout South
Korea, comparing the result before outlier removal with that after outlier removal. As shown in Table 2, the mean absolute error (MAE) decreased by 0.14, from 1.69 to 1.55, and the root mean square error (RMSE) decreased by 0.36, from 2.44 to 2.08. Tables 2 and 3 show similarities between the patterns of meteorological data from Gyeonggi-do’s sample area and those from the entire country. We generated a dataset for linear-regression analysis by corresponding the smartphone data (i.e., the observation time, latitude, longitude, air pressure, and DEM data) with the PM data (i.e., the observation time, latitude, longitude, MSLP, altitude, and the SD of the distance from each smartphone) in the Gyeonggi-do area (latitude: 36.394–38.283, longitude: 126.379–127.858). 4.2. Classification by Public Weather Stations. We performed a linear-regression analysis on the PM data’s MSLP from
6
Journal of Sensors
Table 2: Results from the linear-regression analysis throughout South Korea, comparing the result before outlier removal with that after outlier removal. MAE RMSE TN
Before outlier removal 1.69 2.44 2,654,548
After outlier removal 1.55 2.08 2,636,328
MAE: mean absolute error, RMSE: root mean square error, and TN: total number of instances.
Table 3: Results from the linear-regression analysis in Gyeonggi-do, comparing the result before outlier removal with that after outlier removal. MAE RMSE TN
Before outlier removal 1.65 2.36 1,470,818
After outlier removal 1.58 2.05 1,463,829
MAE: mean absolute error, RMSE: root mean square error, and TN: total number of instances.
Table 4: Results of the linear-regression analysis for all collected data in Gyeonggi-do and the data classified according to the locations of the public weather stations in the same area.
MAE RMSE TN
Gyeonggi-do 1.58 2.05 1,463,829
Mean of public weather stations 1.07 1.48 1,463,820
MAE: mean absolute error, RMSE: root mean square error, and TN: total number of instances.
the dataset described in Section 2.5.3. Table 4 presents the mean of the results of the linear-regression analysis in the Gyeonggi-do area and the results of the linear-regression analysis from the data obtained from all public weather stations. The linear-regression analysis for all of the data in the Gyeonggi-do area yielded MAE and RMSE values of 1.58 and 2.05, respectively. These values decreased by 0.51 and 0.57, respectively (to 1.07 and 1.48), as a result of the linearregression analysis after grouping the same data according to public weather stations. 4.3. Classification Reflecting Temperature and Humidity. The proportion of data obtained measuring air pressure, temperature, and humidity in the Gyeonggi-do area was only approximately 35%. Furthermore, we performed a separate linear-regression analysis for data containing air-pressure information exclusively, comparing it with data containing temperature and humidity information as well (Table 5). There were 930,883 data items measuring air pressure exclusively (63.29% of the total data) and 532,946 data items
Table 5: Results of the linear-regression analyses for air pressure exclusively and results that include temperature and humidity, along with air pressure, at public weather stations.
Results of analysis
Only air pressure
Air pressure plus temperature and humidity
Mean of public weather stations (air pressure, temperature, and humidity)
MAE RMSE TN
1.64 2.12 930,883
1.41 1.86 532,946
0.78 1.57 528,740
MAE: mean absolute error, RMSE: root mean square error, and TN: total number of instances.
Table 6: Comparison of the results from the linear-regression analysis of the cases exceeding 1,000 data items and of the public weather Stations A (108) and B (410). MAE RMSE TN
Gyeonggi-do mean 0.52 0.81 1,077,295
Station A (#108) 0.59 0.91 207,953
Station B (#410) 0.68 1.14 102,584
MAE: mean absolute error, RMSE: root mean square error, and TN: total number of instances.
that included pressure, temperature, and humidity (36.23% of the total data). Although data with all three items accounted for only 57% of the data from air pressure exclusively, the linear-regression analysis resulted in a decrease to the MAE and RMSE by 0.23 and 0.26, respectively. Moreover, the linear-regression analysis for the data containing all three items—after being classified by public weather stations— resulted in a considerable decrease to both the MAE and RMSE. 4.4. Classification by Public Weather Stations and Personalization. We performed linear-regression analysis on the air-pressure data after classifying them by public weather station and by user. Table 6 presents the linear-regression analysis results for the mean of the cases exceeding 1,000 data items and the public weather stations, demarcated into Station A (Seoul, Jongno-gu, Songwol-dong; latitude: 37.571, longitude: 126.966, #108) and Station B (Seoul, Dongjak-gu, Sindaebang-dong; latitude: 37.491, longitude: 126.918, #410). The results of the linear-regression analysis after classifying data by public weather stations and by users in the Gyeonggi-do area showed only slight differences to the mean MAE between Station A (108) and Station B (410). That is, the mean value did not differ significantly between Stations A and B. The total number of data items (TN) reveals that Stations A and B are representative areas, accounting for approximately 20% and 10% of the entire Gyeonggi-do area, respectively, and that the MAE values did not differ much in the area around Gyeonggi-do.
2 1.8 1.6 1.4 1.2 1 0.8 0.6 0.4 0.2 0
7 3
y = 0.0607x + 0.4488 R2 = 0.0327
y = 0.0741x + 0.7259
2.5
R2 = 0.0286
2 RMSE
MAE
Journal of Sensors
1.5 1 0.5
0
2
4
6
8
0
10
0
2
4
ΔD
8
10
(b)
3
y = 0.1526x − 0.1166
y = 0.2049x − 0.0416
2.5
R2 = 0.1021
R2 = 0.108
2 RMSE
MAE
(a)
2 1.8 1.6 1.4 1.2 1 0.8 0.6 0.4 0.2 0
6 ΔD
1.5 1 0.5
0
1
2
3
4
5
6
7
8
0
0
1
2
3
4 ΔP
ΔP (c)
5
6
7
8
(d)
Figure 5: Distribution plots, indicating the MAE ((a) and (c)) and RMSE ((b) and (d)) according to the SD in distance ((a) and (b)) and pressure ((c) and (d)) from the public weather stations by smartphone user (limited to the cases in Gyeonggi-do for data items exceeding 1,000).
The correlation analysis for the MAE and RMSE according to the distance and pressure differences from the public weather stations by smartphone users yielded correlation coefficients of 0.18 for the MAE and 0.17 for the RMSE, with the MAE and RMSE according to the SD in pressure at 0.32 and 0.33 (see 𝑅 values in Figure 5), respectively. In other words, the correlation for the MAE and RMSE was greater with respect to pressure differences than distance differences.
Table 7: Results from the linear-regression analyses of highmobility users (Users 1 and 3) and low-mobility users (Users 2 and 4) among the smartphone users located close to the public weather Stations A and B.
4.5. Comparison of Errors according to User Mobility. Figure 6 illustrates the visualized mobility patterns over time for users with high mobility compared with those with low mobility at public weather Stations A and B. The blue dots represent users with high mobility (Users 1 and 3), and the red dots represent those with lower mobility (Users 2 and 4). Table 7 presents the results from the linear-regression analysis for each user, wherein the patterns are apparent for the MAE and RMSE with respect to the air pressure at the public weather stations. The high-mobility users resulted in MAE (RMSE) values of 1.00 (1.42) in Station A and 0.47 (0.89) in Station B. The MAE (RMSE) value for low-mobility users was 0.22 (0.37) and 0.09 (0.11) in Stations A and B, respectively. This implies
MAE: mean absolute error, RMSE: root mean square error, and TN: total number of instances.
MAE RMSE TN
Station A (#108) User 1 User 2 1.00 0.22 1.42 0.37 4,411 7,838
Station B (#410) User 3 User 4 0.47 0.09 0.89 0.11 16,469 10,122
that errors in air-pressure measurements were greater in proportion to user mobility at the same location.
5. Discussion Most Android-based smartphones are able to measure airpressure data. Unlike temperature and humidity, air pressure is less influenced by the man-made environment (indoor/outdoor or air-conditioned/heated). The results of
8
Journal of Sensors
A (108)
B (410)
User 3 User 4
User 1 User 2
(a)
(b)
Figure 6: Time-dependent location distributions of users with high mobility and those with low mobility at the representative public weather Stations A (a) and B (b): Station A (range: latitude 37.53–37.71 degrees, longitude 126.95–127.17 degrees) and Station B (range: latitude 37.46– 37.56 degrees, longitude 126.84–126.95 degrees).
this study revealed that errors in the meteorological data from smartphones tend to decrease under the following conditions: with concurrent observations of temperature and humidity and comparing users with similar moving patterns (presumably because of similar means of transport). By correcting the errors resulting from these factors, we could verify the feasibility of using the air-pressure data collected by smartphones as an auxiliary resource for public weather stations. As such, the proposed method contributes to enhancing the forecasting accuracy by providing high resolution meteorological data in countries or regions with a low distribution of public weather stations otherwise difficult to achieve due to high costs in terms of installation and maintenance. The results show that smartphone-based meteorological data with minimal correction algorithm have potential for contribution to improving high resolution weather forecasting where precise short-term meteorological observations are required, such as sporting events.
6. Future Research Directions In this study, we presented a new method to correct errors in air-pressure data collected with smartphones, by comparing the errors in air-pressure data from nearby public weather stations after classification according to relevant factors, such as the presence or absence of temperature and humidity data, personalization, and the mobility of individual users. In future research, we plan to focus on the following: (i) comparing between the day-time and night-time mobility of users, (ii) comparison of errors with different speed using the location information in smartphones to verify mobility, (iii) comparing between data with and without altitude data acquired from smartphones in addition to DEM data, (iv) comparison with various machine-learning techniques in
addition to linear-regression analysis, (v) direct comparison with the smartphone pressure to the WMO-approved pressure sensor as a reference, and (vi) comparing various preprocessing steps, such as time-consistency test (step test) and persistence test, as well as the physical limit test and 3𝜎 test used in this study. There are several problems in directly applying step test and persistence test used in AWS to smartphone data. One of the main problems is that the time interval in collecting smartphone data is not irregular (it varies from one minute to three hours). In the cases in which the time interval is too large or it is changed over time, it is not easy to apply the two QC tests to smartphone data. However, its successful application to smartphone data is valuable and necessary to improve the correction quality. We also intend to explore other comparative methodologies and to validate them. Using these methods, we aim to improve the correction ability of the proposed method with regard to the meteorological data from smartphones and to verify the possibilities of using such data as additional meteorological data for high resolution short-term scale weather forecasting.
Appendices A. List of the Smartphone Models Used in the Study for Data Collection and Their Respective Meteorological Sensors See Table 8.
B. Data Collected by Smartphones and Pertinent Details See Table 9.
Journal of Sensors
9
Table 8: List of the smartphone models used in the study for data collection and their respective meteorological sensors. Manufacturer
Samsung
LG
Pantech CASIO Sony
Model Galaxy S3 Galaxy S4 Galaxy S5 Galaxy Note Galaxy Note 2 Galaxy Note 3 Galaxy Round Galaxy R Galaxy Nexus Nexus 4 Nexus 5 G3 Optimus G Optimus Vu2 Vega R3 G’z-One Xperia Z2
Data size 359,285 611,640 487,488 117,786 650,232 473,999 72 1,877 7,294 402 28,075 123,361 31,787 2,889 19,234 17,337 1,761
Pressure O O O O O O O O O O O O O O O O O
Temperature
Relative humidity
O
O
O O
O O
O
GPS O O O O O O O O O O O O O O O O O
Table 9: Data collected by smartphones and pertinent details. Number
Collector item
Unit YYYY-MMDD hh:mm
1
REQ TIME
2
SEQ
Serial Number
3
FINGERPRINT
Phone Information
4
PROVIDER
—
5
ACCURACY
—
6
Observation TIME
7 8
LATITUDE LONGITUDE Observation SPEED Observation ALTITUDE
9 10 11
PRESSURE SENSOR INFO
12
PRESSURE HUMIDITY SENSOR INFO HUMIDITY
13 14 15
TEMPERATURE SENSOR INFO
16 17
TEMPERATURE USER ID
Description
Data example
Value type
Connection time for transfer
2014-04-16 12:17
Numeric
Serial number (assigned by the server) PDA (personal digital assistant) Information (23 models) Transfer method Inversely proportional
73792
Numeric
samsung/ks01ltektt/ks01ltektt:4.3/JSS15J/ E330KKKUBML1:user/release-keys
Character
gps (or network)
Character
37
Numeric
Observation time
1397618269000
Numeric
Latitude Longitude
37.50412752 126.8757452
Numeric Numeric
m/sec
Speed
0
Numeric
M
Altitude
241
Numeric
Barometer Sensor|STMicroelectronics|1.0|1
Character
1014.08936 SHTC1 relative humidity sensor|Sensirion|0.04|1 55.833256
Numeric Character
SHTC1 ambient temperature sensor|Sensirion|0.01|1
Character
20.518414 4d60d5a821c907f0dcf1e20c45aaf108
Numeric Character
UTC Million TIME Degree Degree
— hPa — % — ∘
C —
Product type of air pressure sensor Air pressure Product type of humidity sensor Humidity Product type of temperature sensor Temperature User ID
Numeric
10
Journal of Sensors
[5]
[6]
[7]
[8] [9]
(a)
(b)
Figure 7: Two screenshots of the developed Yeowoobi app. Information is given in Korean: (a) shows temporal weather information and (b) indicates spatial air-pressure information.
[10]
[11]
C. Some Screenshots of the Developed Yeowoobi App See Figure 7.
[12]
Conflict of Interests [13]
The authors declare that there is no conflict of interests regarding the publication of this paper.
Acknowledgments This work was supported by the “Small and Medium Sized Enterprise Technology Development Support Program,” through the Small and Medium Business Administration (SMBA) of Korea, in 2013 (S2139031). The present research has been conducted by the Research Grant of Kwangwoon University in 2014. The authors thank Mr. Sangjin Sim for his valuable suggestions in improving this paper.
References [1] D. Butler, “Nuclear safety: reactors, residents and risk,” Nature, vol. 472, no. 7344, pp. 400–401, 2011. [2] P. Mondal and A. J. Tatem, “Uncertainties in measuring populations potentially impacted by sea level rise and coastal flooding,” PLoS ONE, vol. 7, no. 10, Article ID e48191, 2012. [3] S. Wegscheider, J. Post, K. Zosseder et al., “Generating tsunami risk knowledge at community level as a base for planning and implementation of risk reduction strategies,” Natural Hazards and Earth System Science, vol. 11, no. 2, pp. 249–258, 2011. [4] J.-H. Seo and Y.-H. Kim, “Genetic feature selection for very short-term heavy rainfall prediction,” in Proceedings of the International Conference on Convergence and Hybrid Information
[14]
[15] [16]
[17] [18]
[19] [20]
[21]
Technology, vol. 7425 of Lecture Notes in Computer Science, pp. 312–322, 2012. J.-H. Seo, Y. H. Lee, and Y.-H. Kim, “Feature selection for very short-term heavy rainfall prediction using evolutionary computation,” Advances in Meteorology, vol. 2014, Article ID 203545, 15 pages, 2014. Y.-H. Kim and Y. Yoon, “Spatiotemporal pattern networks of heavy rain among automatic weather stations and very shortterm heavy-rain prediction,” Advances in Meteorology. In press. J. M. Straka, E. N. Rasmussen, and S. E. Fredrickson, “A mobile mesonet for finescale meteorological observations,” Journal of Atmospheric and Oceanic Technology, vol. 13, no. 5, pp. 921–936, 1996. Sony Corporation, “Weather observation system,” Japanese Patent, JP2005-207863A, 2005. VK Corporation, “Mobile communication terminal having a weather station function and method for providing the weather and meteorological information of its terminal,” KR 20060019322, VK Corporation, Gyeonggi-do, Republic of Korea, 2006. K. H. Park, A study on characteristics and utilization of meteorological data obtained from a smartphone [Ph.D. thesis], Soongsil University, 2014 (Korean). M.-K. Lee, S.-H. Moon, Y.-H. Kim, and B.-R. Moon, “Correcting abnormalities in meteorological data by machine learning,” in Proceedings of the IEEE International Conference on Systems, Man and Cybernetics (SMC ’14), pp. 888–893, San Diego, Calif, USA, October 2014. J. H. Choi, Y. H. Lee, D. E. Jang, and C. H. Cho, “Short-range ensemble temperature prediction by applying dynamic error correction,” Asia-Pacific Journal of Atmospheric Sciences, vol. 41, no. 1, pp. 17–27, 2005. J. Est´evez, P. Gavil´an, and J. V. Gir´aldez, “Guidelines on validation procedures for meteorological data from automatic weather stations,” Journal of Hydrology, vol. 402, no. 1-2, pp. 144– 154, 2011. A. Overeem, J. C. R. Robinson, H. Leijnse, G. J. Steeneveld, B. K. P. Horn, and R. Uijlenhoet, “Crowdsourcing urban air temperatures from smartphone battery temperatures,” Geophysical Research Letters, vol. 40, no. 15, pp. 4081–4085, 2013. Korea Meteorological Administration, 2014, http://www.kma .go.kr. F. Persson and T. Svahn, Mobile Meteorological Measurements, Department of Electrical and Information Technology, Lund University, 2011. BIZ-GIS, biz-gis.com/GISDB: DEM, 2014. WMO, “Urban observations,” in Guide to Meteorological Instruments and Methods of Observation, vol. 8, World Meteorological Organization, Geneva, Switzerland, 2004. S. S. So, C. W. Lee, M. K. Kim, and E. M. So, Atmospheric Observation, Kyomun Press, 1994 (Korean). M. Hall, E. Frank, G. Holmes, B. Pfahringer, P. Reutemann, and I. H. Witten, “The WEKA data mining software: an update,” ACM SIGKDD Explorations Newsletter, vol. 11, no. 1, pp. 10–18, 2009. H. Akaike, “A new look at the statistical model identification,” IEEE Transactions on Automatic Control, vol. 19, no. 6, pp. 716– 723, 1974.
International Journal of
Rotating Machinery
Engineering Journal of
Hindawi Publishing Corporation http://www.hindawi.com
Volume 2014
The Scientific World Journal Hindawi Publishing Corporation http://www.hindawi.com
Volume 2014
International Journal of
Distributed Sensor Networks
Journal of
Sensors Hindawi Publishing Corporation http://www.hindawi.com
Volume 2014
Hindawi Publishing Corporation http://www.hindawi.com
Volume 2014
Hindawi Publishing Corporation http://www.hindawi.com
Volume 2014
Journal of
Control Science and Engineering
Advances in
Civil Engineering Hindawi Publishing Corporation http://www.hindawi.com
Hindawi Publishing Corporation http://www.hindawi.com
Volume 2014
Volume 2014
Submit your manuscripts at http://www.hindawi.com Journal of
Journal of
Electrical and Computer Engineering
Robotics Hindawi Publishing Corporation http://www.hindawi.com
Hindawi Publishing Corporation http://www.hindawi.com
Volume 2014
Volume 2014
VLSI Design Advances in OptoElectronics
International Journal of
Navigation and Observation Hindawi Publishing Corporation http://www.hindawi.com
Volume 2014
Hindawi Publishing Corporation http://www.hindawi.com
Hindawi Publishing Corporation http://www.hindawi.com
Chemical Engineering Hindawi Publishing Corporation http://www.hindawi.com
Volume 2014
Volume 2014
Active and Passive Electronic Components
Antennas and Propagation Hindawi Publishing Corporation http://www.hindawi.com
Aerospace Engineering
Hindawi Publishing Corporation http://www.hindawi.com
Volume 2014
Hindawi Publishing Corporation http://www.hindawi.com
Volume 2014
Volume 2014
International Journal of
International Journal of
International Journal of
Modelling & Simulation in Engineering
Volume 2014
Hindawi Publishing Corporation http://www.hindawi.com
Volume 2014
Shock and Vibration Hindawi Publishing Corporation http://www.hindawi.com
Volume 2014
Advances in
Acoustics and Vibration Hindawi Publishing Corporation http://www.hindawi.com
Volume 2014