Cost Model Validation: A Technical and Cultural Approach Jairus Hihn
Leigh Rosenberg'
Kevin Roust
Keith Warfield
Jet Propulsion Laboratory' 4800 Oak Grove Drive Pasadena, CA 91 109
Abstract. This paper summarizes how JPL's Parametric Mission Cost Model (PMCM) has been validated using bo@ foqnal statistical methods and a variety of peer and management reviews in order to establish organizational acceptance of the cost model estimates. The need for statistical and also organizational validation is heightened when providing cost models and cost estimates in a concurrent engineering environment typical of the advanced design teams that exist at JPL 8s well as at other aerospace organizations, e.g. Aerospace Corporation and Goddard Space Flight Center.
Topics discussed include 1. Statistical Validation Approach and Results 2. Organizational Vaiidation (review) process and how it developed support and consensus for the model at an engineering and project management level 3. Discussion of how validation drove the shape and content of the model.
INTRODUCTION The Jet Propulsion Laboratory (JPL) in Pasadena, California is a US Government FederallyFunded Research and Development Center, which is run by the California Institute of Technology for the National Aeronautics and Space Administration (NASA). JPL's primary role is to build and operate unmanned, robotic space exploration missions throughout our solar system. From the period of the mid-1960's until 1992, there were 16 missions over the 29-year period. This number of completed missions required that about 5 to 10 prqmsals a year were produced. Since 1992, there has been a dramatic increase in the number of missions launched each year, there were six launches in 1998-99 alone. Instead of generating 5 to 10 proposals per year, JPL now produces 50 to 80. In addition these new missions are constantly changing their development processes as they evolve attempts at implementing "Faster, Better, Cheaper" (FBC). Factors that have made these recent missions more cost efficient are: increased inheritance fiom previous missions, reduced redundancy (increased risk), simplified documentation and reviews, and more work done in parallel during the development cycle. In the rush to implement FBC, it is now generally recognized that NASA and JPL have pushed the paradigm too far. However, today's missions are still designed, built, and operated differently than they were 20 years ago. .
- _. -
In 1995, as a way to deal with the large number of proposals being generated, JPL formed an Advanced Projects Design Team (APDT), called Team X. One of the fust issues that arose 1 The work described in this paper was performed at the Jet Propulsion Laboratory, California Institute of Technology under contract with the National Aeronautics and Space Administration.
related to the need for cost estimation models and processes that would work in a concurrent engineering environment and would provide ‘reliable’ cost estimates for JPL’s new missions. Secondly, with so many proposals there were times when a cost model was required that could be used without convening the entire 15-member Team X. A major problem was that usefbl historic data on which such models are typically constructed did not exist, since this new way of doing business was different than that of the past. Even the missions starting in 1992, which were FBC, had not all yet flown. For the subsystem cost models, the solution implemented was to use Mars Pathfinder data to parameterize their quasi-bottom up cost estimation process. The mission level parametric model presented a more difficult problem as a complete data set on a significant number of missions was required to be able-,to derive regression based Cost Estimating Relationships, CERs. For what was to become JPL’s PMCM the decision was made to use the results of previous Team X studies to derive the CERs. This meant that the CERs were a parametric model that reproduced the expert judgment contained within Team X. Of course, this raised a very critical question: Why should anyone trust a model not based on actual historical data? Actually, this question is a mandatory question for all CER’s. Addressing this question is especially important in an organizational context where project managers and non-cost experts must sign off on a proposal. The fundamental answer is that the model must be validated both statistically and organizationally and the results effectively communicated to all key customers. The remainder of this paper will primarily describe in detail how PMCM has been and continues to be validated at JPL. To better understand the validation process it is necessary to begin with a basic understanding of PMCM.
PROJECT MISSION COST MODEL The key features of the model are: Cost based on a system of equations that map to a full cost-accounting comprehensive work breakdown structure (WBS). Maximum of objective inputs that tie directly to design parameters. Prefer NO subjective inputs Model has to b.e accessible to engineers to support review and model buy-in. This means that CERs should be strictly linear unless reduction of R2 and F-stat are severe. Probabilistic inputs and outputs Data used to calibrate the model reflects the integration of historical data, detailed subsystem level models, subsystem level databases, and expert opinion based on an integrated fbll life cycle mission design.
Data. The current version of PMCM is based on 60 Team X studies. These studies include proposals and conceptual design studies for potential missions e.g.: Mercury Orbiter Comet Sample Return Jupiter Probe Neptune Orbiter Europa Orbiter and Lander
2
’
Jupiter Polar Flyby Asteroid Rendezvous Titan P r o b e s h d e r Solar Sail Venus Aerobot Io Volcanic Observer Pluto Lander WBS. The architecture for PMCM is a full cost-accounting comprehensive work breakdown structure (WBS). Obviously, at JPL this is adapted to space exploration (see Figure 1 for a standard Team X WBS with examples of the cost for a typical mission). The WBS is used as a template for capturirig d l Team X subsystem cost estimates
Wrappers. The following WBS elements are incorporated as percentages of the core model cost estimates. These are fkequently called wrap-around h c t i o n s or secondary relationships. These include: Project Management Outreach Mission Analysis & Engineering Science Team Spacecraft. Their input into relevant independent variables was g a t h d . Then these engiaeers qsisted the cost team in assembling a comprehensive database for each subsystem that included all possible technical parameters that could impact cost. The subsystems and elements that were assessed this way included: Attitude Control (ACS) (hardware & software) Command & Data Handing (CDH) (hardware & software) Telecommunications Power Propulsion Structures, Mechanisms, & Cabling Thermal Control Assembly, Test, Launch Operations A mapping of the design (input) parameters used for each of the spacecraft subsystems is provided in Tables 2a and 2b. In addition to the parameters swnmarized below there is a relatively simple mass based cost equation with fewer design parameters for each subsystem which provides increased cost model and tool flexibility. Both models forecast total costs equally well, but the version presented here is more descriptive and supports more sophisticated trade-off analysis. Payload. The payload instruments CERs in WBS 4.0 are a linear multivariate statistical model generated fiom 95 NASA payloads launched since 1988. Sixty-five randomly selected data points were used to generate the model; the remaining 30 points were used for validation. Inputs are all objective and cover designs ranging in size fiom about lkg to 2000kg and design life fiom weeks to over 8 years. The Payload model was validated several years ago and the results are presented in (Warfield and Roust, 1998). . .
3
. Cart Y 98 SM)
1.0 Project M8aage1neat 1.1 Pmwt Manager & Statt' I .2 Administration& Control 1.3 Mission Assurance 1.4 0u-h
1.5
launch Aowoval
2.2
2.3
Mission Anaivsis
4.1 4.2 4.3
4.4 4.5
-.
"
Payload Manapmmt Payiasd Ehgincaing Iartnumnt (inchding UT) Aerobor (incl decckntion system) Insallmaltcon-
23
-
3.0 Project & Mbrloa Engineering 3.1 Project Engineering
3.2
5.0 Incl A b 0 1 Incl A b o + Incl A b \
Science Investigators Science Teams Science Analysis
4.0 P8-
3.0 lncl A b 0 1 Incl Ab01 OS
2.0 science
2.1
sa
Fee
5.0 Carrier Spcecnft 5.1 SpacccraftSystcmManagement 5.2 S p a c d System Engineering 5.3 subsyskrns 5.3.1 Attitudtcontrd 5.3.2 Command & Data
2.6 Incl Abob Incl A b o b
5.3.4 5.3.5 5.3.6
423
oa 0.6 37.4
58 2.1
63 53 '52 7.4
Structum. Mechanisms, Cabli B YC Mechanical Build >
5.3.6.1
23
ThamalControl
2.2 0.6 02
s o h Launch Vehicle Adapter
odm
5.4
contract " g e m e n t
5.5
Con-
03
-
Fec
3.7
6.0 A T U ) 6.1 Integration & Test M m a p n m t & Planning 6.2 System Integration & l e s t 6.3 Launch Operations 6.4 Supptut Costs 6.5 Spacccratt Intearation & Test Suwoxt
8.8
7.0 "onOpcrrriolrr 7.1 Ops Maaagcmcnt & I n 7.2 Mission Operations Plan 7.3 GroundsottwarcDmlogpnart 7.4 Data Pmcessing 7.5 XauWh +30 Devs
L6
B0 . L.o.tL Vehick
G
Incl &VI lncl Ab0VI Incl A b o V I Incl AbOVl Incl h V I 1.2 0.8 5.6 0.6
0.4
148.7
h u c b Vctdda
a 0
Ruerwr @ 20%
Figure 2a - Model Input Summary
-
Projet T0t.l (mo LV, no m t m r )
226 29.7
Tobl prsicct Cast
-
X
a0
Propulsioa
5.3.7 5.3.8 5.3.9 5.3.10
Autonomous ACS Softwarr
62.0 7.2
T e I ~ S o n s PoWa
5.3.3
(YesMo)
79.1 05 1A
-
Figure 1 APDT WBS for a Sample Mission
4
No. of High Complexity SEP Propulsion (yes, no) Destination (Mercury/Sun, Jupiter/Pluto, Other) Cold Body Lander (yes, no) No. of Instruments Extra Stages (yes, no)
X X X X
R2
84.4 109
F-ratio
72.7 27.7
83.0 473
82.2 158
-
Figure 2b Model Input Summary VALIDATION PROCESS
The development and validation process utilized was as follows: 1. Subsystem CER Development and Validation a. Jointly develop list of design and cost parameters with respective subsystem engineers b. Develop Version 1 of CERs using linear regression analysis c. Review results with subsystem engineers to determine that parameter coefficients intuitively make sense. d. Revise CERs 2. Formal Validation of Total Mission Cost
a. Statistically validate that model estimates are consistent with actuals and with grass roots estimates for JPL Flight Projects and Phase A equivalent proposals
3. Major Stakeholder Review a. Conduct formal review of model by senior technical staff and managers b. Revise CERs c. Regression test CERs
5
Subsystem CER Development and Validation The first step was to interview the subsystem engineers in order to identifjr all key design parameters, which were considered to be significant cost drivers for each subsystem. At the end of the interviews, over 200 potential design based cost drivers had been identified and 55 potential studies. Of the 355 possible data point-subsystem combinations (7*55), only 72 were removed, yielding &om 28 to 5 1 records per subsystem. Most of the removed data points were removed because they were very large outliers with insufficient fiequency of occurrence to identiQ a cost driver that could explain the impact of the unusual technologies or environments: No subsystem: 19 Duplicate of included point: 24 Missing Cost Data: 13 Missing Technical Data: 1 UnusualTechnology: 7 (1 obscure CDH technology used in only one study, 1 CIS solar array, 1 thermalmechanical-electrical power generation, 2 HANITEAN propulsion, 2 secondgeneration micro-spacecraft structures) Unusual Environment: 2 (Thermal & C&DH on Venus Surface) Unusual Application: 1 (Propulsion system used only for inflation purposes) Early study that may not assume FBC processes: 3 0 Suspected data errors that could not be verified or corrected: 2 The 200 design parameters resulted in approximately 50 cost drivers. The initial subsystems CERs were derived using multivariate linear regression. Cost variables were selected based on an F-ratio > 10, an adjusted R2 > 75%, and a student t-ratio > 1.95 (5%). Variables whose direction was inconsistent with engineering principles were dropped. The next step was to review the individual, statistically derived CER’s with the cognizant subsystem engineers. This helped ensure the scientific foundation of the CER’s as well as helping to get the correct technical inputs for each CER. After the subsystem engineers reviewed their respective CERs it was decided to keep some design parameters with low t-ratios if the variable was a major design parameter and the coefficient was consistent with engineering judgment An example of the power subsystem CER results are displayed in tabular form in Figure 3 and graphically in Figure 4. While the subsystem engineer used many other variables in determining
his bottom-up cost estimate, it was found that these five variables explained 95% of the total variation in the data. These results were carefully reviewed and discussed between the cost modeler and the power subsystem engineer.. Note that the ‘Battery Only’ variable was kept in the equation even though it failed the 5% t-test.
6
.
Variable Constant Battery Only ~ r r a Area y (m') - Si Array Area (m') - GaAs Array Area (m') - Adv. Cells Number of GPHS
Coefficient $5,477 K - $4,149 K $ 253 K
440K 445K $4,854 K $ $
t-ra ti0 6.25 -1.77 4.14 4.9
Significance < o.Ooo1 0.0887 O.OOO4
22.8
< o.Ooo1 < o.oO01
13.7
o.oO01
Figure 3: Power Subsystem Final Regression Results
.
Advanced Cells "
~
Figure 4: Cost vs Solar Array Area by Cell Material Type FORMAL VALIDATION. After the review by the subsystem engineers, the second major step in the validation process was to come up with a number of recently completed JPL missions, and then to attempt to replicate the costs of these missions with the model. Unfortunately, insuflkient subsystem cost actuals were available to formally validate the model at the subsystem level. At the time this validation was completed even obtaining sufficient actual data at the spacecraft level was difficult. Hence, the main formal validation was conducted at the total mission cost level. Due to the small number of missions completed, several missions that were well into development were also included. The missions included are: Mars Pathfinder - completed rover mission on Mars (launched in 1996) Mars Global Surveyor - completed mapping of Mars (launched in 1996) DS-1 advanced technology demonstration (launched in 1998) Stardust comet sample return (launched in 1999)
-
-
7
Genesis - solar wind sample return (launches in 200 1) Cloudsat - measures the evolution galaxies (launches in 2001) Deep Impact - In Phase B. Also estimated the Impactor separately Inside Jupiter - In Phase A Cassini - last of the great spacecraft Mars 98 - two mission in one, an orbiter and a Polar Lander. Failed mission objectives c
Reference Mission
f Percentage difference
between actual costs and estimated costs -19.0%
Mission 1 Mission 2 IMission 3 Mission 4 Mission 5 Mission 6 Mission 7 IMission 8 Mission 9 Mission 10 Mission 11
-2.3%
I
-8.2%
I
-1.6% -5.5% 16.2% 53.1% 0.4%
I 1
I
23.2% 89.5% .
89.4% I
I
Mission 12
-45.6%
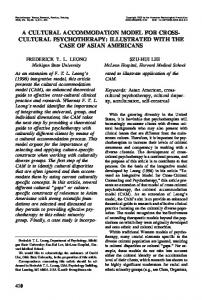
Figure 5: Percentage Comparison of PMCM estimate to ActuaUPIanned JPL Mission Cost Although, not representative of current JPL missions, the Cassini mission ( Mission 12) was added to the set for comparison purposes. The results suggest that Cassini while still very expensive by today’s standards (Cassini had 8 to 9 years in development with 500-700 work years of effort) would have cost 46% less than it did when originally developed in the late 80’s through early 90’s. The PMCM database contains missions with a maximum of 3 to 4 years in development. It might have been possible to develop Cassini under these conditions. A graphical version of the results is displayed in Figure 6. On the vertical axis of Figure 6 is the actual cost and on the horizontal axis is the model-estimated cost. If these matched exactly, they would fall on the diagonal line. Points above the diagonal designate missions for which the model under estimated the costs and points below the diagonal designate missions where the model over estimated the actual costs. The Cassini mission is not shown due to scaling problems in displaying the graph. Interestingly, the missions.whichfell the fkrthest below the line and which reveal a significant over estimate by the model are the two Mars 98 missions which failed. Constructing a formal statistical test is more difficult than it might appear because the data for the model was generated by JPL’s Team X and hence are all estimates - therefore it is unlikely
8
that the underlying data distributions for the model are the same as for the actuals. At this point however, we will test the ability of PMCM to predict the actual cost based on the following &Model-Est - Mission-Actuals))/n)/
o/(n)"'2
This is a t-test for whether the difference between the estimate and the actuals is zero and hence at a minimum provides a test of model estimates bias. Excluding the 3 missions which a-priori should be fiom a totally different population (Mission 10, 1 1 and Cassini) the results yield a mean difference of 0.5 ($500K)with a small sample standard deviation of 6.0 $M. Therefore, we accept the hypothesis that there is no significant difference between the model estimates and the actual mission costs. All 3 of the outlier missions are more then 3 standard deviations fiom the population meair and hence one should reject that they are fiom the same population.
Actual Cost vs PMCM Estimate 300
250 In PhasoCID In P h u e A Failed MissiaHn
200
COmpkted
150
100
50 0 0
50
100
150
200
250
300
Model Estimate (SM WOO) L
Figure 6: Actual Cost vs PMCM Estimate
Major Stakeholder Review The last step was to present these results to a formal review board made up of major JPL stakeholders in the estimation and mission development processes. The review board was chosen from systems engineers and managers at JPL who have had long-term flight project. experience. The objective of the review was to obtain support fiom the major stakeholders and also to make certain that major design parameter had been inadvertently left out. A 3-hour review was held in which the review board was walked through each major equation with
9
detailed explanations as to how the CERs were constructed and verified. To be able to conduct this type of review means a cost model must be relatively easy to understand and use. At the end of the review there were requests to analyze if three additional cost drivers could be added. PMCM APPLICATION
PMCM is used on a regular bases in Team X as back up estimate and to assess the reasonableness of the grass roots estimates for Discovery proposals in 1998 and 2000, as well as to evaluate other proposals. The results for the 2000 Discovery Step 1 are displayed in Figure 7. It is interesting to note that there is an average over estimate by the model of $19M with double the variation of that observed with the actuals, which differed by only $500K. This is consistent with the expectation that proposals will tend to underestimate to sell the proposed mission. Note also that there appears to be bias in the data in that a majority of the proposals under ran the model estimates. This differs from the actuals, which were evenly distributed between under and over model estimates. Porposal Grass Roots vs PMCM Estimate
Figure 7: Discovery Proposal Estimates vs PMCM Estimates
10
. FUTURE WORK
*
It is hoped that other companies that assess space mission costs will adopt similar techniques to those described in this paper. Lastly, it is recognized that once the modcl is validated it will enter a maintenance mode. In this mode, it will have to be updated and re-validated about once a year . so that it reflects the latest technology and cost data. Future validations .will be done at the spacecraft and subsystem level as the data becomes available. We are currently looking into the use of a technique known as boot strapping which is designed for dealing with estimation under conditions of small samples. It utilizes assumed information as to the shape sign of parameters in a regression equation. By adding in these constraints, less data is required in order to obtain _a 'good' estimated equation. Another concern that iemains is the incorporation of design parameters into cost estimating relationships that explicitly account for the impact of changes in one subsystem or element on other subsystems or elements. Related to this is the problem of characterizing correlation between WBS elements. This is an issue when peflorming Monte Carlo simulation since correlation impacts the spread of the resulting probability distribution. Future work will include these features including the construction of a correlation matrix based on each element's coefficient of determination with respect to every other element.
BIBLIOGRAPHY Draper, N. R., and Smith, H., Applied Regression Analysis, Second Edition, John Wiley & Sons,New York, N Y , 1981. Jet Propulsion Laboratory, JPL Flight Project and Financial WorvorceHistory, Jet Propulsion Laboratory, Pasadena, CA, 1998. Rosenberg, L.,Parametric Cost Modeling of Unmanned Space Projects when the Rules Have Just Changed, First Annual Joint ISPNSCEA Inteniitional Conference, Toronto, Ontario, CanahJune, 1998 Tulcey, J., Exploratory Data Analysis, Addison-Wesley, 1977. Warfield, Keith, and Roust, Kevin, The JPL Advanced Projects Design Team Space Instmment Cost Model: An Objective Multivariate Approach, Presented at First Annual Joint ISPNSCEA International Conference, Toronto, ON, Canada, June 1998.
11
. BIOGRAPHIES Name: Dr. Jairus M. Hihn Business Affiliation: Jet Propulsion Laboratory 4800 Oak Grove Drive Pasadena, CA 91 109 MS 301-180 Phone Number: (818) 354-1248 . Fax Number: (8 18) 393-9815 E-mail Address: -.
[email protected] Biography: J a i ~ Hihn s has a Ph D in Economics with principal application areas in econometrics and mathematical economics. His dissertation used Monte Carlo methods in developing an R&D project selection model. Jainrs is the lead sohare cost analyst at JPL. He has been providing cost estimation support to JPL's Deep Space Network and flight projects for the past ten years and more recently has been working with JPL's Advanced Projects Design Team, as well as developing mission level cost estimation models. Dr. Hihn was on the faculty at the University of California - Berkeley in the Department of Agricultural and Resource Economics where he co-developed a new statistical technique based on the semi-variance of a probability distribution for use in estimating agricultural production and income risks. He was the co-author on several papers, which formally applied catastrophe theory to the analysis of political instability in third world countries using both non-parametric and maximum likelihood methods. He has extensive experience in simulation and Monte Carlo methods with applications in the areas of decision analysis, institutional change, cost modeling, and process models. "
Name: Leigh Rosenberg Business Affiliation: Jet Propulsion Laboratory Biography: Leigh Rosenberg is a Senior Project Cost Analyst and the lead Advanced Projects Design Team cost engineer at JPL. He has worked at JPL in cost estimation and systems engineering for the last 23 years. He has created the DNP cost methodology and has coordinated the cost estimation of various competitive proposals including the Stardust project. He previously supervised the Project Engineering group of JPL's Systems Analysis section. Mr. Rosenberg has previously worked for the Federal Government at the Interstate Commerce Commission, and for the MITRE Corporation. He has an MS in Operations Research and Industrial Engineering fiom the University of Massachusetts and a BA in Mathematics from Queens College of the City University of New York. Name: Kevin Roust Business AffiliatiPn: Jet Propulsion Laboratory Biography: Kevin Roust is a Project Cost Analyst and a member of the Advanced Projects Design Team at JPL. He has a BS in economics from the Califmia Institute of Technology. Mr. Roust has been involved in cost tool development for the Advanced Projects Design Team, and other computer simulation design work for JPL's reengineering effort. Name: Keith Warfield Business Affiliation: Jet Propulsion Laboratory Biography: Keith Warfield is a Senior Project Cost Analyst at the Jet Propulsion Laboratory working with the Advanced Projects Design Team. He holds a B Sc in Engineering and Applied Science fiom the California Institute of Technology. Prior to his work as a cost analyst, Mr. Warfield worked for more than a decade in engineering roles on several science instruments including the Satellite Test of the Equivalence Principle, the Mars Observer Presswe Modulator In-d Radiometer, the Topex Microwave Radiometer, the UARS Microwave Limb Sounder, and particle detectors for the Stanford Linear Accelerator.
12