Cross-Categorization: A Method for Discovering Multiple Overlapping Clusterings
Vikash K. Mansinghka1,2 , Eric Jonas1,2 , Cap Petschulat1 , Beau Cronin1 , Patrick Shafto3 , Joshua B. Tenenbaum1 1 Navia Systems, Inc. 2 Massachusetts Institute of Technology 3 University of Louisville {vkm, jonas, cap, beau}@naviasystems.com,
[email protected],
[email protected]
Abstract Model-based clustering techniques, including inference in Dirichlet process mixture models, have difficulty when different dimensions are best explained by very different clusterings. We introduce cross-categorization, an unsupervised learning technique that overcomes this basic limitation. Based on MCMC inference in a novel nonparametric Bayesian model, cross-categorization automatically discovers the number of independent nonparametric Bayesian models needed to explain the data, using a separate Dirichlet process mixture model for each group in an inferred partition of the dimensions. Unlike a DP mixture, our model is exchangeable over both the rows of a heterogeneous data array (the samples) and the columns (new dimensions), and can model any dataset as the number of samples and dimensions both go to infinity. We demonstrate the efficiency and robustness of our algorithm, including experiments on the full Dartmouth Health Atlas dataset without any preprocessing, showing that it finds veridical causal structure.
1
Introduction
Clustering techniques are widely used in data analysis, for problems of segmentation in industry, exploratory analysis in science, and as a preprocessing step to improve performance of further processing (e.g. in distributed computing and in data compression). However, as datasets grow larger and noisier, the assumption that a single clustering (or distribution over clusterings) can account for all the variability in the observations [1] becomes less and less realistic. From a machine learning perspective, this is an unsupervised version of the feature selection problem: different subsets of measurements should, in general, induce different natural clusterings of the data. From a cognitive science and artificial intelligence perspective, this issue is reflected in work that seeks multiple representations of data instead of a single monolithic representation [2]. As a limiting case, a robust clustering method should be able to ignore an infinite number of uniformly random or perfectly deterministic measurements. The assumption that a single nonparametric model must explain all the dimensions is partly responsible for the accuracy issues Dirichlet process mixtures often encounter in high dimensional settings. DP mixture based classifiers (e.g. via class conditional density estimation [3]) highlight the problem: while a discriminative classifier can assign low weight to noisy or deterministic (and therefore irrelevant) dimensions, a generative model must explain them. If there are enough irrelevancies, it ignores the dimensions relevant to classification in the process. Combined with slow MCMC convergence, these difficulties have inhibited the use of nonparametric Bayesian methods in many applications. To overcome these limitations, we introduce cross-categorization, an unsupervised learning technique for clustering based on MCMC inference in a novel nested nonparametric Bayesian model. Our model can be viewed as a Dirichlet process mixture, over the dimensions (or columns), of Dirichlet process mixture models over sampled datapoints (or rows). Conditioned on a partition of the dimensions, our model reduces to an independent product of DP mixtures, but the partition of the dimensions (and therefore the number and domain of independent nonparametric Bayesian models) is also inferred from the data. Standard feature selection boils down to the case where the partition of dimensions has only 2 groups. We use MCMC because both model selection [4] and deterministic approximations [5] seem intractable, due to the combinatorial explosion of latent variables (with changing numbers of latent variables as the partition of the dimensions changes).
2
Model and Experiments
The hypothesis space captured by our model is super-exponentially larger than that of a Dirichlet process mixture, with a very different structure than a Hierarchical Dirichlet Process [6]. Our generative process, viewed as a model for heterogeneous data arrays with N rows, D columns of fixed type and values missing at random, can be described as follows: 1. For each dimension d ∈ D: (a) Generate hyperparameters λ~d from an appropriate hyper-prior. 1
(b) Generate the model assignment zd for dimension d from a Chinese restaurant process with hyperparameter α (with α from a vague hyperprior). 2. For each group g in the dimension partition {zd }: (a) For each sampled datapoint (or row) r ∈ R, generate a cluster assignment zrg from a Chinese restaurant process with hyperparameter αg (with αg from a vague hyperprior). (b) For each cluster c in the row partition for this group of dimensions {zdg }: i. For each dimension d, generate component model parameters θ~cd from an appropriate prior and λ~d . ii. For each data cell x(r,d) in this component (zrzd = c for d ∈ D), generate its value from an appropriate likelihood and θ~d . c
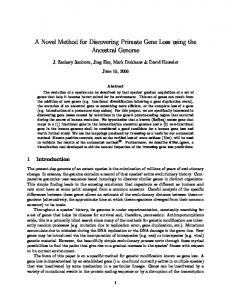
Our model encodes a very different inductive bias than the IBP [7], discovering independent systems of categories over heterogeneous data vectors, as opposed to features that are typically additively combined. It is also instructive to contrast the asymptotic capacity of our model with that of a Dirichlet process mixture. The DP mixture has arbitrarily large asymptotic capacity as the number of samples goes to infinity. Put differently, it can model any distribution over finite dimensional vectors given enough data. However, if the number of dimensions (or features) is taken to infinity, it is no longer asymptotically consistent: if we generate a sequence of datasets by sampling the first K1 dimensions from a mixture and then append K2 >> K1 dimensions that are constant valued (e.g. the price of tea in China), it will eventually be forced to model only those dimensions, ignoring the statistical structure in the first K1 . In contrast, our model has asymptotic capacity both in terms of the number of samples and the number of dimensions, and is infinitely exchangeable with respect to both quantities. As a consequence, it is self-consistent over the subset of variables measured, and can thus enjoy considerable robustness in the face of noisy, missing, and irrelevant measurements or confounding statistical signals. This should be especially helpful in demographic settings and in high-throughput biology, where noisy (or coherently covarying but orthogonal) measurements are the norm, and each data vector arises from multiple, independent generative processes in the world. Due to space constraints, we omit a detailed description of our MCMC inference algorithm and discuss all results in figure captions. Our algorithm was derived by starting with a general-purpose MCMC algorithm for probabilistic programs [8] and specializing three of the kernels. It scales linearly per iteration in the number of rows and columns (assuming a constant upper bound on the number of groups in all Chinese restaurant processes), and includes inference over all hyperparameters. 20000 0
inferred logscore
-20000 -40000 -60000 -80000 -100000 -120000 -140000 -20000
-15000
-10000 -5000 ground truth logscore
0
5000
Figure 1: (left) An assessment of convergence, showing inferred vs ground truth joint score for ∼1000 MCMC runs (200 iterations each) with varying dataset sizes (up to 512 by 512, requiring ∼1-10 minutes each) and true dimension groups. A strong majority of points fall near the ground truth dashed line, indicating reasonable convergence; perfect linearity is not expected, partly due to posterior uncertainty. (right) A preliminary comparison of the learning curves for cross-categorization and one-vs-all SVMs on synthetic 5-class classification, averaged over datasets generated from 10 dimensional Bernoulli mixtures. Future work will explore (1) the detailed mechanisms by which the latent variables introduced by our method (above those in a regular DP mixture) actually improve mixing performance, (2) massively parallel implementations exploiting the conditional independencies in our model, and (3) semisupervised or transductive prediction experiments, benchmarked against state-of-the-art discriminative methods. Because our method is essentially parameter free (e.g. with improper uniform hyperpriors), robust to noisy and/or irrelevant measurements generated by multiple interacting causes, and supports arbitrarily sparsely observed, heterogeneous data, it may be broadly applicable in exploratory data analysis. Additionally, the performance of our MCMC algorithm suggests that our approach to nesting latent variable models in a Dirichlet process over dimensions may be applied to generate robust, rapidly converging, cross-cutting variants of a wide variety of nonparametric Bayesian techniques. References. 1. Rasmussen. The Infinite Gaussian Mixture Model. NIPS 2000.
2
Figure 2: Results from 50 samples on a dataset of animals and their features, similar to [2]. (left) The coassignment matrix for dimensions, where cij = P r[zi = zj ], i.e. the probability that dimensions i and j share a common cause (and therefore are modeled by the same Dirichlet process mixture). Labels show the consensus dimension groups (probability > 0.75). These reflect attributes that share a common cause and thus covary, while the remainder of the matrix captures correlations between these discovered causes (e.g. mammals rarely have feathers or fly, ungulates are not predators, and so on). Each dimension group picks out a different cross-cutting categorization of the rows (e.g. vertebrates, birds, canines, ...; not shown). (right) One sample of one dimension group and its cross-cutting clustering, by habitat (air, land, and sea dwellers, plus outliers). “QoC Scores” 5 categories
“Long Term Care” 7 categories
“Hospice Care” 11 categories
“Home Care” 5 categories
“Specialist vs. PC” 10 categories
“Skilled Nursing” 18 categories
“Equipment” 7 categories
“Misc. Spending” 9 categories
Composite Quality Score
Medicare $ / Decedent on LTC
Medicare $ / Decedent on Hospice Care
Medicare $ / Decedent on Home Care
Ratio of Specialist to PC FTEs
SNF Beds / 1000 Decedents
Medicare $ / Decedent on Durable Equipment
Medicare $ / Decedent on Outpatient Care
AMI Score
Medicare $ / Decedent on Ambulance
Percent of Deaths Occurring in Hospice
Home Health Agency Visits / Decedent
Ratio of Specialist to PC Visits/ Decedent
SNF Days / Decedent
Durable Equipment Copay / Decedent
Medicare $ / Decedent on Other Care
CHF Score
Medicare Part B $ / Decedent on Procs.
Hospice Days / Decedent
Medicare Part B $ / Decedent on Imaging
Pneumonia Score
Medicare Part B $ / Decedent on Tests Medicare Part B $ / Decedent on Other Total Copay / Decedent Physician Services Copay / Decedent
Figure 3: Results on the Dartmouth Health Atlas, which contains 4273 hospitals by 74 variables, including quality scores and various spending measurements. We analyzed the data (∼1 hour for convergence) with no preprocessing or missing data imputation. Each box contains one consensus dimension group and the number of categories according to that group. In accordance with custom statistical analyses [9], we find no causal dependence between quality of care, hospital capacity, and spending, though each kind of measurement results in a different clustering of the hospitals. We also recover the cost structure of modern hospitals (e.g. increased long term care causes increased ambulence costs, likely due to an increase in at-home mishaps). Standard clustering methods miss most of this cross-cutting structure.
2. 3. 4. 5. 6. 7. 8. 9.
Shafto, Kemp, Mansinghka, Gordon, and Tenenbaum. Learning cross-cutting systems of categories. COGSCI 2006. Mansinghka, Roy, Rifkin, and Tenenbaum. AClass: An online algorithm for generative classification. AISTATS 2007. Ross and Zemel. Multiple-cause Vector Quantization. NIPS 2003. Blei and Jordan. Variational Inference in Dirichlet Process Mixture Models. Bayesian Analysis 2006. Teh, Jordan, Beal and Blei. Hierarchical Dirichlet Processes. JASA 2006. Griffiths and Ghahramani. The Indian Buffet Process. NIPS 2005. Goodman, Mansinghka, Roy, Bonawitz and Tenenbaum. Church: a language for generative models. UAI 2008. Gawande. The Cost Conundrum. The New Yorker. June 2009.
3