Abstract. We present a new way to test the applicability of Edward's statistical mechanics of powders using overlapping volume histograms. We use this method ...
Overlapping Histogram method for testing Edward’s Statistical Mechanics of Powders Sean McNamara, Patrick Richard, Sébastien Kiesgen de Richter, Gérard Le Caër, and Renaud Delannay Citation: AIP Conf. Proc. 1145, 465 (2009); doi: 10.1063/1.3179963 View online: http://dx.doi.org/10.1063/1.3179963 View Table of Contents: http://proceedings.aip.org/dbt/dbt.jsp?KEY=APCPCS&Volume=1145&Issue=1 Published by the AIP Publishing LLC.
Additional information on AIP Conf. Proc. Journal Homepage: http://proceedings.aip.org/ Journal Information: http://proceedings.aip.org/about/about_the_proceedings Top downloads: http://proceedings.aip.org/dbt/most_downloaded.jsp?KEY=APCPCS Information for Authors: http://proceedings.aip.org/authors/information_for_authors
Downloaded 15 Jul 2013 to 129.20.78.129. This article is copyrighted as indicated in the abstract. Reuse of AIP content is subject to the terms at: http://proceedings.aip.org/about/rights_permissions
Overlapping Histogram method for testing Edward’s Statistical Mechanics of Powders Sean McNamara, Patrick Richard, Sébastien Kiesgen de Richter, Gérard Le Caër and Renaud Delannay Institut de Physique de Rennes UMR UR1–CNRS 6251, Université de Rennes I, 35042 Rennes Cedex, FRANCE Abstract. We present a new way to test the applicability of Edward’s statistical mechanics of powders using overlapping volume histograms. We use this method to analyze data from numerical simulations and experiments of granular compaction. The volume histograms do indeed have the form predicted by the theory. This is a nontrivial success for the theory. We are also able to extract the entropy for a wide range of volumes. Keywords: compaction,statistical mechanics,compactivity PACS: 83.80.Fg, 81.05.Rm, 05.20.-y
INTRODUCTION
OVERLAPPING HISTOGRAMMETHOD
A theory of static granular materials [1] has been presented by Edwards and co-workers, based on statistical mechanics. In this theory, the energy U of a thermal system is replaced by the volume V of the packing. The entropy S is defined as the number of ways to obtain a packing with a given volume V. Finally, the compactivity X = ^7 is the analog of the temperature. This theory is potentially very powerful, but difficult to obtain quantitative predictions because the phase space of a granular packing is not known in detail. It is therefore impossible to perform the necessary phase-space integrals. The theory does provide a way to calculate X from volume fluctuations, and this has been done in several cases [6, 5]. But this is not a test of the theory, for this calculation could be done even if the theory were false; all that are needed are volume fluctuations. Other recent work has studied the free volume associated with each grain in a packing [7, 8, 9]. The distribution of these volumes is consistent with the theory. In this article, we present a way to test the theory based on overlapping volume histograms. The theory predicts that the ratio of the histograms must be an exponential in volume, that arises from the Boltzmann-like factor e~r'x present in the theory. Our results (both numerical and experimental) confirm that this factor is present.
The v o l u m e histogram The theory of Edwards defines the entropy S(V) as S(V)=log
[s[V-W(q)}Q(q)dq,
(1)
Here, q are the coordinates of the phase-space, and ^ ( q ) is a function that calculates the volume of each configuration. The function 0(q) selects those configurations that are mechanically stable. A direct evaluation of the integral in Eq. (1) is impossible because 0(q) is not known. The theory also postulates that repeatedly preparing a packing in the same way generates states from a “granular canonical ensemble”. This means that all possible states are not equally probable, but rather the states must be weighted by a Boltzmann-like factor. The probability 3? of realizing a state q is thus PX(q)
Z{X)
®(q),
(2)
The compactivity X is determined by the way the packing is prepared. Z(X) is included for normalization and is analogous to the partition function in standard statistical mechanics. It is important to realize that the appearance of the Boltzmann-like factor is a postulate of the theory. This is quite different from thermal statistical mechanics, where the Boltzmann factor arises from considering a system in contact with a heat bath. Let us calculate the density histogram, that is, the probability to observe a given volume V at a given compactivity X: Px{V)
=
[8[V-Tr(q)]&>x(q)dq,
CPl 145, Powders and Grains 2009, Proceedings of the 6 International Conference on Micromechanics of Granular Media edited by M. Nakagawa and S. Luding © 2009 American Institute of Physics 978-0-7354-0682-7/09/S25.00
465
Downloaded 15 Jul 2013 to 129.20.78.129. This article is copyrighted as indicated in the abstract. Reuse of AIP content is subject to the terms at: http://proceedings.aip.org/about/rights_permissions
f 8[V-W(q)\
z{x)
RESULTS
Q(q)dq. (3)
Granular Compaction
The d-function permits us to replace the W (q) with V in the exponential:
We obtain volume histograms from simulations and experiments of granular compaction. Grains are loaded into a container, and then subjected to a series of taps. The taps are temporally separated so that the pack ing comes to rest after each tap. One observes that the volume of the packing decreases, and then fluctuates about an equilibrium value. The system thus resembles a thermal system coming to, and then fluctuating about, an equilibrium energy. We thus measure the volume histogram during this equilibrium, giving pX(V). The compactivity X can be varied by changing the tapping strength. In this way, histograms for many different compactivities can be obtained.
p—VjX
Px{V)=
fs[V-W(q)]
z{x)
Q(q)dq.
(4)
Next, we pull out of the integral sign those quantities independent of q: p—VjX p—v /j\
Px(V) = — ZIX)
S[V- W(q)} 0(q) dq.
(5)
Finally, we recognize that the integral in this equation is the same as in Eq. (1): p— y jx
Px(V) =
-—-es{v). Z[X)
(6)
Numerical Results
Note that pX can be measured: on must simply repeat a procedure for generating a packing a large number of times, and form the histograms of the obtained volumes.
Numerical Method Our numerical model of granular compaction [3] re produces many of the macroscopic and microscopic fea tures of granular compaction [4]. N identical spheres of diameter D are placed in a rectangular domain with a flat bottom and periodic boundaries on the sides. The do main has a size of 16D in the horizontal directions, and is open at the top. There are N = 4096 particles, leading to a depth of approximately 16 particles. The simulation proceeds in two steps. First, the pack ing is dilated by multiplying the height of every grain by 1 + e . This models the expansion of a packing when it is thrown into the air by a tap. The parameter e con trols the strength of the tap. In the results presented here 0.01 ≤ e < 1. Second, the particles are moved downward using a Monte Carlo procedure.A random downward movement is proposed to a grain. If that movement would cause the grain to overlap another grain or the floor of the container, the movement is rejected, else it is accepted and the particle is moved. Then another movement is proposed to another particle. In this study, all particles are proposed an equal number of moves, depending on e.
Overlapping histograms The predicted distribution of volumes, Eq. (6), cannot be compared to observations because it contains the un known functions S(V) and Z(X). But let us suppose we measure the histogram for two different preparation pro cedures, and that the histograms overlap for some range of volumes. If X1 and X2 are the compactivities associ ated with each procedure, than the ratio of the histograms is an exponential in volume: PX 1{V)
f Z{X 2 ) \
Px2{V)
\Z(X1) J
VIX2-VIX1
(7)
If one plots the ratio logarithmically, the theory predicts a straight line. Furthermore 1/X2 -1/X 1 will be given by the slope of the line, enabling us to determine X up to an additive constant. When X has been determined, we can then calculate S(V) from the shape of the histograms. Considering two different volumes V1 and V2 at the same compactivity X leads to: pX(V1)e-V1/XeS(V1) Dv(V2) P~V2IXpS{V2)
(8)
Results
From this relation, one can obtain S(V) up to an additive constant.
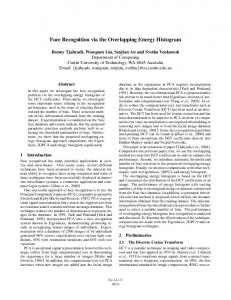
In Fig. 1 we show the volume histograms obtained for several different values of e. It is quite easy to obtain overlapping histograms. Then, the ratio in Eq. (7) can be constructed, and plotted. Some of the results are shown
466
Downloaded 15 Jul 2013 to 129.20.78.129. This article is copyrighted as indicated in the abstract. Reuse of AIP content is subject to the terms at: http://proceedings.aip.org/about/rights_permissions
-1
6
10 10
2 10
0 -2
10-
-4 -5
10 3650
3700
V/D
3750 3
3800
FIGURE 3. Logarithmic graphs of the ratio in Eq. (7), obtained from the experimental data. The legend gives the values of r used to obtain the histograms. The inverse solid fraction 1/v is used to calculate a dimensionless volume.
FIGURE 1. Histograms of volume obtained from the numerical simulation, for ^/E ranging from 0.2 to 0.4 with steps of 0.02. Their nearly parabolic shape indicates that they are well approximated by Gaussians. 10
Experimental Results Experimental Method
5
The numerical results were complemented by an experimental study. We have used the experimental setup to obtain earlier results on granular compaction [2,3]. Glass beads with a diameter of about a millimeter are placed in a glass cylinder with a diameter of approximately 10 cm. Each tap consists of a single cycle of a sine wave with frequency 30 Hz. The tap strength is measured by r, the ratio of the maximum acceleration of the cylinder to gravity. The taps are separated by at least one second. The packing fraction is measured by y-ray absorption.
0
-5
3680
3690
3700
3710
3720
3730
3740
V/D FIGURE 2. Logarithmic graphs of the ratio in Eq. (7), obtained from the histograms in Fig. 1, for three different values of i / e , given in the legend.
Results
in Fig. 2. As one can see, exponentials in V are obtained, in agreement with the theory. The appropriateness of the fit was estimated by calculating the %2 statistic of the fit. All fits had X2/n < 1 .6, where n is the number of fitted points. The error bars on the points are determined by the number of points in each bin of the histogram, and a decorrelation time needed to estimate the number of independent measurements. The decorrelation time is close to one tap, except at very small e.
Results were obtained for four different tapping amplitudes: r = 3.15, 4.20, 5.25, and 6.30. To carry out the analysis, we calculated a dimensionless volume 1/v, where v is the solid fraction. Constructing the ratio in Eq. (7) leads to straight lines, as shown in Fig. 3. In Fig. 4, we show the entropy as a function of 1/v. It can be calculated in two ways: either by integrating the “granular thermodynamic” relation X = ^ , or from Eq. (8). It should be noted that the V in the thermodynamic relation is the average equilibrium value. Thus the first method gives access to the entropy only for a small range of volumes. On the other hand, the second method allows us to calculate S for all volumes where a histogram is non-zero. Thus the dotted line in Fig. 4 covers a much wider range than the solid line. Another striking feature of Fig. (4) is that the entropy
467
Downloaded 15 Jul 2013 to 129.20.78.129. This article is copyrighted as indicated in the abstract. Reuse of AIP content is subject to the terms at: http://proceedings.aip.org/about/rights_permissions
1
1
1
'
1
'
J.- - - L
1
'
\N-_\
/ // / /I 1 1 1 1 1 1 1
1
\
'
\\ \
I
hold. Our result therefore implies nothing about the “ergodicity” of the fluctuations, but they do show that Q(q) is independent of X, i.e. that the probability a state is realized depends on X only through the factor e-V/X.
s
\\
/
ACKNOWLEDGMENTS Integration Histograms
We thank the Institut für Computerphysik at the University of Stuttgart for computer time. We acknowledge funding from the French ministry of education and research (ACI énergie et conception durable ECD035 – Verres de grains).
// 1 1
/ \ 1.62 /
1.61
1
1.63
,
1
,
1
1
1.64
1.65
1.66
,
1
,
1.67
1.68
1/v FIGURE 4. The entropy as a function of inverse volume fraction. The solid line gives the entropy calculated from X = 4S, whereas the dotted line gives the result of Eq. (8).
REFERENCES
has a maximum. This leads to a negative compactivity at volumes greater than this maximum. Physically, the existence of a maximum is expected. At very low volumes (high densities), the number of states is small because one must satisfy many constraints to pack a large number of spheres into a small volume. At high volumes, the number of states should also be low, because constructing a very loose but mechanically stable packing is a very delicate task.
CONCLUSION Our results show that the probability of realizing the packing at a given density has the form predicted by the theory, i.e. Eq. (6). This is a nontrivial finding, because the form of Eq. (6) is quite special. The probability is a function of V with a parameter X, and can be factored into three parts: a function of V (but not of X), a function of X (but not of V), and the exponential e-V/X. It is quite easy to construct other functions that do not have this form. Furthermore, overlapping histograms can be applied in other situations to test the theory. All that is needed are the histograms of volume for different preparations of the packing. On the other hand, certain other aspects of the theory are not checked by this method. For example, one often reads that the theory assumes that every possible configuration with same volume is equally likely. Our method does not test this statement, because it does not probe the phase-space at a detailed level. If this assumption were false and different equi-volume states had different probabilities, these different probabilities could be absorbed into the function Q(q) in Eq. (1), and Eq. (6) would still
1. S.F. Edwards and R.B.S. Oakshott, Physica A 157 1080 (1989). 2. P. Ribière, P. Richard, P. Philippe, D. Bideau, and R. Delannay, Eur. Phys. J. E 22 249 (2007). 3. P. Philippe and D. Bideau, Phys. Rev. E 63 051304 (2001). 4. P. Ribière, Etude de la compaction des milieux granulaires: de l’échelle locale à l’échelle globale, Ph.D. Thesis, Université de Rennes 1 (2005). 5. E.R. Nowak, J.B. Knight, E. Ben-Naim, H.M. Jaeger, and S.R. Nagel, Phys. Rev. E 57 1971 (1998). 6. M. Schröter, D.I. Goldman, and H.L. Swinney, Phys. Rev. E 71 030301 (2005). 7. F. da Cruz, F. Lechenault, and O. Dauchot, in Powders and Grains 2005, R. García-Rojo, H.J. Herrmann and S. McNamara, eds, (Taylor & Francis, London) (2005) 8. F. Lechenault, F. da Cruz, O. Dauchot, and E. Bertin, J. Stat. Mech.: Theory and Experiment 2006 1742 (2006) 9. T. Aste and T. Di Matteo, Phys Rev E 77 021309 (2008).
468
Downloaded 15 Jul 2013 to 129.20.78.129. This article is copyrighted as indicated in the abstract. Reuse of AIP content is subject to the terms at: http://proceedings.aip.org/about/rights_permissions