Horace and Brian don't like cold weather sports. What is each person's favorite sport? Figure 1. Sample from Harnadek (1978), adapted with permission. Cueing ...
EUROPEAN JOURNAL OF BEHAVIOR ANALYSIS
2003, 4 , 31 - 43
NUMBER 1 & 2 (2003)
31
Cueing and Logical Problem Solving in Brain Trauma Rehabilitation: Frequency Patterns in Clinician and Patient Behaviors Charles T. Merbitz1*, Trudy K. Miller2 and Nancy K. Hansen1 1
Institute of Psychoiogy, Illinois Institute of Technology, Chicago, Illinois, USA Rehabilitation institute of Chicago, Department of Communicative Disorders, Chicago, Illinois, USA
2
Frequencies (count per minute) of patient and therapist behaviors during rehabilitation sessions after traumatic brain injury were tracked in order to evaluate an intervention curriculum and the effects of cueing. Frequencies of correct solutions to logical problems and other verbal tasks during speech-language treatments were measured for an adult male with memory impairments and impulsivity who underwent inpatient rehabilitation 14 months after severe traumatic brain injury, Daily frequency of cues by the clinician during the patient’s logic exercises also was measured. These behaviors were recorded each treatment session for 14 weeks. Simple plots of the behavior frequencies were maintained by the clinician on standardized semi-log graph paper. The patient’s performance in solving logical problems improved measurably but gradually. Day-to-day predictability of patient performance was seen, as was predictability in cueing by the clinician. Celerations (trends measured as changes in count per minute per week) in the clinician’s cueing were inversely related to celerations in the patient’s logical problem solving, a pattern evident through multiple reversals. Data from other verbal performance tasks showed no general improvement, nor any pattern of variability paralleling the data on logical problem solving. The data suggest that, for clients with brain trauma, routine continuous measurement of frequencies of behavior may facilitate clinical application of experimental analysis and intervention techniques to improve performance. Measuring the frequency of clinician behavior can help identify the events and conditions that control aspects of patient behavior. Frequency measurement has also been used in physical therapy and occupational therapy, and it is suggested that this method be examined as a common data language for use across rehabilitation disciplines. Copyright © 2000 John Wiley & Sons, Ltd.
hampered by the paucity of controlled research on treatment efficacy after TBI, which in turn is partially due to the diversity of this population. Heterogeneity in impairment, intervention curricula, and implementation strategies in TBI rehabilitation substantially reduce the utility of traditional between-groups inferential statistics. With these concerns in mind for TBI as well as other disabling conditions, single-subject designs have been increasingly recommended for measuring rehabilitation processes and outcomes (Gonnella, 1989; Sohlberg & Mateer, 1989; Backman, Harris, Chisholm, & Monette, 1997; Michaud, 1995; Ottenbacher, 1990; Mozzoni & Bailey, 1996;
Following severe traumatic brain injury (TBI), persons undergoing rehabilitation are often characterized as having problems with impulse control, judgement, attention and concentration, error monitoring and utilization, and consistency (Hanlon, 1994; Willer, Allen, Liss, & Zicht, 1991; Dixon, & Layton, 1999). Behavioral excesses, such as irritability and agitation, and behavioral deficits, such as poor initiation and sluggishness, are commonly described (Prigatano, 1992; Lezak, 1978). These difficulties can interfere with a patient’s participation in treatment and ability to benefit from instruction. Service delivery is also Originally Published in Behavioral Interventions, 15, 169-187 (2000). Republished by Permission.
31
32
Charles T. Merbitz,Trudy K. Miller and Nancy K. Hansen
Merbitz, 1996; Hansen, 1999; Wilson, Emslie, Quirk, & Evans, 1999). Clinicians who use an empirical approach (Bernard, 1957) implicitly use single-subject designs to manage the day-to-day flow of treatment events for each patient. A difficulty in using these designs is that any inconsistency of performance interferes with assessing the effects of changes in treatment, because the logic of these designs rests on predicting what the subject’s behavior would have been if no changes were made in the program; thus baseline data usually are gathered until a stable level of performance can be inferred. ‘Precision Teaching’ (Lindsley, 1992; Pennypacker, Koenig, & Lindsley, 1972; Carr & Williams, 1982), a standardized behavioral measurementand-display system for experimental analysis, facilitates the detection of change in rate of change, and thus is well suited for circumstances where some change may be expected. This of course is the situation found in both education and rehabilitation, in which developmental processes, spontaneous recovery, or progressive decline create ‘moving baselines’. The Precision Teaching system provides rapid data plotting of daily behavioral frequencies and the standardization permits quick visualization of trends, variability, and effects of interventions. The time-line on the x-axis of the standardized graphs is ‘real time’, not ‘sessions’. Accurate tracking and prediction of behavior can be used to empirically adjust ongoing treatment, thus maximizing the effectiveness of treatment by titrating interventions to produce movement toward desired outcomes. It also can provide a robust method for measuring functional change without resorting to ordinal instruments (Merbitz, Morris, & Grip, 1989; Merbitz, 1996). Better reasoning, memory, and/or attention skills are common goals for rehabilitation of persons with brain injury (Sohlberg & Mateer, 1989; Hanlon, 1994; Williamson, Scott, & Adams, 1996). Verbal exercises that require the use of logic to find the solution to a problem are a common vehicle for working with these deficits (von Cramon & Matthes-von Cramon, 1990, cited in Hanlon, 1994; Wood, 1994; Williamson et al., 1996). Further, it is common for clinicians to use verbal and non-verbal cues or prompts to assist
patients in solving these problems (Wood, 1994), and a reduction in the amount of cueing as treatment progresses is desired. The present study is a report of findings applying the Precision Teaching method to interventions for one patient undergoing rehabilitation after severe TBI. We applied this data gathering and display system to elements of speech-language treatment, which included verbally mediated problem-solving exercises and cueing provided by the clinician, in order to track the interaction of patient and clinician behaviors throughout treatment so that the treatment could be adjusted as needed to maintain progress. Method Participant
Patient AB81 was a 20-year-old white male who sustained a severe TBI (closed head injury) in a motorcycle accident approximately 14 months prior to the collection of these data. His injuries also included fractures of the right humerus, left clavicle, and left wrist. He presented with a subdural hematoma and a right frontal craniotomy was performed. Computerized tomography revealed a small chronic right subdural hematoma and bilateral cerebral atrophy. At admission to the Brain Trauma Program 12 months post-trauma, his problems included left hemiparesis, a left lower extremity contracture, aggressive behavior, a short attention span, and poor impulse control. Neuropsychological evaluation suggested diffuse cortical and subcortical impairment. Deficits were noted throughout the battery of cognitive functions and the prognosis for marked improvement was guarded. Speechlanguage evaluation revealed moderate cognitive and communicative deficits associated with brain injury and a mild spastic dysarthria. His medication regimen included 200 mg of Tegretol TID, later increased to 300 mg. Procedures: Speech-Language Treatment Program, and Process Measurement
After initial testing, a speech-language treatment program was established and data were collected on deductive reasoning, as well as categorical naming and reading comprehension, in
Cueing and Logical Problem Solving in Brain Trauma Rehabilitation
individual treatment sessions with an experienced speech-language pathologist (MA, CCC-SP). A Masters level speech pathology student acted as the observer for the first 40 days of data collection and the clinician both recorded data and conducted the sessions thereafter. ‘Mind Benders’ Deductive Logic Exercises
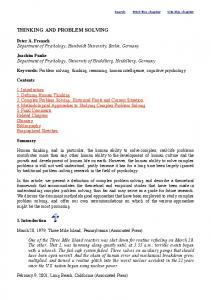
The curriculum for the deductive reasoning therapy was based on books A1 and A2 of the ‘Mind Benders’ series (Harnadek, 1978). These exercises each give several statements of facts and relationships from which the patient is to deduce other unstated relationships by matching the known elements from lists provided until the unknown relationships are revealed. Figure 1 illustrates a sample ‘Mind Bender’. A set of 22 ‘ Mind Benders’ was selected which appeared relatively homogeneous in difficulty, based on the experimenters’ clinical judgement, and contained only three or four elements from which relationships were to be deduced. Two exercises per day were presented, so that the problems were recycled just over three times during the 95 calendar days reported here. Cues
When the patient paused or gave an incorrect response or a partial correct response, the clinician provided cues or hints that were intended to help the patient learn how to arrive at the correct Mindbenders - A1
33
solution. These cues could be statements that contradicted an incorrect inference, affirmed or ‘reinforced’ a correct inference, identified a specific fact, or modeled correct behavior. The clinician was sensitive to the issue of overcueing and made efforts to keep cues to a minimum all through the treatment. Cues were tallied as they occurred. When the clinician (rather than the student assistant) began counting cues after day 49, an effort was made to limit cues to a maximum of one cue per ‘Mind Bender’ for the balance of the study. Precision Teaching Behavior Measurement
Direct, objective measurement of cueing and correct logical inference was accomplished by applying the Precision Teaching methodology. The patient’s work on each problem was timed with a stopwatch, and correct and incorrect statements of inference about the problem were counted. Cues were also counted for each problem. The count of each behavior (correct inferences, errors, and cues) divided by the time in minutes provided the average frequency of occurrence for each. Average frequency (count of behavior divided by unit time) reflects fundamental dimensional quantities of behavior (Merbitz, 1996; Johnston & Pennypacker, 1980) and provides a continuous, direct measure of behavior. Average daily frequencies of all behaviors were plotted by the clinician on Standard
DEDUCTIVE Thinking Skills
6.
The favorite sports of Brian, Horace, Ian, and Tammy are baseball, hiking, iceskating, and tennis. 1. No person's name begins with the same letter as his or her favorite sport.
2. Tammy and Horace don't like team sports. 3. Horace and Brian don't like cold weather sports. What is each person's favorite sport? Figure 1. Sample from Harnadek (1978), adapted with permission.
34
Charles T. Merbitz,Trudy K. Miller and Nancy K. Hansen
Celeration Charts (SC charts), which are 8 ½ “ x 11” semilog graphs standardized for display of behavioral data (Pennypacker et al., 1972; Lindsley, 1992, 1994). In Precision Teaching, behavior frequencies are plotted by calendar day (i.e. the ‘real time’ axis), and trends in frequency as the patient learns are described by a line of best fit through the data points representing multiple days. The term ‘celeration’ (with the prefix ac- or de- depending on the direction of change, defined as count per unit time per unit time) is used to designate these lines. Celerations can be fitted by a least-squares formula or by a graphical ‘quarterintercept’ method with generally equal accuracy (Koenig, 1972). Celerations are easily seen on the SC chart, and the dispersion of data points around a celeration line is a measure of variability. Clinicially, the celeration line drawn through previously collected data points summarizes progress to date, while the projection of the celeration line into the future (across days on the SC chart) predicts what progress is most likely to be seen if no causal factors change. Then the treatment program can be maintained if predicted progress is good, or it can be changed in an effort to improve upon the predicted progress. After a changed treatment is imposed and data are collected for several days, a clinician may draw a new celeration line covering the days under the new treatment and compare the obtained line with the earlier prediction. Note that three types of celeration implied by this logic are used, and they may be distinguished by the span of days covered and by the type of clinical control that is exerted. The first type, ‘overall’ celerations, are fitted over the entire course of treatment to estimate the total benefit or change seen. The second type, ‘event-following’ celerations, begin after a known event, such as a new phase of treatment, and continue as long as that new phase is in effect, Drawing these celerations allows the clinician to track and assess the behavior frequencies associated with each planned change within an extended period of treatment, for example after an adjustment in the delivery of an intervention, or after the patient moves to another environment. Finally, ‘trend-following’ celeration, are drawn to demarcate observed changes in celeration that are
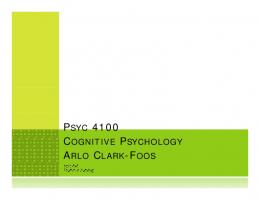
not associated with known events; this analysis can facilitate the search for sources of influence that the clinician may want to remove, or to replicate in the case of positive unexpected changes in the patient’s behavior. Thus, celeration (counts per minute per week) was the general expression of dynamic change in behavior used in this study, and was graphically represented as a line of best fit drawn through a given collection of frequency data points. All SC charts in the present study were ‘synchronized’ to the same starting day, so that day numbers correspond exactly across SC charts. Data plots were reviewed at least weekly over the course of treatment at a routine meeting of the first two authors. Results Figure 2 shows the patient’s frequency of correct inferences per minute for each of the 22 problems in the set, during the first and third times he cycled through the set (over the course of 95 calendar days). Cycle 2 fell between the others and was omitted for clarity, and cycle 4 was not complete at discharge. Note that the ‘overall’ celeration seen in cycle 1 was substantially repeated in cycle 3, with an acceleration in frequency of correct inferences from the beginning to end of the set in each cycle. Thus, acceleration occurred prior to the repetition of any of the Mindbender problems, and continued at approximately the same rate during recycling of the set. Also note that the patient had similar patterns of correct inferences for the same problems in cycle 1 when each was repeated in cycle 3, i.e. some problems appear to have been consistently easier or harder for him compared to others. There was also a generally higher frequency level of correct inferences in cycle 3 compared to cycle 1; although memorization of answers cannot be ruled out, there were at least 17 calendar days between any two successive presentations of a problem from cycle 1 to 2, and at least 38 days between the presentations of problems from cycle 1 to 3, and this patient was assessed as having severe memory deficits. Figure 3 shows frequency of correct inferences on one of the two problems presented
Cueing and Logical Problem Solving in Brain Trauma Rehabilitation
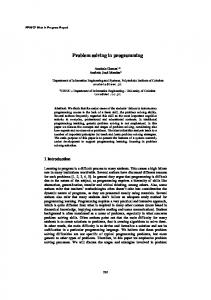
each day of treatment plotted on a computerdrawn SC chart. (Computer-drawn charts are substituted for the original hand-plotted SC charts to facilitate print reproduction, Note that over days 65-77, the task was not presented.) Each day’s representative performance was chosen by selecting the best performance on one of the two problems presented that day. The best was used because theoretically the impact of most extraneous variables, such as distracting noises from outside of the treatment area etc., would degrade rather than enhance performance. Summary data reflecting both performances were also routinely plotted and monitored, but are omitted from this report for the sake of brevity. Errors occurred rarely, so error frequencies are omitted from Figures 3 trough 5. It is conventional in Precision Teaching to plot and show ‘floors’ (the amount of time spent on a task) and to connect the data points on adjacent days. These conventions are omitted here to reduce visual clutter. Figure 3 is presented with ‘trend-following’ celeration lines. These were drawn because pat-
35
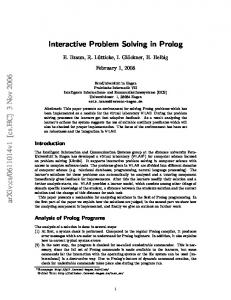
terns of change in the patient’s frequency of correct inferences were occurring in the absence of planned changes in the intervention. Visualizing the pattern led to a closer inspection of data on the cueing behavior of the clinician. Figure 4 shows cues per minute given by the clinician, with ‘trend-following’ celerations plotted as in Figure 3. Note the pattern of variability in weeks 2 and 5 as contrasted with weeks 1, 3 and 4 in Figure 4. Week 2 in particular shows peak cue frequencies on Monday, Wednesday, and Friday. After day 49, cues were given at a maximum of one per problem and a change was made to counting by the clinician instead of an observer. Figure 5 shows the superimposed ‘trend-following’ celeration lines of the patient’s correct inferences and the clinician’s cues, and thus reveals the striking relationship between the two types of behavior. Note that the pairs of celeration lines reversed direction multiple times between day 1 and day 49 while maintaining the inverse relationship. Frequency of cues decreased while
Figure 2. Frequencies of correct inferences on the first and third cycles through Mindbender problems 1 - 22.
36
Charles T. Merbitz,Trudy K. Miller and Nancy K. Hansen
frequency of correct responses increased, and vice versa. In the two weeks immediately following cue reduction on day 49, rate of correct inferences fluctuated. In the last four weeks of treatment, correct inferences showed a steady acceleration while the clinician continued to restrict cueing. Figure 6 displays data from baseline behavior on another type of verbal performance of this patient, collected during the same speech-language sessions. It shows frequency of correct responses given by the patient during controlled oral word association (‘categorical naming’) in which the clinician gave the name of a category or class of objects and the patient provided as many examples of class membership as possible within the time limit (one minute). Also shown are the errors (category examples repeated) during the task, and the reciprocal of the amount of time taken for the task each session (i.e. the ‘floor’).
Halfway through the study, the floor was raised (i.e. the patient was timed for a shorter period) because it was suspected that performance was affected by fatigue and problems with sustained attention. Performance improved slightly after this, with a ‘jump up’ in frequency but no change in celeration. On two occasions, marked with arrows, the floor was dropped to test endurance; rate of performance dropped again during these probes. Aside from testing the effects of a shorter versus longer timing period, no intervention was implemented for this task. The data shown in this figure were examined as a ‘reference behavior’ for each day of the study, to examine the possibility of events producing a common source of variability across behavior types, and to search for ‘overall’ celeration trends that might suggest spontaneous recovery or practice effects, in the absence of intervention. Variability may arise after events such as medication
Figure 3. Overall and trend-following celerations on correct inferences. After day 49 (denoted by the vertical phase line) the clinician substantially reduced cueing. Note the reversals in correct celerations.
Cueing and Logical Problem Solving in Brain Trauma Rehabilitation
adjustments, illness, or some change in the patient’s environment that affected him or her on a given day of days. An examination of this patient’s data in Figures 3 and 6 shows no apparent correlation in patterns of variability to suggest a common source of effect. Furthermore, no overall acceleration was observed in this reference behavior, indicating that it was not affected by spontaneous recovery or by the opportunity to repeat the task multiple times. Reading comprehension was targeted for intervention during the same time period, but no effects of treatment were shown, and the data are not presented here in the, interest of brevity, Discussion Since the present study was not a rigorously controlled experiment, interpretations must be made with caution, and, since it was a single-sub-
37
ject study, limits to generality must be noted. However, examination of these data reveals that this 1 year post-injury patient with TBI improved his performance on ‘Mind Bender’ logic problems. We did not examine logic in other contexts and thus have no measure of generalization of the effect across settings or to ‘real life’ problems. See Parente, Twum, and Zottan (1994) for a discussion of problems encountered in cognitive rehabilitation research related to transfer and or generalization of learning. In the present study, measurement and SC charting of frequency data facilitated the testing of an- intervention strategy, and future research can use frequency data to compare patients’ performances with different material and in different settings, to test transfer and generalization. Three possibilities for the observed improvement of this patient in this setting are; (1) increased logical reasoning as a result of spontaneous re-
Figure 4. Trend-following celerations and cue frecuencies. After day 49 (denoted by the vertical phase line) the clinician substantially reduced cueing.
38
Charles T. Merbitz,Trudy K. Miller and Nancy K. Hansen
covery; (2) increased logical reasoning as a result of the intervention; and (3) practice effects specific to this task and its set of problems and answers. While the data do not permit us to choose between these alternatives without ambiguity, the patient’s performance on another verbal behavior (the word association task) does not indicate a benefit from spontaneous recovery or practice. Some further interpretations of these data (presented in the following paragraph) rest on the accuracy of the celeration lines. With larger data sets, a least-squares line of best fit can be calculated (Backman et al., 1997). When celeration lines are derived from too small a number of data points to perform this calculation (e.g. three to five data points in a week), celeration lines can be estimated. More confidence may be felt when the data points fit closely on a straight line than when there is wide variability. ‘Trend-following’
celeration lines are especially problematic, since judgements as to the place where the trends break must be made. Since the ‘trend-following’ celerations were estimated for the present data, it is suggested that readers modify any of the celeration lines, and then form alternative interpretations and check them against the data. Frequency measurement provides a framework in which to explore the responses of, a given patient to a given set of antecedents and consequences, including patterns of cueing. With respect to cueing, Figures 3 through 5 showed the celerations in the patient’s correct performance frequency as having a generally inverse relationship to the celerations in clinician frequency. The patient-therapist dyad appeared to move as a unit in patterns that extended over multiple sessions. Two variables may fluctuate as a function of some third variable related to both or by coincidence. However, in this case the pattern of data
Figure 5. Trend-following celerations of correct inferences and cues. After day 49 the clinician substantially reduced cueing. Note the inverse relationship between cue and correct inference celerations.
Cueing and Logical Problem Solving in Brain Trauma Rehabilitation
on the two variables seemed to have been specific to the ‘Mind Bender’ logic exercises since the celerations in Figure 6 for the categorical naming activity show no such relationship to either of the other two. It also seems unlikely that these multiple reversals of direction were produced by chance. Thus, the behavior does not appear to have been driven by some general third variable, or by random inconsistencies, but rather seems to have been a function of events in the ‘Mind Benders’ treatment activities. Correct inferences and cueing appear to have had reciprocal effects. Modifying the celeration lines in an attempt to improve their fit to the data does not seem to substantially change the patterns of reversals. That the behavior of a patient with severe traumatic brain injury varied systematically according to antecedents and consequences is of
39
special interest given the oft-noted difficulties of TBI patients in profiting from experience (e.g. Damasio & Anderson, 1993). The inverse relationship between cues and patient’s responses suggests that clinician cues may have controlled patient correct responses, and/or that the patient’s responses controlled the therapist’s cueing behavior. Circumstances prevented the experimental application of cueing and cue reduction several times to definitively address this question, but one possible scenario for the inverse cueing-performance pattern is that if the patient is silent and looks puzzled long enough, or if he offers an incorrect answer, a cue will be forthcoming. In this scenario, the patient’s silence or incorrect response is reinforced by the clinician’s cueing, while in turn this cueing is put on a progressively leaner schedule of reinforcement by correct responses. As days progress the clinician cues more and
Figure 6. Standard Celeration Chart showing the frequencies of correct items given by the patient in the Categorical Naming exercise over the course of treatment. Floors are shown as dashes. Arrows indicate probe days testing the efects of returning to the one minute performance.
40
Charles T. Merbitz,Trudy K. Miller and Nancy K. Hansen
more in an effort to improve the patient’s performance or be more helpful, while the patient responds correctly less and less frequently. Eventually the clinician may recognize overcueing and reduces cues, driving the pair in the opposite direction. It has been observed (Parker & Crawford, 1992) that patients with severe TBI may be able to complete complex activity only with cues at each step. However, without measurement and analysis of celerations for both patient and clinician, it seems that it would be difficult to determine when overcueing occurs for a particular patient. The results of this study suggest that counting and graphing the clinician’s daily cue frequency and patient’s behavior frequencies would allow the clinician to determine empirically when cueing is assisting versus hindering patient performance. An experimental analysis of treatment variants, such as cueing, with each patient could validate the utility of treatment for that patient. Clinicians could then titrate their treatment to produce the maximum sustained positive movement in patient achievement. The Precision Teaching methods of data collection and display make routine experimental analysis practical and feasible; note that in the present study only a few minutes’ of data collection and plotting per day were required for stable data and precise prediction. If changes (such as medication changes) programmed by the members of the rehabilitation team have an effect on the behavior in question, a change will be seen in the data: then the clinicians can look for and control events that impact that behavior. Furthermore, if several behaviors are routinely monitored simultaneously, conditions that cause changes across many behaviors can be more easily separated from those that perturb only one of the measured behaviors. In the present study, the stability of the reference behavior data in Figure 6, collected during a different part of the therapeutic session, supported the interpretation of patient behavior changing in response to clinician behavior, with gradual improvement in performance on logical problem-solving for a selected type of task. The immediate implication of this study is that the collection and display of data using the Precision Teaching method helped the clinician to use an
experimental analysis approach in clinical patient management. In this clinical-experimental analysis model, multiple-baseline and other designs can be deployed to assess treatment efficacy with each patient. The standardized SC chart facilitated the comparison of data across behaviors and provided a uniform framework within which the frequency, celeration, and variability associated with each condition or behavior could be seen. As those in the field of medical rehabilitation strive toward greater accountability, their efforts have been hampered by the state of measurement as currently practiced. Ordinal, subjective rating scales are virtually the sole means by which decisions of resource allocation are made. For analysis of outcomes across consumers, it would seem desirable to investigate the use of frequency data, instead of ordinal data requiring extensive statistical manipulation with the accompanying logical problems (Merbitz et al., 1989b; Wright, 1992). In contrast to Likert-type functional assessment scales, such as the Functional Independence Measure (FIM, Granger, Ottenbacher, & Fiedler, 1993) or ‘Rehabits’ (Fisher, Harvey, Taylor, Kilgore, & Kelly, 1995) or similar ordinally based measures, frequency data are immediately available and do not require computerized statistical processing, for error-correction, utility, or meaning. Many other measures used within rehabilitation by individual practitioners, such as neuropsychological tests, were not designed for the purpose of ongoing assessment and detection of subtle change. Frequency measurement, with its focus on testing distinct skills via rate as well as accuracy of performance, is ideally suited for following a patient’s progress over short or longer periods of time. The Precision Teaching method for displaying behavioral data is usable across wide varieties of disciplines and behaviors; note Carr and Williams (1982) for an example in Physical Therapy, Binder (1981) for one in Occupational Therapy, Roth and colleagues (1990) for an exploration of gait, and Johnson and Layng (1992) for a provocative example of use across several academic skills. Thus, the possibility exists for a common data language for the teaching and therapeutic disciplines involved in the measurement of behavior, in a way similar to how the International
Cueing and Logical Problem Solving in Brain Trauma Rehabilitation
System of Units (SI) is used as a common data language by physical scientists. Such a development could facilitate cost-benefit analysis since the behavior is measured and quantified in physical units, and the charges, cost, or time of treatment can be known. Amount of behavior change per dollar or per unit time in treatment may be calculated and different therapeutic options may be compared to optimize outcomes for each patient, within the course of treatment for that patient. A team could experimentally analyze various approaches to individual patient issues within a relatively short period of time. In the present study, the data were collected and plotted by hand, but automated methods have been described (Merbitz, Cherney, & Marqui, 1992; Merbitz, Grip, Halper, Mogil, Cherney, & Bellaire, 1989; Merbitz, Cherney, & Marqui, 1991; Merbitz, King, Cherney, Marqui, Grip, & Markowitz, 1992), and such methods are likely to increase the practical appeal of Precision Teaching to rehabilitation clinicians. As experience is accrued with frequency-based measurement systems used across disciplines, the questions of what behaviors are measured and the extent to which those chosen are useful and empowering to the patient can be answered experimentally. Hanlon (1994) has noted the relatively recent application of learning principles and behavior management techniques in cognitive rehabilitation; the frequency measurement and data display methods of Precision Teaching will facilitate the development and testing of these techniques for individual patients. Of course, substantial additional work remains to measure the general outcomes desired in rehabilitation (Johnston, Keith, Hinderer, & Gonnella, 1992; Fuhrer, 1987; Whiteneck, 1994), but ultimately a frequency-based system with a comprehensive list of behaviors may serve as one of its foundations. Acknowledgements
This work was supported in part by Grant #G008003034 from the National Institute for Disability and Rehabilitation Research, Department of Education, in part by Grant
41
#H129E30004-94 from the Rehabilitation Services Administration, and in part by the authors. References Backman, C. L., Harris S. R., Chisholm, J. M., & Monette, A. D. (1997.) Single-subject research in rehabilitation: a review of studies using AB, withdrawal, multiple baseline, and alternating treatment designs. Archives of Physical Medicine and Rehabilitation, 78, 1145-1153. Bernard, C. (1957/1863). An Introduction to the Study of Experimental .Medicine. Dover: New York. Binder, C. (1981) Occupational therapy with the Chart: a 10-day assessment of grasp-release patterns with the severely handicapped. Paper presented at the Precision Teaching Winter Conference. Orlando, FL. Carr, B. & Williams, M. (1982). Analysis of therapeutic techniques through the use of the Standard Behavior Chart. Physical Therapy, 62, 117183. Damasio, A. R. & Anderson, S. W. (1993). The frontal lobes, In Clinical Neuropsychology (3rd ed.), K. M. Heilman & E. Valenstein (Eds.), New York: Oxford University Press. Dixon, T. M. & Layton, B. S. (1999). Traumatic brain injury, In Afedical Aspects of Disability, M. G. Eisenberg, R. L. Glueckauf & H. H. Zaretsky (Eds.) (pp. 210-242). New York: Springer. Fisher, W. P.; Harvey, R. F., Taylor, P., Kilgore, K. M., & Kelly, C. K. (1995). Rehabits: a common language of functional assessment. Archives of Physical Medicine and Rehabilitation, 76, 113-122. Fuhrer, M. J.(1987). Rehabilitation Outcomes: Analysis and Measurement. Baltimore, MD: Brookes. Gonnella, C. (1939). Single-subject experimental paradigm as a clinical decision tool. Physical Therapy, 69, 6 1-609. Granger, C. V., Ottenbacher, K. J., & Fiedler, R. C. (1993). The Uniform Data System for medical rehabilitation: report of first admissions for 1993. American Journal of Physical Medicine and Rehabilitation, 74, 62-66.
42
Charles T. Merbitz,Trudy K. Miller and Nancy K. Hansen
Hanlon, R. (1994). Neuropsychological rehabilitation, In Neuropsychology, D. Zaidel (Ed.), San Diego: Academic. Hansen, N. K. (1999, September). Selection: defining and supporting target behaviors. Behavior frequencies for process and outcome measures in SCI rehabilitation, Merbitz C (chair), Symposium conducted at the annual meeting of the American Association of Spinal Cord Injury Psychologists and Social Workers, Las Vegas, NV. Harnadek, A. (1978). Mindbenders. Pacific Grove, CA: Midwest. Johnson, K. R., & Layng, T. J. (1992). Breaking the structuralist barrier: fluency. American Psychologist, 47, 1475-1490. Johnston, M. V., Keith, R., Hinderer, S., & Gonnella, C. (1992). Measurement standards for interdisciplinary medical rehabilitation. Archives of Physical Medicine and Rehabilitation, 73, S1-S23. Johnston, J., Pennypacker, H. S. (1980). Strategies and Tactics of Human Behavioral Research. Hillsdale, NJ: Erlbaum. Koenig, C. H. (1972). Charting the future course of behavior. Dissertation, Univrsity of Kansas, Lawrence, KS. Lezak, M. D. (1978). Living with the characterologically altered brain injured patient. Journal of Clinical Psychiatry, 39, 592-598. Lindsley, O. R. (1992). Precision Teaching: discoveries and effects. Journal of Applied Behavior Analysis, 25, 51-57. Lindsley, O. R. (1994). Performance is easy to monitor and hard to measure. In Handbook of Human Performance Systems, R. Kaufman, S. Thiagarajan, & P. MacGillis, (Eds.). San Diego, CA: University Associates. Merbitz, C. T. (1996). Frequency measures of behavior for assistive technology and rehabilitation. Assistive Technology, 8, 121-130. Merbitz, C. T., Cherney, L. R., & Marqui, H. (1991): The Communication Analysis System. State College, PA: Parrot. Merbitz, C.T., Cherney, L. R., & Marqui, H. (1992a). The Communication Analysis System. In Johns Hopkins National Search for Computing Applications to Assist Persons with Disabilities, IEEE. Laurel, MD: Computing Society Press.
Merbitz, C., Grip, J., Halper, A., Mogil, S., Chemey, L., & Bellaire, K. (1989a). The Communication Analysis System. Archives of Physical Medicine and Rehabilitation, 70, 118-123. Merbitz, C., King, R., Cherney, L., Marqui, H., Grip, J., & Markowitz, T. (1992b). Computerized behavioral data collection and analysis for improved clinical outcomes in rehabilitation. Behavior Research Methods, Instruments, and Computers 24: 366-372, Merbitz, C. T., Morris J, Grip JG. 1989b, Ordinal scales and foundations of misinference. Archives of Physical Medicine and Rehabilitation, 70, 118-123. Michaud, L. (1995). Evaluating efficacy of rehabilitation after pediatric traumatic brain injury. In Traumatic Head Injury in Children, S. Broman & M. Michel (Eds.) (pp. 319-345). New York: Oxford University Press. Mozzoni, M. P. & Bailey, J. S. (1996). Improving training methods in brain injury rehabilitation. Journal of Head Trauma Rehabilitation, 11, 1-18. Ottenbacher, K. (1990). Clinically relevant designs for rehabilitation research: the idiographic model, American Journal of Physical Medcine and Rehabilitation, 70, 5144-5150. Parente, R., Twum, M., & Zoltan, B. (1994). Transfer and generalization of cognitive skill after traumatic brain injury. NeuroRehabilitation, 4, 2535. Parker, D. M., & Crawford, J. R. (1992) Assessment of frontal lobe dysfunction, In A Handbook of Neuropsychological Assessment, J. R. Crawford, D. M. Parker & W. W. McKinlay (Eds.) (pp. 267-294). Hove: Erlbaum. Pennypacker, H. S., Koenig, C., & Lindsley, O. R. (1972). Handbook of the Standard Behavior Chart. Gainesville, FL: Precision Teaching of Florida. Prigatano, G. P. (1992). Personality disturbances associated with traumatic brain injury. Journal of Consulting and Clinical Psychology, 60, 360-368. Roth, E., Merbitz, C., Grip, J., Bogolub, M., Mroczek, K., & Dugan, S., et al., (1990). The Timer-Logger-Communicator gait monitor: recording temporal gait parameters using a portable computerized device. International Disability Studies, 12, 10-16.
Cueing and Logical Problem Solving in Brain Trauma Rehabilitation
Sohlberg, M. M., & Mateer, C. A., (1989). Introduction to Cognitive Rehabilitation: Theory and Practice. New York: Guilford. Whiteneck, G. G. (1994). Measuring what matters: key rehabilitation outcomes. Archives of Physical ,Medicine and Rehabilitation, 75, 10731076 Willer, B. S., Allen, K. M., Liss, M., & Zicht, M. S. (1991). Problems and coping strategies of individuals with traumatic brain injury and their spouses. Archives of Physical Medicine and Rehabilitation, 72, 460-464. Williamson, D. J. G., Scott, J. G., & Adams, R. L. (1996). Traumatic brain injury. In Neuropsychology for Clinical Practice: Etiology, Assessment, and Treatment of Common Neurological Disorders, R.
43
L. Adams, O. A. Parsons, J. L. Culbertson, & S. J. Nixon (Eds.) (pp. 268-289). Washington, DC: American Psychological Association. Wilson, B. A., Emslie, H., Quirk, K., & Evans, J. (1999). George: learning to live independently with NuroPage. Rehabilitation Psychology, 44, 284-296. Wood, M. M. (1994). Cognitive rehabilitation of the brain-injured patient. In Neuropsychology in Clinical Practice, S. Touyz, D. Byrne, & A. Gilandis (Eds.).(pp. 113-131). Sydney: Academic. Wright, J. (1992). Statistical considerations in the interpretation of functional outcome scales. NeuroRehabilitation, 2, 21-30.