Proceedings of the Second International Workshop on Multimedia Data Mining (MDM/KDD'2001), in conjunction with ACM SIGKDD conference. San Francisco, USA, August 26, 2001
Data Mining for Typhoon Image Collection KITAMOTO Asanobu National Institute of Informatics 2–1–2, Hitotsubashi, Chiyoda-ku, Tokyo, 101–8430, JAPAN email:
[email protected] ABSTRACT This paper introduces the application of data mining methods to the analysis and prediction of the typhoon. The testbed for this research is the typhoon image collection that we established, now archiving approximately 34,000 typhoon images created from satellite images of geostationary meteorological satellite GMS-5. We claim that this data collection is a medium-sized, well-controlled, and richly-variational scientific database that are suitable as a testbed for data mining research. The main challenges of this paper is twofold: the analysis and the prediction of the typhoon. For the analysis, we apply various methods such as principal component analysis and self-organizing map to characterize or visualize the statistical properties of typhoon cloud patterns. We then apply an instance-based learning method for analogy-based prediction using past similar patterns, and also established similarity-based image retrieval system of the typhoon image collection. However, we also point out that we should not overlook fundamental difficulty in typhoon prediction from past similar patterns due to the chaotic nature of the atmosphere. KEY WORDS Typhoon Analysis and Prediction, Meteorological Data Mining, Principal Component Analysis, Self-Organizing Map, Instance-based Learning, Similarity-based Image Retrieval
1. Introduction In many countries, the typhoon, or the hurricane, is ranked at the top most significant threat among all natural disasters because a single typhoon attack may lead to significant casualties and property losses due to strong winds, heavy rainfall and so on. Therefore, the importance of typhoon research has been acknowledged for a long time, and the meteorology community has devoted considerable endeavor toward the analysis and the prediction of typhoons [1]. Although the meteorology community has established many typhoon models that can be effectively integrated into numerical weather prediction systems, there still remain many research issues to be challenged, including track prediction, intensity prediction, and cyclogenesis prediction of the typhoon. Our challenge to these research issues is a little ”nontraditional,” since, in contrast to the traditional paradigm © The copyright of this paper belongs to the paper's authors. Permission to copy without fee all or part of this material is granted provided that the copies are not made or distributed for direct commercial advantage. 68 (O.R. Zaïane, S.J. Simoff, eds.)
that has been pursued in the meteorology community, our approach is based on the informatics paradigm, by which we mean the utilization of many models and algorithms that have been developed in the informatics community, including such research fields as pattern recognition, computer vision, computer graphics, artificial intelligence, knowledge discovery / data mining, information retrieval, database systems. The basic idea in this paper is to apply dataintensive approaches to the analysis and prediction of the typhoon based on the large collection of satellite images that capture the cloud pattern of the typhoon. The motivation of our paradigm stems from what is called the ”Dvorak method” [2, 3]. In recent years most of the typhoon information are derived from satellite observations with the help of (manual or semi-automatic) pattern recognition of satellite observations along with analyst interpretation of empirically derived rules. The Dvorak method is specially designed for this purpose, and gained extensive popularity among hurricane analysis centers in the world. The formulation of Dvorak method, however, reminds us of the informatics paradigm as we mentioned earlier in the sense that pattern recognition and the past experience of experts are regarded as the indispensable part of the method. This is in contrast to mathematical models used in numerical weather prediction systems, where the model is deduced from partial differential equations that describes the dynamics of fluid in the gravity field. We are inspired by the Dvorak method, but our goal is not simply to mimic the current Dvorak method, but to characterize the essential of typhoon cloud patterns using data-intensive approaches, or in other words, data mining approaches based on the large collection of typhoon images. The goal is to discover new insights into the pattern and the dynamics of the typhoon through quantitative analysis of the typhoon image collection. Past researches that could be related to our paradigm include the motion analysis of hurricane clouds from image sequences based on fluid dynamics [4, 5, 6], the interpretation of tropical cyclone patterns using dynamic link architecture and active contours [7], typhoon data mining by neural network [8], and typhoon track prediction by fuzzy modeling [9]. However it seems that those studies were not tested on the large collection of typhoon data, nor they gave significant impact on the meteorology community, which is undoubtedly an authority about typhoon research. Hence the goal of this paper is to discover new insights that even
experts with the help of many kinds of external datasets, as far as off-line typhoon analysis is concerned, the typhoon center can be stably located on a satellite image with the help of best track records.
meteorology experts find them interesting with solid evidence based on the large collection of data. This paper is organized as follows. Firstly Section 2. describes data sources, the creation and current status of our typhoon image collection. Then the following sections discuss two main issues in this paper, namely, the analysis and prediction of the typhoon. Section 3. exemplifies a few results on the analysis of the typhoon using data mining methods such as principal component analysis, self-organizing map, and graph theoretic methods. On the other hand, Section 4. discusses the prediction of the typhoon using instance-based learning method based on k-NN similarity-based image retrieval, but we also compare the optimistic and pessimistic outlook on the analogybased prediction of the typhoon. Finally Section 5. concludes the paper.
2. Typhoon Image Collection
Satellite Images Most of the satellite images archived in our collection are taken by the Japanese meteorological satellite called GMS-5. Since this is a geostationary satellite that is located at 140 E above the equator, this satellite can observe both typhoons in the north-west Pacific ocean and tropical cyclones in the south Pacific and Indian ocean with relatively high frequency. The sensor of this satellite provides four bands, one in visible band and three in infrared bands. Because of the nature of electromagnetic wave, infrared bands can observe clouds even in nighttime, whereas visible bands cannot. We therefore archive infrared images as our main data source to have a uniform collection of images.
2.1 Overview
2.3 Data Preprocessing
In this section, we briefly describe relevant design issues in establishing our typhoon image collection, by which we mean a well-controlled typhoon image archives together with metadata related to the typhoon such as best track records and meteorological datasets. Some detail of this collection has already been introduced elsewhere [10, 11], but some of the important points regarding the typhoon image collection are summarized as follows:
Coordinate System The first design issue is the selection of coordinate system on which a typhoon image is created. There are two alternatives – the one is an Eulerian representation, in which the motion of typhoons is described on the fixed coordinate system, while the other one is a Lagrangian representation, in which the coordinate system moves along the motion of the typhoon. We employ the latter representation in order to focus on the time evolution of the typhoon over time, or in other words, in order to make separate the evolution of typhoon cloud patterns from the global motion of the typhoon cloud system, of which the former is our main concern. Under this coordinate system, we require accurate alignment between the image center and the typhoon center in order to create well-framed typhoon images.
Size The number of records (typhoon images) is moderate; it is approximately 34,000. However, the original satellite data scanned to create the collection amounts to about 600 gigabytes. Hence the creation of the typhoon image collection requires significant computation power. Temporal data Since the frequency of the satellite observation is one hour, as in Table 1, the collection contains time series data that describes the evolution of typhoon cloud patterns over time.
Map Projection In addition to accurate alignment of centers, another design issue required for creating wellframed typhoon images is the selection of map projection. Because the typhoon is a meteorological phenomenon that occurs on the surface of a sphere, namely the earth, the careful choice of the map projection method is required not to introduce unnecessary shape distortion along with the representation of the typhoon on a two-dimensional image. The method appropriate for this purpose is azimuthal equivalent projection (Lambert azimuthal equal-area projection) [12] because of the following reasons. Firstly this projection is equal area, which means the area of clouds can be directly compared among multiple images irrespective of the geographical location of the typhoon. Secondly, shape distortion is proportional to distance from the image center, hence the effect of distortion is less harmful to circular objects such as the typhoon. The map projected wellframed image is then created so that the direction of north is always upward on the image.
Spatial data Needless to say, typhoon images are spatial data, and moreover these can be interpreted as volumetric data.
2.2 Data Sources Best Track The first basic data source in this collection is the best track, which is a dataset officially compiled by national agencies in charge of meteorology such as Japan Meteorological Agency (JMA) and Australian Bureau of Meteorology (BOM). Best track records metadata related to the typhoon such as center location, central barometric pressure, and maximum wind speed for every three or six hours. Since this dataset is based on extensive study of the whole life cycle of the typhoon by a team of meteorology
69
Table 1. The best track and the current status of our typhoon image collection. Basin
Northern Hemisphere Best Track Japan Meteorological Agency (JMA) ◦ N
Name of agency Latitude Longitude
◦
Typhoon seasons Number of sequences Number of images Number of images per sequence Observation frequency
◦
Typhoon Image Collection 6 Seasons (1995–2000) 136 24,800 53 433 1 hour
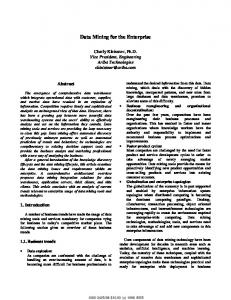
(a) Hourly observation on August, 15, 1997
Southern Hemisphere Australian Bureau of Meteorology (BOM) ◦ S ◦
◦
5 Seasons (1995–2000) 62 9,400 25 480 1 hour
(b) Daily observation for thew hole life cycle
Figure 2. The cloud patterns of Typhoon 9713 viewed in different time scales.
Image Classification Now a well-framed image is created as a gray-scale image, but here note that what we need is not a gray-scale pixel value itself but the classification of a pixel, or more specifically, whether a pixel is cloudy or not. Hence the next step is the pixel-based classification of the typhoon image utilizing three infrared bands. Because of the limited space, we omit the detail of the classification method [10, 11], but basically the method exploits the fact that such cloud parameters as air humidity and cloud top height can be estimated from the combination of pixel values of infrared bands. Then, if a pixel seems to be cloudy based on cloud parameters thus obtained, a specific cloud type such as cirrus and cumulonimbus is assigned to the pixel, or otherwise either a label ”ocean” or ”land” is assigned.
created from a classified image with the size of 512 512 pixels, setting the size of the small block as 8 8 pixels. Thus, the final product of data preprocessing is a 64 64=4096 dimensional cloud amount image or cloud amount vector. These two terms are subsequently used interchangeably depending on the context. Data Cleaning Before closing this subsection, we address the issue of data cleaning. This is required when the satellite image is contaminated with burst noise or the satellite image is incomplete due to the failure of observation. The latter case is automatically removed but the former case is manually removed. However, manually removed cases are less than 0.3% among all the satellite images collected, hence the data cleaning requires little human intervention.
The classified image is further processed to create a cloud amount image, which represents the fraction of cloud amount within a small block of image pixels, where the cloud amount takes a real value between 0 (completely cloud-free) and 1 (completely cloud-covered). In this paper, a cloud amount image with the size of 64 64 pixels is
2.4 Current Status Examples of typhoon images are illustrated in Figure 1, in which three typhoon images are created from the disk im-
70
ern hemisphere collection represent independent typhoon sequences, because typhoons never stride over the equator due to the disappearance of Coriolis force on the equator1. The number of images are approximately 24,000 in the northern hemisphere collection and 10,000 in the southern hemisphere collection. We claim that these collections are medium-sized, well-controlled, and richly-variational scientific data collection which serves as an interesting testbed for data mining. For example, Figure 2 shows the cloud patterns of Typhoon 9713 viewed in different time scales. Notice the contrast between small variation in one day and significant variation in the whole life cycle. Hence these collections provide interesting challenges for pattern recognition, time series analysis, and so on. In addition, the presence of metadata such as (partly interpolated) central barometric pressure and maximum wind speed can be used as ground truth data for validation.
3. Typhoon Analysis 3.1 Exploratory Typhoon Analysis
9626(FERN)
The aim of this section is to gain some insights into typhoon cloud patterns. However, the application of various methods will be exploratory, since the effectiveness of existing data mining methods is still not evaluated for this particular target, namely the typhoon. For example, we will later apply clustering procedures, whose goal is to yield a data description in terms of clusters or groups of data points that posses strong internal similarities[13]. However, it is not intuitively clear whether the typhoon cloud patterns really have such underlying subclasses, despite the fact that we can at least always calculate clustering procedures. Hence, we conjecture that, to gain some insights into patterns whose characteristics are unknown, the best we can do is to apply available approaches to decide in which direction we should make advances. In the following, we introduce three data mining methods; namely variance maximization, clustering procedures, and time series analysis.
0860 (SFERGUS)
Figure 1. The creation of well-framed typhoon images from the original satellite image of GMS-5. The geographical location of the typhoon center is determined from the best track, and a well-framed typhoon image is created using azimuthal equivalent map projection so that the image center always coincides with the typhoon center. The top image was taken on 1200 UTC Dec 26, 1996, in which three typhoons are simultaneously observed; that is, Typhoon 9626 (FERN) in the northern hemisphere, and Typhoon 0852 (SPHIL) in the left, and Typhoon 0860 (SFERGUS) in the right in the southern hemisphere. Two of the created typhoon images are shown below.
3.2 Variance Maximization Component Analysis
–
Principal
The first method is principal component analysis that reveals the maximum variance in the feature space, thereby gives us some insights about the variability of typhoon cloud patterns. Feature vectors to be analyzed are cloud amount vectors, which are the final product of data preprocessing. In addition, principal component analysis serves
age of the earth originally received from the satellite. The position of the center of three typhoons are estimated from best track records published by JMA and BOM as summarized in Table 1. Then three well-framed typhoon images are created, which capture the core part of typhoon cloud patterns. Note that the direction of spiral bands is opposite between typhoons in the northern hemisphere and the southern hemisphere.
1 Based on the hypothesis that typhoons found in both hemispheres are fundamentally the same meteorological phenomena, there is a possibility of merging those two collections with vertically flipping southern hemisphere images, after which transformation the direction of wind circulation is the same in two collections. Although we do not further investigate this hypothesis, statistical analysis in Section 3. are related to this issue.
Table 1 also summarizes the current status of our typhoon image collection. Note that two collections, namely the northern hemisphere collection and the south-
71
Figure 3. Principal components of typhoon cloud patterns for the northern hemisphere collection. Horizontal and vertical axis represents the first principal component and the second principal component respectively.
Figure 5. Clustering of typhoon cloud patterns using kmeans clustering. Images shown are the ones nearest to the mean of clusters. Clusters are ordered in no particular order.
as a tool for dimensionality reduction by eliminating eigenvectors that correspond to small eigenvalues. Technically speaking, in the following experiments, each element of cloud amount vectors is normalized as mean and variance equals zero and one respectively2, since, in general, the cloud amount of elements which are near the center of the typhoon takes values close to unity with small variance. Hence this normalization gives better representation power in terms of small-scale structure around central core clouds. Figure 3 illustrates the distribution of typhoon cloud patterns on the space of first and second principal components. Each image that appears in Figure 3 is chosen based on proximity to regularly sampled points in the space of two principal components. This figure suggests that those two axes represent the slope of cloud amount between north and south. In other words, the maximum variance in typhoon cloud patterns is found in the north-south slope of the cloud amount. In addition, around the middle of extremes along two axes, we can observe cloud patterns with large curvature or circular shape with core cloud clusters. Thus these principal components visualize the distribution of typhoon cloud patterns by linearly projecting data vectors into a low dimensional space. A principal component, or an eigenvector, can also be visualized as an eigenpicture by assigning a gray-scale value to each element of an eigenvector, as in face recognition [14] and in remote sensing image analysis [15]. Figure 4 illustrates eigenpictures for the northern and southern hemisphere. It is clear that the rotation of cloud bands
is opposite in two hemispheres. It is also interesting to note that both sets of eigenpictures show similar tendency – from large-scale structures to small-scale structures, and the graphs of cumulative proportion also show similar tendency in two collections. These results suggest that typhoons in both hemispheres are in fact driven by the same atmospheric mechanism.
3.3 Clustering – Self-Organizing Map As stated earlier, clustering procedures aims at yielding a data description in terms of clusters or groups of data points that posses strong internal similarities [13]. If, in some sense, the center of gravity of each cluster represents a ”typical” pattern of the typhoon, a set of typical patterns may serve as a graphical representation of typhoon cloud patterns in a way that humans can easily understand. In fact, the Dvorak method, acknowledged as the standard method for typhoon analysis, also uses similar representation – assigning empirically derived rules for ”typical” cloud patterns derived from the long experience of analysts. Hence it is expected that clustering procedures may produce the intuitive summarization of the typhoon cloud patterns that can be used as the catalog of collections. This issue is also related to the visualization of typhoon cloud patterns. The basic (non-hierarchical) clustering procedure is the k-means clustering, whose result is shown in Figure 5. In this experiment, the number of clusters is fixed to 100, and clusters obtained through experiments are shown in Figure 5 in no particular order. In this representation, al-
2 This
process is equivalent to using a correlation coefficient matrix instead of a variance-covariance matrix for calculating eigenvectors.
72
1
0.8
0.8 Cumulative Proportion
Cumulative Proportion
1
0.6
0.4
0.4
0.2
0.2
0
0.6
0
20
40
60
80 100 120 140 Major Principal Components
160
180
200
20
Northern Hemisphere
40
60
80 100 120 140 Major Principal Components
160
180
200
Southern Hemisphere
Figure 4. The eigenpictures of the typhoon in the northern and the southern hemisphere. These eigenpictures are ordered by corresponding eigenvalues from 1st (upper-left corner) to 30th (lower-right corner), and the cumulative proportion is illustrated in the graph below.
though those images can be regarded as representative images of subclasses, it is not easy to grasp the global distribution of typhoon cloud patterns because clusters are not ordered in any ways. One method for having better representation in terms of the ordering of clusters is called the self-organizing map (SOM) [16], which summarizes high dimensional data vectors with a set of reference vectors having a spatial organization on a (usually) two-dimensional lattice. The detail of the algorithm can be found in many publications [16], so we only describe the settings we used for the basic SOM. The input vectors to the SOM are dimensionality reduced vectors derived from cloud amount vectors. That is, based on the result of principal component analysis, we transform originally 4096 dimensional cloud amount vectors into dimensionality reduced vectors computed by the linear combination of eigenvectors. The number of dimensions is determined by the cumulative proportion of eigenvalues; in the subsequent experiments, we use 83 dimensional vectors that corresponds to the cumulative proportion of 75% as illustrated in Figure 4. The array of neurons are configured on a square lattice with the size of 10 10 neurons. We tested two types of topology; namely normal lattice topology and torus-type
topology in which neurons on the left and the upper boundary are connected with ones on the right and lower boundary, respectively. Some of the other settings are described below. 1. Topological neighborhood is defined in reference to chess-board distance on a square lattice. 2. Learning rate factor is proportional to the inverse of the number of steps with some minimum limit. 3. Reference vectors are randomly initialized. Although, in general, slightly different ordering of neurons are obtained after learning, depending on the initial condition of the SOM, we show a result in Figure 6 obtained from particular learning steps. Images shown on this map are the ones which are the nearest to reference vectors of neurons, hence they approximate the distribution of typhoon cloud patterns through the nonlinear projection of the SOM. From a visualization point of view, this representation provides a ”birds-eye-view” of typhoon cloud patterns, which clearly illustrates gradual shape transition from neuron to neuron. There appear to be clusters of large clouds, small clouds, elongated clouds, circular clouds, etc.
73
10
20
9
19 18
8
17 7
16
6
15
5
14
4
13 12
3
11 2
10
1 0
9 0
1
2
3
4
5
6
7
8
9
8
10
(a) Normal Topology
0
1
2
3
4
5
6
7
8
9
10 11 12
(b) Torus Topology
Figure 6. Clustering of typhoon cloud patterns using Self-Organizing Map, and the evolution of Typhoon 9713 on the SOM space. This typhoon is the same sequence as the one in Figure 2.
but in (b) numbers should be interpreted with mod 10 because torus topology is employed. If we regard a neuron as a state, and focus on the state transitions, then we can compare the properties of state transitions among typhoon sequences. Comparing both charts, (b) seems to be a more natural representation, because state transition is more ordered than (a), meaning that the ordering attained by the SOM may better corresponds to time series ordering of the typhoon cloud patterns. Assuming that the typhoon in the real world changes its state in a continuous manner, big leaps between distant states may be spurious due to the inappropriate ordering of neurons. However, some of the big leaps may not be spurious but may indicate the presence of rare phenomena. Hence future investigation into state
Thus the ordering of typhoon cloud patterns attained by the SOM gives a unique insight into the nature of typhoon cloud patterns.
3.4 Time Series Analysis – Graph Theoretic Analysis Figure 6 also illustrates the evolution of typhoons on the obtained SOM space. Here hourly observation of typhoons are projected into the SOM space as a node, and sequential observations are then connected with edges, forming a (directed) graph structure as a whole. Numbers along the axis represent the column and row index of neurons,
74
archived images3 , and clicking on one of the retrieved images spawns another similarity-based retrieval of images. In addition, other search criteria such as temporal and spatial location are also provided, and the summarization of the whole life cycle of each typhoon gives an intuitive idea on the evolution of the typhoon. Extending this idea, we can imagine a typhoon prediction system based on similarity-based image retrieval system that should work as follows: 1. We first create the well-framed typhoon image of the current typhoon to be predicted, and use this image as a query. 2. Image database system performs a similarity-based retrieval and returns a list of similar typhoon images from past typhoon sequences, together with information on their subsequent evolution. 3. We then predict the evolution of the current typhoon based on the ensemble of the evolution of similar typhoon sequences.
Figure 7. Similarity-based retrieval of typhoon imagery. The typhoon image in the upper-left corner is a query, and others are similar images to the query. Note that typhoon images in the same sequence to the query are excluded from the search.
In short, this scenario seems to be a natural way of predicting the typhoon using analogy; however, in fact, this scenario may be too optimistic because of the reasons we will discuss in the following.
4.2 Criticism
transition rules may uncover interesting hidden knowledge in the evolutionary patterns of the typhoon. This is still an open question.
The optimistic outlook for the instance-based prediction sounds all very well; however, we should not blind ourselves to fundamental difficulty in predicting atmospheric events, namely the chaotic nature of the atmosphere. In fact, instance-based, nearest neighbor search for similar atmospheric situation was proposed and numerically evaluated more than 30 years ago by one meteorologist well known for his discovery of chaos in the atmosphere. In his pioneering work [19, 20], he tried to find a similar weather situations (analogues), in terms of the pressure pattern of the upper troposphere, from historical weather data in the hope of utilizing historical data for the future prediction of current weather. However, the result was disappointing. He found out that there were indeed no truly good analogues, so he claimed that in practice this procedure might be expected to fail. Another recent paper [21] also reported similar difficulty in finding truly similar patterns after they searched for more than 15 million combinations of barotoropic pattern of the atmosphere. We suspect that these pessimistic results are caused by an effect called the curse of dimensionality; that is, distance between neighbors is dominated by the large number of irrelevant attributes [13, 17], hence even similar image pairs takes relatively large distance (dissimilarity). To
4. Typhoon Prediction 4.1 Instance-based Learning and Image Retrieval Instance-based learning is conceptually straightforward approaches to approximating real-valued or discrete-valued target function. Learning in this algorithm consists of simply storing the presented training data. When a new query instance is encountered, a set of similar related instances is retrieved from memory and used to classify the new query instance. It is robust to noisy training data and quite effective when it is provided a sufficiently large set of training data [17]. A simple instance-based method called the k-nearest neighbor (k-NN) algorithm assumes that all instances correspond to points in the n-dimensional space, in which the nearest neighbors of an instance are defined in terms of a distance measure. In order to perform nearest neighbor search on the typhoon image collection, we established a WWW (World Wide Web) interface to our prototype image database systems as illustrated in Figure 7 [18]. This system can perform k-NN similarity search using Euclidean distance between the vector of a query image and the vectors of
3 Sometimes it is better to exclude from similarity-based retrieval typhoon images that belong to the same typhoon sequence as the query because we are more interested in retrieving similar images from different typhoon sequences.
75
1600
5. Conclusions and Open Problems
1400
This paper described our project on informatics-based typhoon analysis and prediction. The infrastructure of this study is the collection of typhoon images that consists of approximately 34,000 typhoon images from the northern and southern hemisphere, created from the geostationary meteorological satellite GMS-5. This data collection is a medium-sized, well-controlled, and richly-variational scientific database that are suitable for a data mining testbed. We discussed two main challenges of our study; namely the analysis and prediction of the typhoon. Firstly, we introduced various data mining methods for the analysis of the typhoon. Principal component analysis revealed that the maximum variance of the typhoon cloud pattern lies in the north-south slope of the cloud amount, and this method was also used for dimensionality reduction of cloud amount vectors. Next the clustering methods such as kmeans and the self-organizing map (SOM) was applied for visualizing the distribution of typhoon cloud patterns on a two dimensional space. As a result, the SOM provided better visualization that gives intuitive notion on the entirety of our typhoon image collection. We also made a preliminary study about visualizing the evolution of typhoons on the SOM space, and found out that the torus-type topology of the SOM may be better suited for the representation of time evolution. Another challenge in this paper is prediction, and we showed a prototype similarity-based image retrieval system for our typhoon image collection based on instance-based learning with k-NN search. In the optimistic scenario, this system should serve as an effective tool for analogy-based prediction of the typhoon. However, the pessimistic criticism fundamentally linked to the chaotic nature of the atmosphere also poses a formidable problem that should not be overlooked. Hence our mission is to develop data models and data mining methods that work effectively for the analysis and prediction of the typhoon against the curse of dimensionality.
Error (Distance)
1200 1000 800 600 400 200 0 -140 -120 -100 -80 -60 -40 -20 0 Time difference (hour)
20
40
60
Figure 8. Predictability of the typhoon cloud patterns based on instance-based learning.
see this effect, we measured the evolution of distance4 between similar patterns over time and illustrate the result in Figure 8. In this experiment, the most similar images to the query are found in sequence basis, and those images are aligned at time zero. Then at time t, we compare distance between the image t hours after the query image and the image t hours after the aligned similar image. The implication of Figure 8 is that even if we can find relatively similar images from other typhoon sequence, dissimilarity between typhoon sequences increases rapidly and soon similarity becomes insignificant compared to that between randomly chosen samples. In short, it is very difficult to find past similar patterns that are expected to keep similar time evolution over long period of time. Another point related to the above argument is that what we should predict in terms of typhoons. Our final interest may be in predicting the intensity, track, and evolution of the typhoon. If we notice the fact that Dvorak method relies on the pattern recognition of cloud patterns, we can assume that the prediction of cloud patterns gives good estimate for the intensity that we want to predict. However, the cloud pattern of the typhoon has a very high degree of freedom, and direct prediction of cloud patterns may be too hard for predicting just some parameters which has only a lower degree of freedom. The curse of dimensionality indicates that the selection of good features and good distance metric to calculate similarity is important because otherwise distance does not give meaningful value. In future works, these points will be an important factor in building effective analysis and prediction algorithms of the typhoon.
Acknowledgments We would like to thank Prof. M. Kitsuregawa and Dr. T. Nemoto in Institute of Industrial Science, University of Tokyo, and also Prof. R. Shibasaki in Center for Spatial Information Science, University of Tokyo, for the receiving and archiving of GMS-5 satellite data, which were used in this study.
References [1] R.A. Pielke, Jr. and R.A. Pielke, Sr. Hurricanes : Their Nature and Imacts on Society. John Wiley & Sons, 1997.
4 As
before, the Euclidean distance between dimensionality reduced cloud amount vectors is used.
76
[2] Dvorak, V.F. Tropical Cyclone Intensity Analysis and Forecasting from Satellite Imagery. Monthly Weather Review, Vol. 103, pp. 420–430, 1975.
[15] Fayyad, U.M., Smyth, P., Weir, N., and Djorgovski, S. Automated Analysis and Exploration of Image Databases: Results, Progress, and Challenges. Journal of Intelligent Information Systems, Vol. 4, pp. 7– 25, 1995.
[3] Dvorak, V.F. Tropical Cyclone Intensity Analysis Using Satellite Data. NOAA Technical Report NESDIS, Vol. 11, pp. 1–47, 1984.
[16] Kohonen, T. Self-Organizing Maps. Springer, second edition, 1997.
[4] Palaniappan, K., Kambhamettu, C., Hasler, A.F., and Goldgof, D.B. Structure and Semi-fluid Motion Analysis of Stereoscopic Satellite Images for Cloud Tracking. In Proc. of International Conference on Computer Vision, pp. 659–665. IEEE, 1995.
[17] Mitchell, T.M. Machine Learning. McGraw-Hill, 1997. [18] http://www.digital-typhoon.org/. [19] Lorenz, E.N. Atmospheric Predictability as Revealed by Naturally Occurring Analogues. Journal of the Atmospheric Sciences, Vol. 26, pp. 636–646, 1969.
[5] Zhou, L., Kambhamettu, C., and Goldgof, D.B. Extracting Nonrigid Motion and 3D Structure of Hurricanes from Satellite Image Sequences without Correspondences. In Proc. of Conference on Computer Vision and Pattern Recognition. IEEE, 1999.
[20] Lorenz, E.N. Three Approaches to Atmospheric Predictability. Bulletin of Americal Meteorological Society, Vol. 50, No. 5, pp. 345–349, 1969.
[6] Zhou, L., Kambhamettu, C., and Goldgof, D.B. Fluid Structure and Motion Analysis from Multi-spectrum 2D Cloud Image Sequences. In Proc. of Conference on Computer Vision and Pattern Recognition. IEEE, 2000.
[21] Nohara, D. and Tanaka, H.L. Logarithmic Relation between the Initial Error and Predictability for the Barotoropic Component of the Atmosphere. Journal of the Meteorological Society of Japan, Vol. 79, No. 1, pp. 161–171, 2001.
[7] Lee, R.S.T. and Liu, J.N.K. An Automatic Satellite Interpretation of Tropical Cyclone Patterns Using Elastic Graph Dynamic Link Model. Pattern Recognition and Artificial Intelligence, Vol. 13, No. 8, pp. 1251–1270, 1999. [8] Zhou, Z., Chen, S., and Chen, Z. Mining Typhoon Knowledge with Neural Networks. In Proc. 11th Int. Conf. on Tools with Artificial Intelligence, pp. 325– 326. IEEE, 1999. [9] Hiraoka, T., Maeda, H., and Ikoma, N. Two-stage Prediction of Typhoon Position by Fuzzy Modeling. In Proc. of Int. Conf. on Systems, Man and Cybernetics, pp. 581–585. IEEE, 1999. [10] Kitamoto, A. The Development of Typhoon Image Database with Content-Based Search. In Proceedings of the 1st International Symposium on Advanced Informatics, pp. 163–170, 2000. [11] Kitamoto, A. and Ono, K. The Collection of Typhoon Image Data and the Establishment of Typhoon Information Databases Under International Research Collaboration between Japan and Thailand. NII Journal, No. 2, pp. 15–26, 2001. [12] Yang, Q.H., Snyder, J.P., and Tobler, W.R. Map Projection Transformation. Taylor & Francis, 2000. [13] Duda, R.O. and Hart, P.E. Pattern Classification and Scene Analysis. John Wiley & Sons, 1973. [14] Turk, M. and Pentland, A. Eigenfaces for Recognition. J. of Cognitive Neuroscience, Vol. 3, No. 1, pp. 71–86, 1991.
77