Data mining pathogen genomes using GeneOrder and CoreGenes: gene order, synteny, and proteomes Padmanabhan Mahadevan Department of Bioinformatics & Computational Biology College of Science, George Mason University Manassas, VA 20110 USA
[email protected] Submitted to BIOCOMP’08
Abstract - Genome sequence databases are growing at an exponential rate due to the “next generation” DNA analyzers. These include determining multiple sequences of serovars of previously sequenced organisms, particularly ones of consequence to human health and epidemics. The applications of these sequence data are limited by the tools available to mine them, particularly user-friendly tools that are available to the bench researcher. GeneOrder and CoreGenes are two webbased on-the-fly whole genome tools that can be used to examine gene order and synteny, as well as to catalog proteomes for comparative genomics. A new version of GeneOrder allows and expedites the analysis of genomes ranging up to 4 megabases. Many bacterial pathogens are of this genomic size; for example, validation of this version of the tool is provided by its application to E. coli serovars K12 and O157:H7. The original version already allows the analysis of virus-sized genomes and small bacterial genomes. Other updated options include the ability to enter proprietary and/or unpublished genome data. In addition, the tool is useful for genome annotation, with particular emphasis on the annotation of hypothetical proteins. Keywords: GeneOrder, hypothetical protein annotation, pathogen, comparative genomics, E. coli.
1
Introduction
The analysis of gene order and the conservation of gene order (synteny) is important for understanding the evolution of genomes and the evolutionary relationships between them [1]. The conservation of gene order can also be used to predict functional coupling between the genes in conserved gene clusters [2], as well as for annotation of gene function [3]. One example highlights the use of gene order conservation, e.g., its role in bacterial cell shape, where there is a correlation of cell shape with the gene order of a cluster of genes associated with synthesis of the cell wall and cell division [4]. Conservation of gene order can be due to several factors, including horizontal gene
Donald Seto Department of Bioinformatics & Computational Biology College of Science, George Mason University Manassas, VA 20110 USA
[email protected] Phone: (703) 993-8403, Fax: (703) 993-8401 transfer, importance of the gene cluster to the cell and simply that the gene order has not yet been lost due to recent divergence of species [1]. Examples of gene clusters that are apparently immune to loss of gene order are the dcw cluster, the ribosomal protein operon and the nuo operon [5]. With the emergence of better, faster and more efficient DNA technology and methodology, the number of available whole genome sequences continues to grow at a tremendous rate. The Genomes Online Database (GOLD) available at http://www.genomesonline.org/ [6] comprises currently 730 published complete genomes (597 bacterial) and 1763 bacterial ongoing genomes. This tsunami of data necessitates more and better genome analysis tools to mine and to extract useful information from the genomes. One particular area in genome analysis where several tools have been produced independently is in the analysis of gene order and synteny. These include Genome Organization Analysis Tool (GOAT) [7], Gene Order Visualizer (GOV) [8], GeneSyn [9], Artemis Comparison Tool (ACT) [10], DAGchainer [11], Cinteny [12], and GenomePixelizer [13]. Unfortunately, GOAT and GOV are not accessible any more, and have apparently become software “orphans” that are not supported nor updated. The others are problematic for the non-computational bench scientist, to whom these software tools are addressed. For example, GeneSyn is a command line program and does not provide a visual representation of the data. ACT generates comparisons between genomes, but the visual output is complicated and not easy to navigate. DAGchainer is a downloadable program and is not web-based. Cinteny requires the user to upload more than one type of tab delimited data file, which may be tedious to assemble by non-computationally based biologists. GenomePixelizer is not web-based and requires download of an external toolkit. In contrast, GeneOrder3.5 is an updated versatile user-friendly web-based tool developed for the analysis of gene order and synteny, based on an established and well-used software tool, GeneOrder. This global genome data mining software tool has been updated to analyze larger sized bacterial genomes of around 4-5 megabases (Mb). It performs “on-the-fly” analysis of two genomes and produces a dot plot of gene pairs. It does
not rely on pre-computed BLAST results like software tools such as ACT and DAGchainer. Instead, GeneOrder3.5 uses the BLAST-like Alignment Tool (BLAT) [14] to perform all-against-all protein comparisons. The previous version of GeneOrder [15] used Washington University BLAST (WU-BLAST) [16], which was too slow to deal with analysis of larger genomes. BLAT performs very fast protein comparisons between two large genomes and is ideal for on-the-fly web-based analysis. GeneOrder3.5 also provides for the analysis of custom or proprietary data, that is, data not submitted to GenBank for one reason or another. Since GeneOrder3.5 is web-based, users do not have to download, install or tinker with any software packages. Web-based access is especially useful for noncomputationally based scientists such as bench-based biologists. Other user-friendly features of GeneOrder3.5 include zooming, printing, and customizing the final graphical plot. In addition, now, clicking on the points on the plot leads to the popping up of new browser windows, leading to the GenBank record of the gene pairs on the plot. We illustrate the utility of GeneOrder3.5 in analyzing gene order and synteny in strains of E. coli. The utility of the tool in identifying and annotating hypothetical proteins is also presented. Complementing the above, another software tool known as CoreGenes [17] is used to examine the proteomes of up to five genomes; as a validation, five pathogenic SARS (sudden acute respiratory syndrome) coronavirus strains are presented. CoreGenes finds the common or “core” proteins from these genomes, and is a useful tool to analyze entire proteomes. Together with the GeneOrder analysis of the E. coli strains, we present this suite of software tools that are useful in data mining pathogenic serovars.
1.1
GeneOrder3.5 algorithm and features
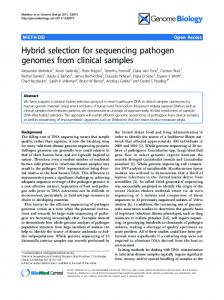
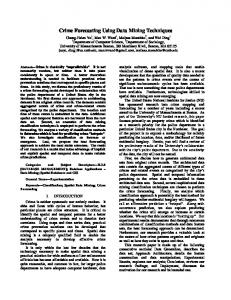
The GeneOrder3.5 algorithm takes 2 genomes as the input data and uses BLAT to perform “all-against-all” protein comparisons in these genomes. The results generated by BLAT are then filtered by previously specified threshold scores in the web interface (Figure 1). These results are then plotted on a graph as gene pairs according to the threshold scores. The scores are BLAT scores that are specified as “highest” (200+), “high” (100200), and “low” (75-100). These are the default values and can be changed according to the user’s specifications. On the plot, the different level scores are shown as dots, crosses, and squares, respectively (Figure 2). The advantage of using these three types of scores is that the user can identify the best matches, as well as probable matches. Low scoring matches can also be investigated by the user for further analysis. GeneOrder3.5 also has several features that enhance its ease of use. The user can zoom in on interesting regions of the plot by clicking and dragging. The plot axes and title can also be customized, making it easy to produce publication quality figures. The points on the plot are “clickable,” which launches two browser
windows leading to the gene pair entries in GenBank. This allows the user to extract the protein sequence and perform further analysis. The results on the plot are also accessible in tabular format, which lists all the gene pairs and their scores, as well as links to GenBank. GeneOrder3.5 is a stand-alone Java-based global software application that makes use of applets to display the resultant plot. Any up-to-date web browser such as IE or Firefox is sufficient to make use of the application. External bioinformatics packages are not required, nor is there tweaking of the software or recompilation of codes.
2
Methods
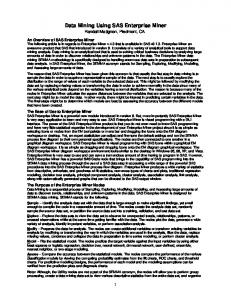
As a validation of this version of GeneOrder, the accession numbers of E. coli strains were obtained from the GOLD database, corresponding to GenBank entries, and were entered as pairs into the GeneOrder 3.5 web interface. These genome pairs are shown in Table I. E. coli is intriguing and of great interest biologically and in the context of human health and especially public health. It has been studied intensely in the laboratory, being a microbial “guinea pig” for past and present research. The laboratory strains and many “field strains” are innocuous. One strain, O157:H7, is pathogenic in humans and of great concern in the food industry. The contents of its genome and the resultant proteome contain the genes for pathogenicity. Therefore, comparative genomics is one approach to identify diagnostic, therapeutic and differential targets. Gene order and synteny were analyzed by looking at the generated plots. The identification of un-annotated genes can be solved using GeneOrder and percent identities of certain hypothetical proteins and their counterparts. These were calculated using the needle program of the EMBOSS package (http://www.ebi.ac.uk/emboss/align). The functional classes of the hypothetical proteins may be predicted using SVM-Prot [18] (http://jing.cz3.nus.edu.sg/ cgi-bin/svmprot.cgi). SVM-Prot is a web-based software that classifies proteins into functional classes based on the amino acid sequence. Another example are the SARS coronaviruses; accession numbers of these SARS coronaviruses were obtained from GenBank (http://www.ncbi.nlm.nih.gov) and are shown in Table II. The genomes and accession numbers are entered into the CoreGenes web interface as shown in Figure 3.
Figure 1: Web interface for GeneOrder3.5. Fields for users to enter accession numbers of a reference and query genome in the respective fields are shown. The discriminatory threshold BLAT scores can also be changed from the default values to suit the user’s needs.
SARS coronavirus strain BJ202
Figure 2: Sample gene order plot display between two bacterial species (Thermotoga. lettingae and Streptococcus gordonii) showing dots, crosses, and squares. These symbols correspond to the discriminatory BLAT scores.
29.7
AY864806
Table I: Genomes, genome sizes and GenBank accession numbers used for these validations of GeneOrder3.5.
Figure 3: CoreGenes web interface. The interactive interface allows from two to five genome accession numbers to be entered.
Bacterial strain
Size (Mb)
Accession #
3
E. coli K12
4.64
NC_000913
E. coli O157:H7 Sakai
5.50
NC_002695
E. coli O157:H7 EDL933
5.53
NC_002655
Salmonella Typhi Ty2
4.79
NC_004631
Table II: Genomes, genome sizes and GenBank accession numbers of the genomes used for validation of CoreGenes proteome analysis. SARS strain
Size (Kb)
Accession #
SARS coronavirus
29.7
NC_004718
SARS coronavirus strain CV7
29.7
DQ898174
SARS coronavirus strain MA-15
29.7
DQ497008
SARS coronavirus strain LLJ-2004
29.7
AY595412
Results and Discussion
The non-pathogenic E. coli K12 strain was compared with the pathogenic serovars E. coli O157:H7 Sakai and E. coli O157:H7 EDL933 in a validation of the GeneOrder3.5 analysis. E. coli O157:H7 strains are human pathogens and are associated with hemolytic uremic syndrome and bloody diarrhea [19]. The pathogenic strain Salmonella Typhi Ty2, which causes typhoid fever [20], was also compared to the E. coli K12 strain. The gene order analysis between E. coli K12 and both pathogenic strains yielded similar results, as shown in Figures 4 and 5. The main diagonal formed by the dots on these figures indicates a large region of colinearity and conservation of gene order, that is, synteny. In contrast, the gene order plot between E. coli K12 and Salmonella Typhi Ty2 looks quite different, with regions of inversions as indicated by the counter diagonals (Figure 6).
Figure 4: Gene order plot between E. coli K12 and E. coli O157:H7 Sakai presenting homologs and related genes.
being the same protein as the annotated proteins in E. coli K12. In Table III, a probability value is listed next to the functional predictions. This is the probability of correct classification by SVM-Prot. This value is produced by SVM-Prot as part of its output. It appears that the family predictions with a 90% or greater probability of correct classification agree with the annotations, while the ones with less than 90% probability are less likely to agree with the annotations. This is not surprising since SVM-Prot uses a machine learning method to make functional predictions and the accuracy of prediction may vary. Nevertheless, the very high % pairwise identities between the E. coli K12 proteins and the E. coli O157:H7 proteins suggest that the annotated proteins are most likely the same as the hypothetical proteins. Figure 5: Gene order plot between E. coli K12 and E. coli O157:H7 EDL933.
Figure 6: Gene order plot between E. coli K12 and Salmonella Typhi Ty2. The counter diagonals indicate genome regions that are inverted.
3.1
Annotation function
of
hypothetical
protein
Several hypothetical proteins were found upon the perusal of the annotated E. coli O157:H7 Sakai genome that had annotated counterparts in the E. coli K12 genome. These were identified by looking at gene pairs that had BLAT scores of greater than 200 on the gene order plots. In order to provide more evidence for the annotation, SVMProt software was used to predict the protein families to which the hypothetical proteins belonged. Table III shows the annotated proteins, the hypothetical counterparts, % pairwise identity to each other, and the protein family predictions produced by SVM-Prot. The % pairwise identities are all greater than 90%, with the exception of just one value, and even that is greater than 70%. These high % identities suggest that the hypothetical proteins belonging to E. coli O157:H7 have a high probability of
Table III: Annotated proteins in the genome of E. coli K12 aligned with hypothetical proteins of the E. coli O157:H7 genome. The % identity is the pairwise identity between the K12 reference protein and the O157:H7 hypothetical protein. The protein family prediction by SVM-Prot and the probability of correct classification is shown in parentheses. E. coli K12 protein
E. coli O157 :H7 Sakai protein
% identity
Protein family prediction (Prob.)
conserved inner membrane protein associated with acetate transport
hypothetical protein ECs0010
100
electrochemical potential-driven transporters (99.1%)
predicted transporter subunit: membrane component of ABC superfamily
hypothetical protein ECs00132
100
transmembrane (99%)
predicted polysaccharide deacetylase lipoprotein
hypothetical protein ECs00134
98.8
transferases – glycosyltransferases (98.4%)
2'-5' RNA ligase
hypothetical protein ECs0151
98.3
zinc-binding (83.9%)
predicted Sadenosyl-Lmethioninedependent methyltransferase
hypothetical protein ECs0209
95.9
all lipid-binding proteins (73.8%)
predicted toxin of the YafQ-DinJ toxin-antitoxin system
hypothetical protein ECs0252
90.2
chlorophyll biosynthesis, rnabinding, calcium
binding (58.6%)
3.2
The CoreGenes analysis of the SARS coronavirus genome is shown in Figure 7. These five strains apparently share ten proteins with each other, as a “core” set of proteomes. At least one of the strains (SARS coronavirus strain MA-15) has an un-annotated hypothetical protein. This protein corresponds to the SARS 7b protein in the first (SARS), second (SARS CV7), and fourth (SARS LLJ2004) strains, as shown in Figure 7. The pairwise % identity between this hypothetical protein and the SARS 7b protein in each of the other three strains is 100, 100, and 95.7%, respectively. This strongly suggests that the hypothetical protein and the SARS 7b protein are the same. The SARS 7b protein is a structural protein of the SARS corona virus virion [21]. A ClustalW [22] multiple sequence alignment between all five SARS7b proteins is shown in Figure 8, illustrating their similarity to each other.
regulatory protein for HokC
hypothetical protein ECs5456
74.3
copper-binding, calcium-binding (58.6%)
L-rhamnose mutarotase
hypothetical protein ECs4828
97.1
metal-binding, mRNA binding, calcium binding, magnesium binding (58.6%)
Hypothetical proteins were also found in Salmonella Typhi Ty2 that had annotated counterparts in E. coli K12. These are summarized in Table IV. The high % identities between the proteins strongly suggest that the annotated proteins in E. coli K12 have the same function as the hypothetical proteins in Salmonella typhi Ty2. The SVMProt probabilities of correct predictions for two of the hypothetical proteins (t0532 and t0642) are also very high, with values of 99% and 98.3%, respectively. Interestingly, for hypothetical protein t1841, SVM-Prot classified it as belonging to the “all lipid binding proteins” family, with a probability of correct classification of 71.3%. The next highest probability was 58.6% which corresponded to the “DNA binding” protein family. This classification agrees with the annotated counterpart of hypothetical protein t1841 in E. coli K12. By using the information provided by SVM-Prot, as well as the information provided by the annotated counterparts, more information about the function of the hypothetical proteins can be gained. Table IV: Annotated proteins in the genome of E. coli K12 aligned with hypothetical proteins of the Salmonella Typhi Ty2 genome. The % identity is the pairwise identity between the K12 reference protein and the Salmonella hypothetical protein. The protein family prediction by SVM-Prot and the probability of correct classification is shown in parentheses. E. coli K12 protein
Salmonella Typhi Ty2 protein
% identity
Protein family prediction (Prob.)
deoxyribonucleoside 5'-monophosphatase
hypothetical protein t0532
91.0
cobalt, manganese, copper binding (99.0%)
undecaprenyl pyrophosphate phosphatase
hypothetical protein t0642
80.3
transmembrane (98.3%)
DNA-binding protein, hemimethylated
Hypothetical protein t1841
92.4
All lipid-binding proteins (71.3%) DNA binding (58.6%)
CoreGenes SARS proteomes analysis
Figure 7: CoreGenes analysis of the five SARS coronavirus strains. This analysis catalogs ten proteins in common between these proteomes.
Figure 8: ClustalW multiple sequence alignment of the SARS 7b structural protein from the five SARS strains. In SARS MA-15 and SARS BJ202, this protein was annotated as “hypothetical” and “putative uncharacterized,” respectively. Asterisks indicate conserved residues.
4
Conclusions
The two global whole genome data mining software tools GeneOrder and CoreGenes, which are available at the GMU server http://binf.gmu.edu:8080/GeneOrder3.5 and http://binf.gmu.edu:8080/CoreGenes2.0, provide the ability to data mine the genomes of bacteria and viruses (and eukaryotic organelles), enabling a fuller and better use of the burgeoning genome sequence databases. The webbased nature of the tools makes it easier and convenient for bench-based researchers to analyze viruses and bacteria, especially their pathogenic serovars. The ability to annotate hypothetical proteins in related genomes enhances their utility.
5
Acknowledgments
We are grateful to the Regents of the University of California for the public access and use of the Ptolemy Plot package.
6
[9] Pavesi G, Mauri G, Iannelli F, Gissi C and Pesole G. (2004). GeneSyn: a tool for detecting conserved gene order across genomes. Bioinformatics 20, 1472-4. [10] Carver TJ, Rutherford KM, Berriman M, Rajandream MA, Barrell BG and Parkhill J. (2005). ACT: the Artemis Comparison Tool. Bioinformatics 21, 3422-3. [11] Haas BJ, Delcher AL, Wortman JR and Salzberg SL. (2004). DAGchainer: a tool for mining segmental genome duplications and synteny. Bioinformatics 20, 3643-6. [12] Sinha AU and Meller J. (2007). Cinteny: flexible analysis and visualization of synteny and genome rearrangements in multiple organisms. BMC Bioinformatics 8, 82. [13] Kozik A, Kochetkova E and Michelmore R. (2002). GenomePixelizer--a visualization program for comparative genomics within and between species. Bioinformatics 18, 335-6.
References
[1] Tamames J. (2001). Evolution of gene order conservation in prokaryotes. Genome Biology 2, 1-11. [2] Overbeek R, Fonstein M, D’Souza M, Pusch GD and Maltsev N. (1999). The use of gene clusters to infer functional coupling. Proc. Natl. Acad. Sci. USA 96, 28962901. [3] Zheng Y, Roberts RJ and Kasif S. (2002). Genomic functional annotation using co-evolution profiles of gene clusters. Genome Biology 3, 1-9. [4] Tamames J, Gonzalez-Moreno M, Mingorance J, Valencia A and Vicente M. (2001). Bringing gene order into bacterial shape. Trends in Genetics 17, 124-6. [5] Bentley SD and Parkhill J. (2004). Comparative genomic structure of prokaryotes. Annu. Rev. Genet. 38, 771-91. [6] Liolios K, Mavromatis K, Tavernarakis N and Kyrpides NC. (2008). The Genomes On Line Database (GOLD) in 2007: status of genomic and metagenomic projects and their associated metadata. Nucleic Acids Res. D475-9. [7] Kaluszka A and Gibas C. (2004). Interactive geneorder comparison of multiple genomes. Bioinformatics 20, 3662-4. [8] Sakharkar KR and Chow VT. (2004). Exploring genome architecture through GOV: a WWW-based gene order visualizer. Bioinformatics 20, 984-5.
[14] Kent WJ. (2002). BLAT--the BLAST-like alignment tool. Genome Res. 12, 656-64. [15] Celamkoti S, Kundeti S, Purkayastha A, Mazumder R, Buck C and Seto D. (2004). GeneOrder3.0: software for comparing the order of genes in pairs of small bacterial genomes. BMC Bioinformatics 5, 52. [16] Gish W. (1996-2004). http://blast.wustl.edu [17] Zafar N, Mazumder R and Seto D. (2002). CoreGenes: a computational tool for identifying and cataloging “core” genes in a set of small genomes. BMC Bioinformatics 3, 12. [18] Cai CZ, Han LY, Ji ZL, Chen X and Chen YZ. (2003). SVM-Prot: Web-based support vector machine software for functional classification of a protein from its primary sequence. Nucleic Acids Res. 31, 3692-3697. [19] Kaper JB, Nataro JP and Mobley HLT. (2004). Pathogenic Escherichia coli. Nat. Rev. Microbiol. 2, 12340. [20] Deng W, Liou S-R, Plunkett III G, Mayhew GF, Rose DJ, Burland V, Kodoyianni V, Schwartz DC and Blattner FR. (2003). Comparative Genomics of Salmonella enterica Serovar Typhi Strains Ty2 and CT18. J. Bacteriol. 185, 2330-7. [21] Schaecher SR, Mackenzie JM and Pekosz A. (2007). The ORF7b protein of severe acute respiratory syndrome coronavirus (SARS) is expressed in virus-infected cells and incorporated into SARS-CoV particles. J. Virol. 81, 71831.
[22] Chenna R, Sugawara H, Koike T, Lopez R, Gibson TJ, Higgins DG and Thompson JD. (2003). Multiple sequence alignment with the Clustal series of programs. Nucleic Acids Res. 31, 3497-500.