Debugging FPGA-based Packet Processing Systems through Transaction-level Communication-centric Monitoring Paul E. McKechnie
Michaela Blott
Wim A. Vanderbauwhede
Institute for System Level Integration
[email protected]
Xilinx
[email protected]
University of Glasgow
[email protected]
Abstract
tion and their diagnosis relies on on-chip monitors and debug systems. In order to detect errors in implemented systems, tools have been developed which permit run-time monitoring of signals onchip. These tools record low-level information and tend to focus on monitoring a single location. There are two disadvantages to these low-level monitoring tools. First, low-level monitoring produces vast amounts of information, which can be difficult to comprehend. Secondly, to configure and use these tools effectively, the designer needs a detailed understanding of the low-level signalling within the system, which they may not necessarily have. For example, modern designs increasingly rely on libraries of reusable functions, known as intellectual property (IP) blocks, which are inserted into the design as black boxes. The internal signals and their required behaviour are normally unknown to the user. Thus, a designer integrating IP blocks is unlikely to be familiar with the interface standards and associated low-level signalling of every IP block forming the system. As implementations may contain errors and designers may not understand the low-level signalling, there is a need for a tool which can provide a high-level observation of events on-chip. Transaction-based communication-centric monitoring, proposed by Goossens et al. [4], is one method of recording high-level observations. This method provides four main benefits, which address some of the limitations of low-level tools. First, transaction-based monitoring abstracts low-level details into high-level operations, which addresses the need for understanding low-level information. Second, monitoring low-level signal transitions requires high data rates for transferring data off chip. This may also require a significant number of external pins, which may not be available for debugging purposes. By using a transactional representation, the low-level details can be abstracted from the designer and may reduce the data rate and the number of external pins required. Third, communication-centric monitoring only records the interactions between IP blocks, which can highlight misconceptions concerning component intercommunication. This information can be used to recommend a location of interest for further low-level monitoring, if required. Fourth, transaction level monitoring requires fewer resources. Smaller resource requirements will generally reduce the impact on system timing and ease the burden of routing the design. Consequently the instrumentation is less intrusive and less likely to impact the system’s behaviour. Furthermore, the debug infrastructure must also remain within the resource limitations of the monitored device, as otherwise it cannot be observed on-chip. Transaction-based communication-centric monitoring was proposed as a method of monitoring Network-on-Chip (NoC) applications. However, this technique can equally be applied to FPGAbased systems to provide a system-level perspective of component interactions. This technique provides abstraction of low-level details by presenting the user with high-level events. The main
The fine-grained parallelism inherent in FPGAs has encouraged their use in packet processing systems. Debugging and performance evaluation of such complex designs can be significantly improved through debug information that provides a system-level perspective and hides the complexity of signal-level debugging. In this paper we present a debugging system that permits transactionbased communication-centric monitoring of packet processing systems. We demonstrate, using two different examples, how this system can improve the debugging information and abstract lower level detail. Furthermore, we demonstrate that transaction monitoring systems require fewer resources than conventional RTL debugging systems and can provide a system-level perspective not permitted by traditional tools. Categories and Subject Descriptors B.6.3 [LOGIC DESIGN]: Design Aids General Terms Design, Verification Keywords debug, FPGA, instrumentation, monitoring, transaction
1.
Introduction
The computational requirements of networks are increasing due to ever-rising bandwidth requirements and to support additional services such as access control, load balancing and encryption. Field Programmable Gate Arrays (FPGAs) are increasingly being exploited to perform these network processing functions as device densities match design requirements. FPGA implementations can also offer advantages in terms of power and performance over other alternatives. However, the increasing complexity of FPGA systems makes them susceptible to errors and subsequently more difficult to test and debug. Traditionally, FPGA-based systems are tested through simulation. However, this is a time consuming process and cannot guarantee designs to be free of defects. Formal verification techniques, such as property checking, equivalence checking and static timing analysis, complement simulation as they mathematically prove design properties. However, even with the plethora of tools available to aid the designer, errors may still occur in the final implementa-
Permission to make digital or hard copies of all or part of this work for personal or classroom use is granted without fee provided that copies are not made or distributed for profit or commercial advantage and that copies bear this notice and the full citation on the first page. To copy otherwise, to republish, to post on servers or to redistribute to lists, requires prior specific permission and/or a fee. LCTES’09, June 19–20, 2009, Dublin, Ireland. c 2009 ACM 978-1-60558-356-3/09/06. . . $5.00 Copyright
129
types of events in packet processing systems are memory accesses, packet transfers and interrupts. These high-level events contain the same information obtained by interpreting low-level signal transitions. As a result, transactions are recorded directly negating the need to record individual signal transitions. Furthermore, the data rates for transferring information off chip are reduced due to the use of abstract information. Additionally, the reconfigurable nature of the FPGA can be exploited to include instrumentation which is tailored to the requirements of the system being observed. Consequently, the resource requirement for monitoring the system is small. Communication-centric monitoring focuses on the interaction between IP blocks, which reduces the amount of data to be recorded and avoids changes to components. These properties are essential for debugging complex FPGA-based packet processing applications. In this paper, we present the architecture of a system-level monitoring tool for FPGA-based packet processing applications. The monitoring system consists of probes, a collector and software for executing on a host computer. We have instrumented two complex example designs to validate our approach. These examples show that the resulting debug system is significantly smaller than conventional tools. They further illustrate that transaction-level observations are useful as they provide a system-level understanding of the design by abstracting away the complexity of low-level signalling. In this way, they expose a different class of errors compared to traditional tools. Furthermore, the amount of data transmitted off chip is significantly reduced. The organisation of the remainder of this paper is as follows. Section 2 describes the background to on-chip monitoring. In section 3, we present the overall architecture of the debugging system. Sections 4 and 5 elaborate on the architecture of the probes and the collector in detail. In section 6, we illustrate the proposed debugging system using two case studies. The first case study is a simple firewall and the other is a webserver. Conclusions are presented in Section 7.
2.
Figure 1. Architecture of debugging system. WOoDSToCK (Watches Over Data STreaming On Computing element linKs) profiles the communication dataflow between computing processor elements. Assuming a single interface type with buffering, the system adds monitors to detect cycles when links are stalled or starved. This approach uses communication-centric monitoring and abstracts the low-level signalling from the designer but does not record individual transactions. It provides useful information for identifying bottlenecks but permits only limited observability of transactions between components. The BEE2 platform is a multi-FPGA system, which is designed for reconfigurable computing applications. It abstracts FPGA designs as user processes via the BORPH operating system. The debugging environment allows assertions and breakpoints to be created and variables to be recorded through pipes. This system abstracts low-level details for debugging purposes but is focused on recording system state. This method also hides the communication events from the user. Goossens et al. propose a debug infrastructure that introduces the concept of communication-centric transaction-level monitoring. As mentioned earlier, their system is designed for monitoring NoC applications. We have extended this concept to packetprocessing systems on FPGAs. The main difference between the debug systems lies in the use of a separate debug communication medium for FPGA designs. Additionally, the FPGA debug system needs to cope with multiple interface types. As such we believe that the proposed debugging system provides a new approach towards system-level debugging for FPGA-based systems.
Background
Historically, FPGA designs were comparatively small and on-chip monitoring tools focused on observing low-level information. Designers were interested in details such as signal timing and state machine transitions. However, the density of modern FPGAs permits complex designs, which are more susceptible to errors and difficult to debug. These complex designs have also introduced new classes of error, which are difficult to diagnose using existing tools. There are several tools which are designed for monitoring FPGA-based systems. These tools provide different methodologies and abstractions for debugging applications. Amongst these, there are commercially available on-chip debuggers such as Xilinx’s ChipScope[6][9], or Synplicity’s Identify[8]. These tools typically work on the RTL-level. Tools that aim to raise the abstraction for test and debug are mostly within the research community. We will briefly discuss the main features of WOoDSToCK[7], BEE2[1][2] and Goossens[3] while outlining differences to our proposal. ChipScope is an example of a typical FPGA debug system. It is designed to capture low-level data and has the flexibility to monitor any signal on an FPGA. The system provides a sophisticated triggering mechanism, which allows data capture to be controlled by complex sequences of low-level signal transitions. ChipScope can capture transactions but the designer needs an understanding of low-level signalling in order to set the triggers. Although ChipScope can capture transactions, it records low-level signal transitions which requires buffers on-chip. These buffers tend to be resource intensive. Furthermore, this approach exposes too much detail for effective understanding of system-level interactions.
3.
Debugging System Architecture
In the introduction we explained the need for a debugging system that provides a system-level perspective into the design under test. In this section, we present the architecture of such a monitoring system and the associated host software. This architecture will address the issues of low-level monitoring and provide unintrusive systemlevel monitoring by observing the communication interfaces on a higher abstraction level. The proposed debugging architecture is illustrated in Figure 1. It is comprised of a set of probes for monitoring different types of interfaces between components and a collector which communicates results from the FPGA to an external monitoring system. The collector is also responsible for configuring the probes at run-time. Each probe is designed to monitor a specific interface type and is customised to interpret the signal transitions as transactions over that interface. Probes must be connected directly to the interfaces being monitored but are passive in respect to interface signalling. Interface performance is not altered except for the effects of signal fanout and component displacement. The resource requirements of the probe may impact the placement and routing of adjacent system components, which can potentially affect overall system timing.
130
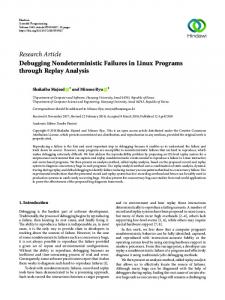
Idle
!sof_n !eof_n/ transaction
Packet Transfer
Figure 3. State transitions for monitoring a LocalLink interface interpreters for a variety of interface types including GMII, LocalLink, on-chip memory and PLB. As will be shown in section 4.1, the resource requirement for transaction interpretation is very small but interpreting transactions is not sufficient to understand the operation of the system. In order to observe events of interest, a filtering mechanism needs to be applied. The filtering mechanism consists of a data extraction circuit, memory for the operand and a comparator. Filtering reduces the debug information to relevant events and further reduces the bandwidth required to communicate results to the host software. Finally, clock domain crossing is required to cope with the complexity and size of modern designs which frequently incorporate multiple clock domains.
Figure 2. General architecture of probe. The debugging system uses a direct connection from each probe to the collector. The connection is a level-sensitive signal, which can indicate the occurrence of a transaction on each clock cycle. This mechanism abstracts all transactions to a common representation, which permits multiple probes to be used regardless of the interface type. The type of the monitored interface is known prior to synthesis negating the need to collect that information during system execution. The level-sensitive signal may also need to cross clock domains, since the interpretation of transactions is performed on the same clock domain as the interface being monitored but the result is transferred to the clock domain of the collector. The debugging system also requires software to execute on a host. The host software is responsible for recording and interpreting the data transmitted by the monitoring system. There are two key aspects to interpreting the data. The first is the identification and interpretation of probe locations. Once the probes have been inserted into a design, the software needs to know the location of the probes. This allows the software to translate the probe identifier into a representation more meaningful to the designer. The second aspect is probe and collector configuration. Each probe needs to be given a configuration to allow correct operation of the filter. The collector also requires the specification of the trigger. Beyond this, the software needs to present the results to the user. Currently, this is done by formatting the data for use in other tools. Communication between the host software and the instrumented hardware design is based on a 115,200bps serial connection. In the future we plan to support JTAG as a communication medium. This monitoring architecture provides some advantages over existing on-chip monitoring tools. First, the collected samples are not held in separate probes. This allows all events to be related both temporally and spatially. Second, the probes do not hold data internally which reduces resource requirements and alleviates the effects of component displacement. The monitoring architecture allows the location of an error to be isolated quickly. This allows an erroneous IP block to be identified. However, this form of debugging cannot address every class of error. For example, an internal error condition within an IP block cannot be isolated using system-level observations. A low-level monitoring tool, such as ChipScope, is required to isolate the error following identification of the erroneous IP block.
4.
4.1 Transaction Interpretation The interface of an IP block can be represented as a set of wires, which function collectively to perform operations. The signal values of the wires can be defined as the state of the interface. A transaction is therefore a sequence of state transitions, which represent an operation as shown in Figures 3 and 4. The transaction interpreter is responsible for following the sequence of signal transitions and identifying transactions. As each interface type has a unique set of transition sequences, the transaction interpreter must be customised for the individual types. For example, LocalLink and PLB are two different types of interconnect, which have different interface compositions. LocalLink is a Xilinx standard for packet interfaces, which contains a number of optional extensions. For the purposes of this discussion we will focus on the core set of wires, which are data, sof n, eof n, src rdy n and dst rdy n. As shown in Figure 3, the start and end of a frame are indicated by a low value on sof n and eof n respectively. Packets are transferred in the period between these transitions with no limit specified on the amount of data transferred. Consequently, LocalLink allows the sender and receiver to stall transmission in the event that either is unable to complete the request on a given clock cycle. The sender and receiver initiate stalls by raising the src rdy n and dst rdy n signals respectively and may assert them indefinitely. The CoreConnect PLB bus is an IBM standard for connecting peripherals to a processor. PLB is a fairly complex standard, which permits multiple simultaneous operations through separate read and write buses. For the purpose of this discussion, we will focus on the signals required to monitor a master interface. A PLB master is able to initiate read and write requests, whereas a slave can only respond to requests. The core signals for FPGA implementations of PLB are M Abus, PLB MRdDBus, PLB MWrDBus, M request, M RNW, PLB MaddrAck, PLB MrdDAck, PLB MwrDAck and PLB MTimeOut. Furthermore, there are signals available for burst transfers but these are omitted from this discussion as they do not aid in conveying the basic concepts. A read request is initiated by asserting M request, asserting the address on M Abus and simultaneously driving M RNW high. Alternatively, a write request is initiated by driving M RNW low. In both cases, the request is acknowledged through the signal PLB MaddrAck. The PLB MTimeOut signal is used to abort a request if the slave has not responded in the correct number of clock cycles. The slave then replies using the ap-
Probe Architecture
Each probe consists of three main components as shown in Figure 2. These components are transaction interpretation, filtering and clock domain crossing. The probes are customised for monitoring specific interface types but the architecture has been generalised to facilitate rapid development of new probes. The transaction interpreter provides a common representation of the low level signalling regardless of the interface being monitored. We have implemented
131
4.2 Filter Read Ack
The filter is responsible for determining whether a transaction should be recorded. The filtering capabilities of the probes can take one of two forms. The first form concentrates on filtering payloads transferred over an interface. For example, direct interfaces such as GMII tend to transfer blocks of data such as packets. The second form focuses on filtering addresses. Shared-medium interfaces such as PLB tend to be memory addressed. In this instance the destination of a transaction becomes more important than the data being transferred. Payload filtering is supported by matching the data presented on the data bus against a preconfigured register. The transaction interpreter is responsible for indicating when a comparison should be executed. The comparison itself may be a simple exact comparison, a comparison with support for bit-level masking, or the comparison of any expression given in disjunctive normal form. The form used will be dependent on the debug requirements of the designer with the understanding that the latter two methods are more resource intensive. The resource requirements of the filter may be reduced by taking advantage of the FPGA resources for multi-cycle transactions. A 4-input lookup table is capable of storing 16 bits, which can be addressed for matching over 16 clock cycles. Lookup tables can also be combined to form distributed memory, which can be used to extend matching beyond 16 cycles. This method allows the comparator to maintain the same width as the data bus, which minimises resource requirements. Address filtering requires the use of a parallel comparator as only a single cycle is available for matching. The parallel comparator will use the spatial nature of the FPGA fabric to implement matching and may implement exact or maskable comparisons. Address filtering may also be used to monitor software execution within a system. The addresses of software functions can be obtained from most compilers and then used to configure probes that monitor memory or system buses. This technique can also be applied to the program counter of a soft processor, if this signal is available. Filtering transactions according to function addresses allows the designer to observe hardware communications in context with software operations.
Write Ack PLB_MrdDAck/ transaction
PLB_MAddrAck
PLB_MwrDAck/ transaction Idle
PLB_MAddrAck
M_request M_request & M_RNW & !M_RNW
Read Request
Write Request
Figure 4. State transitions for monitoring a PLB master interface
Table 1. Transaction interpreter resource requirements Interface LUTs Flip Flops Slices LocalLink 3 6 5 PLB 5 7 6 GMII 7 7 8 MII 4 6 6
propriate data bus for the request and acknowledges using the appropriate signal. A write request is fulfilled by the slave writing data to PLB MwrDBus and asserting PLB MwrDAck. A read request is fulfilled using PLB MrdDBus and asserting PLB MrdDAck. The separation of read and write data buses allows a read and write operation between different components to occur simultaneously over the bus. The transaction interpreters are designed to only record complete transactions. Incorrect transition sequences or aborted transactions are ignored. Missing transactions in the debug report can point to problems in the signalling sequences which can then be further analysed through conventional low-level tools. Table 1 illustrates the resource requirements for the transaction interpretation of LocalLink, PLB, GMII and MII. LocalLink, GMII and MII are direct media whereas PLB is a shared medium. As can be seen from the table, the resource requirements are minimal even for more complex protocols such as PLB. Although PLB is a complex standard, there is little effect on the resource requirements as each end-point can be monitored separately. This reduces the complexity and provides the user with information relating to the interface of a specific IP block. The transaction interpreters are designed to support subtypes of an interface through conditional instantiation of signalling components. These components are defined before synthesis as they need to be specified before the system can be instantiated. For example, LocalLink supports various widths of the data bus and allows conditional instantiation of optional wires, which might alter the functionality of the interface. The probes are parameterisable to allow the debugging system to match these variations.
4.3 Clock Domain Crossing Most nontrivial designs require multiple clock domains in order to operate correctly. For example, a system processing Ethernet frames will require a GMII interface operating at 125MHz. Following frame reception and buffering, the subsequent system components may use wider datapaths and a lower clock frequency in order to reduce the burden of meeting timing constraints. As the debugging system is designed to monitor several interfaces simultaneously, it is likely to be used to monitor interfaces operating in different clock domains. Thus, it must be able to cope with recording transactions and transferring the results over different clock domains. The proposed solution transfers all events to a common clock domain, which drives the collector. Transactions are represented as level-sensitive signals, which can be transmitted across clock domains using pulse synchronisation. This technique does not have any requirements on the speeds of the various clock domains and can be applied in all circumstances.
5.
Collector Architecture
As shown in Figure 5 the collector is composed of a probe identifier, timer, trigger, buffer and upload controller. The collector receives multiple level-sensitive signals that represent transactions being recorded by the attached probes. The probe identifier is responsible for giving each probe a unique identifier to be used by
132
clock frequency is often undesirable as placement and routing become more difficult and, generally, only a small part of the design operates at this frequency. A lower frequency is therefore more desirable but it should match the clock frequency of the majority of the design. This method maintains the relative order of events provided probes are connected to the collector using the correct priorities. The timer is also the highest priority event presented to the probe identifier. This event occurs when the counter rolls over. The current implementation uses a 24-bit counter, which gives a period of 0.335 seconds at 50MHz. It is possible to use a smaller counter to reduce the size of uploads but this would need to be balanced with an increased frequency of timer rollovers. 5.4 Upload controller and buffer
Figure 5. Architecture of transactional collector
The upload controller is responsible for uploading recorded data to the host. The events are initially placed into a buffer and then transmitted to the host. The buffer records the probe identifier and the time of the event according to the collector timer. The probe identifier is 8-bits providing a theoretical maximum of 255 probes after subtracting the timer rollover signal. Time is represented using 24-bits, which means that each event requires a total of 32-bits. The buffer can be composed of Block RAM or Distributed RAM. The Block RAM on a Spartan 3E device allows 512 entries for a 32-bit datapath. When the buffer is full the trigger is notified and event capture terminates. The buffer may alternatively be used as a FIFO, where 512 entries may be adequate to permit continuous monitoring in certain circumstances. While there is data present in the buffer, the upload controller will transmit it to the host.
the host software. The start and end of data collection is controlled by the trigger. The timer is used to present the temporal relationship between events and the upload controller is responsible for transmitting the results to the host. 5.1
Probe Identifier
The probe identifier is used to assign an identifier to each probe before the event is uploaded to the host. This allows the host software to determine the location of each event. The identifier is also used by the trigger to determine when to start data capture. The number of probe connected to the probe identifier is specified as a parameter during synthesis, which allows the collector to be tailored to the system being monitored. As multiple events may be recorded on the same clock cycle, the level-sensitive signals are registered to preserve any events received. The probe identifier is implemented as a priority encoder which provides a deterministic method for multiplexing events. This allows the priority encoder to present the highest priority identifier followed by the second highest priority identifier on the following clock cycle. Multiple identifiers cannot be recorded simultaneously as the collector must multiplex events for serial transmission to the host. This means that the recorded transactions might not be cycle accurate. However, this level of detail is not required to convey a system-level perspective. Using a priority encoder also presents the potential for starvation. It is conceivable that one or more higher priority interfaces continually present events for identification preventing the lowest priority event from being recorded. In practice, this is generally not a problem as transactions usually occur over multiple clock cycles. This problem can be prevented by developing a profile of the frequency of transactions over an interface. 5.2
6.
We have instrumented two standard packet processing systems with the proposed on-chip monitoring system and analysed the results. Using these two case studies we hope to provide an insight into how to debug at the system level and demonstrate the resource requirements. The first case study is a hardware firewall, which uses a pipeline structure for forwarding and dropping packets. The second is a web server, which uses a processor, combined with other peripherals, to execute a HTTP server. We will describe these two case studies in more detail below. 6.1 Hardware Firewall We have implemented a prototype firewall system on an ML405 board and have instrumented the design. The firewall uses the FPGA fabric to perform parsing and forwarding operations. As shown in Figure 6, the firewall uses a Gigabit Ethernet MAC to send and receive Ethernet frames, which contain IP packets. The Ethernet MAC is connected by LocalLink to a bus width converter, which changes the width of the datapath from 8 bits to 32 bits. Following width conversion, the packet is parsed to determine whether it is a configuration packet and to extract the well-known 5-tuple. The rulebase is a content addressable memory, which contains the rules defining packet flows that are permitted for forwarding. Once a packet has been parsed, the rulebase is searched to determine whether it meets the criteria for forwarding. In the event that a configuration packet is received, the rulebase is updated and the packet is dropped. After parsing, non-configuration packets are sent to a buffer that delays processing to allow the rulebase to search its rule table. Following the delay, the packet is either dropped or forwarded depending on the outcome of the rulebase search. Assuming that the packet is to be forwarded, it then transferred to another bus width converter, which changes the width of the datapath from 32-bits to 8-bits. After which, the packet is then transmitted through the Ethernet MAC.
Trigger
The collector uses a run-time configurable trigger to determine when to start event capture. Once started, event capture continues until the buffer is full. The trigger complements the filtering present in the probes forming a distributed triggering system. The current implementation limits the number of probes to 16 but the concept can be easily extended. We are also considering extending the triggering mechanism to permit the use of transaction sequences to start event capture. 5.3
Case Study
Timer
The collector uses a single timer to relate all events to a common clock domain. This maintains the accuracy of clock domains on lower frequencies but exhibits inaccuracies for higher frequency domains. This does not mean that the timer needs to operate using the highest clock frequency in the design. Operating at the fastest
133
Admin
Search
Write Mem i/f
GMII
8-bit LL
Gigabit Ethernet MAC GMII
8-bit LL
LocalLink Bus width Converter (8 -> 32 bit)
LocalLink Bus width Converter (32 -> 8 bit)
32-bit LL
Rulebase
Result
Write Mem i/f
Packet Parser
32-bit LL
Read Mem i/f
Packet Buffer
32-bit LL
Drop/ Forward
32-bit LL
Figure 6. Firewall architecture.
Figure 7. Transactions over Firewall. The IP blocks in this system allow monitoring in 11 locations; these are on the RX and TX GMII interfaces of the Ethernet MAC, the 6 LocalLink interfaces comprising the pipeline and the 3 memory interfaces. Figure 7 is an illustration of the information obtained from a working system, which clearly shows the packet flow through the firewall. T1 shows a packet entering the system. T2 shows the packet being passed to the parser. T3 and T4 show the rulebase search and result transactions respectively. Finally, T5 shows the packet exiting the system. Figure 7 depicts the operation of the firewall but it also serves to illustrate the errors that can be detected. For example, if the packet buffer was to overflow, as shown in Figure 8, there would be no transactions recorded further down the pipeline. At stages before the packet buffer, executing transactions would not terminate due to back pressure signalled by the overflowed packet buffer, which is propagated to all previous stages in the pipeline. This would clearly identify the buffer as the source of the problem and as such make the location of an error obvious. This system-level perspective allows the designer to easily infer and isolate erroneous components. Alternatively, if the search was not started then no read would be recorded and the packet transactions would stop at the forwarding IP block. This information, which is not shown by other tools, makes the location of an error more obvious. It can also allow the designer to infer and isolate erroneous components. Table 2 shows the resource requirements of the firewall in a Virtex 4 FX and the available resources of the device. The firewall uses approximately 50% of the available slices. The instrumented design uses about 77% of the available slices to permit transaction level monitoring. The instrumented design uses a fixed IP packet parser with parallel matching. Alternative approaches can be used to parse a packet but these are not discussed in this paper. The design uses a single Block RAM as a FIFO for uploading the results. The same design instrumented using ChipScope requires approximately 92%
Figure 9. System architecture of Spartan web server of the available slices and an additional 21 Block RAMs. As each probe has its own Block RAM for data capture it is difficult to place the monitoring circuitry close to the locations of interest. This requires additional circuitry and resources to route signals from the location of interest to the Block RAMs. This suggests that a central collection mechanism may be better suited for monitoring system component interactions. 6.2 Spartan 3E Web Server Our second example is a prototype web server implemented on a Spartan 3E starter kit. The system uses a Microblaze soft processor, multiport memory controller (MPMC) and soft Ethernet MAC, as shown in Figure 9. The processor also requires a timer and interrupt controller to support the kernel and operating environment. The
134
Figure 8. Resultant transactions over firewall when packet buffer has overflowed.
Slices Slice Registers 4-input LUT BRAM BUFG
Table 2. Resource Utilisation of Hardware Firewall Uninstrumented Design Transaction Capture ChipScope 4300 6587 7906 5220 6503 9343 3908 7414 7070 9 10 31 9 9 10
Slices Slice Registers 4-input LUT BRAM BUFG
Table 3. Resource Utilisation of Web Server on Spartan 3E Uninstrumented Design Transaction Capture ChipScope Device Resources 3800 4013 4026 4656 3878 4296 4825 9312 4628 5162 5731 9312 13 14 19 20 7 7 8 24
system uses Xilkernel for thread scheduling, interrupt handling and IO. IP packet processing is handled by the lwIP stack. A simple web server application was written for the kernel, which is responsible for initialising the peripheral IP cores and configuring the lwIP stack during system boot. The web server also binds itself to port 80 and listens for connections. The architecture of the design is as follows. The Ethernet MAC is connected to an external PHY, which is connected to an Ethernet network. Internally, the Ethernet MAC is connected to the interrupt controller and the PLB bus. The Ethernet MAC has an internal frame buffer, which is accessible from the PLB bus. Upon receiving a frame, the Ethernet MAC buffers it internally and raises an interrupt. The interrupt is passed to the interrupt controller, which then interrupts the processor. The processor then receives the interrupt and determines which interrupt routine to execute by querying the interrupt controller. Once the processor has determined that the Ethernet MAC caused the interrupt, the interrupt handler then copies the frame from the buffer to main memory using the PLB bus. Once the frame is copied, the lwIP stack is notified so that it can be scheduled for execution by the kernel. Following this, the processor resumes its previous execution. When the lwIP is scheduled for execution by the kernel, the frame is validated by checking the addresses and calculating the appropriate checksums. Once the checks are complete, the web server is scheduled for execution and it is passed a pointer to the payload. The web server, upon receiving a request, spawns a separate thread to generate the response. This allows the web server to respond to multiple requests. The generated response is a simple text string representing an HTML page. The text string is passed back to the lwIP stack, where it is converted into a sequence of packets. The packets are then individually copied into the Ethernet
Device Resources 8544 17088 17088 68 32
MAC buffer, following which they are then transmitted by the Ethernet MAC. We have instrumented the design as shown in Figure 9. Probes have been placed to monitor interrupts between the timer, the Ethernet MAC and the processor. The PLB bus has also been instrumented to observe transactions on the bus. Finally, the MII interface has been instrumented with two probes for detecting packet transactions. As with the Firewall example, these probes provide the information to follow the packet flow and the associated transactions on a high abstraction level. Figure 10 illustrates the debug information obtained when the webserver responds to a webpage request. This figure shows the flow of events from receiving a frame on the MII interface through to the interrupt handler clearing the interrupt. It also shows the execution of software functions designed for receiving and sending Ethernet frames and generating the HTTP response. Finally, it also shows the flow of packets used to create a TCP connection, initiate an HTTP request and terminate the connection. The observed flow of packets has been validated by comparing the results to those captured using Wireshark[5]. Table 3 shows the resource requirements of the web server and the available resources of the Spartan 3E device. The system uses 82% of the available slices, which can make instrumentation difficult. The instrumented design uses 86% of the available slices. This system also has the ability to match several addresses on the PLB bus, which allows software function tracing. As the web server does not use a cache all processor instructions are transferred over the PLB bus. This allows the addresses of software functions to be matched as they are transferred over the PLB bus. The ChipScope implementation also uses approximately 86% of the available slices but also requires an additional 6 Block RAMs. The ChipScope instrumentation can also support software function monitoring but
135
Figure 10. Webserver response for HTTP web page request
References
is unable to relate the timing of software instructions relative to other events in the system.
7.
[1] Kevin Camera and Robert W. Brodersen. An integrated debugging environment for FPGA computing platforms. In International Conference on Field Programmable Logic and Applications (FPL), pages 311–316, Heidelberg, Germany, September 2008. [2] Kevin Camera, Hayden Kwok-Hay So, and Robert W. Brodersen. An integrated debugging environment for reprogrammble hardware systems. In Proc. International Symposium on Automated Analysis-driven debugging (AADEBUG), pages 111–116, Monterey, California, USA, September 2005. [3] Kees Goossens, C˘alin Ciordas¸, Twan Basten, Andrei R˘adulescu, and Andre Boon. Transaction monitoring in networks on chip: The onchip run-time perspective. In Proc. IEEE Symposium on Industrial Embedded Systems (SIES), pages 1–10, Antibes Juan-Les-Pins, France, October 2006.
Conclusions and future work
Due to the complexity of designs and the limitations of design tools, on-chip monitoring is frequently required to debug systems. We have presented a tool that provides a system-level perspective of component interactions, which is typically not available with other tools. The use of transaction-based communication-centric monitoring has reduced the resource requirements compared to traditional tools and reduced the data rate for uploading results. This method also abstracts low-level details offering the user a new perspective into the design, which allows a much improved localization of error conditions, delivers profiling data and other system-level insights into the design under test. In future, this work may be extended by implementing data capture from the filters. This would complement the filtering ability by presenting the designer with the values that met the filter constraints. Additionally, a packet and interface description language may be used to create transaction level triggers and configure filters as appropriate. Finally, we would like to consider an automated test system. A system-level description of a design would provide the ability to design a tool that automatically instruments FPGA designs, thus simplifying the test and debug burden on users.
[4] Kees Goossens, Bart Vermeulen, Remco van Steeden, and Martijn Bennebroek. Transaction-based communication-centric debug. In Proc. IEEE First International Symposium on Networks-on-Chip, pages 95– 106, Princeton, NJ, USA, May 2007. [5] Ulf Lamping, Richard Sharpe, and Ed Warnicke. Wireshark User’s Guide. Wireshark Foundation, 2008. URL http://www.wireshark.org/. [6] Orest Oltu, Petru L. Milea, and Alexandru Simion. Testing of digital circuitry using xilinx chipscope logic analyzer. In Proc. International Semiconductor Conference (CAS), pages 471–474, Sinaia, Romania, October 2005. [7] Lesley Shannon and Paul Chow. Maximizing system performance: Using reconfigurability to monitor system communications. In Proc. IEEE International Conference on Field-Programmable Technology (ICFPT), pages 231–238, Brisbane, Australia, December 2004. [8] Identify RTL Debugger. Synopsys, Inc., August 2008. URL http://www.synplicity.com/products/identify/.
Acknowledgments The authors would like to acknowledge the support of the Engineering and Physical Sciences Research Council (EPSRC) and Xilinx.
[9] ChipScope Pro 10.1 Software and Cores User Guide. Xilinx, March 2008. URL http://www.xilinx.com/ise/optional prod/cspro.htm.
136