Deep Convolutional Neural Networks for Airport Detection in Remote Sensing Images Ümit Budak, Abdulkadir Şengür, Uğur Halıcı Abstract—In this paper, we investigated the usage of deep convolutional neural networks (CNNs) on airport detection problem in remote sensing images (RSIs). Deep convolutional neural networks gained much attention in the last few years and numerous applications have been performed on computer vision area. Researchers generally approached the airport detection problem as a pattern recognition problem where firstly various distinctive features are extracted and a classifier is adopted to recognize the airports. CNNs, not only ensure a tuned feature vector but also yields better classification accuracy. Therefore, we used the CNN in airport detection. Our proposed method firstly detects various regions on RSIs and these candidate regions are used to train a CNN architecture. We used a CNN model which has 5 convolutional layers and 3 fully connected layers. We used normalization and dropout layers to build and efficient architecture. We also used a data augmentation strategy to reduce the overfitting. We performed several experimental works to evaluate the performance of the CNN. We also performed a comparative work to validate the efficiency of the proposed method. According to the obtained results, the proposed method yielded 95.21% accuracy. Index Terms—Airport detection, Remote sensing images, Deep convolutional neural networks.
I. INTRODUCTION
O
BJECT detection in Remote Sensing Images (RSIs) becomes a hot topic in image analysis and pattern recognition [1-3]. Roads, airports, buildings, forests, urban settlements and etc. are the interested objects in RSIs. Between these objects, airports are outshined due to their importance both in civil and military applications. Up to now, various airport detection methods have been conducted. These methods were either based on edge or line segment detection [4], or texture feature based image segmentation [1]. While edge or line segment based airport detection methods motivated from the runways of the airports, image segmentation based methods assumed that the airport regions have a special texture. Line based methods generally fail to distinguish between airport-runways and roads [5]. In addition, segmentation based methods generally use a sliding
U. Budak is with Department of Electrical-Electronics Engineering, Bitlis Eren University, Bitlis, Turkey (e-mail:
[email protected]). U.Halici is with the Department of Electrical and Electronics Engineering, Middle East Technical University, Ankara, Turkey (e-mail:
[email protected]). A Sengur is with Technology Faculty, Firat University, Elazig, Turkey (email:
[email protected]).
window which brings a computation burden [1]. Recently, several efficient airport detection algorithms proposed based on both line detection and texture feature extraction [6, 7]. These methods firstly use either line segments or visual saliency or combination of them in order to detect various regions as airport candidates, and then texture features are extracted on these candidate regions [7, 8]. A classifier is finally adopted to classify the candidate regions into airport or non-airport based on the extracted features. More recently, a new topic has highly attached the researchers in the machine learning community called deep learning [9]. It finds various applications especially it outshined in classification of the huge image dataset into large classes [9]. Convolutional Neural Network (CNN) is known as an efficient image feature extractor, which was biologically inspired Multi-Layer Perceptrons (MLPs) [10]. Typically, CNN architecture consists of a number of convolutional and pooling layers followed by fully connected layers [10]. The convolutional layers contain local filters, which are tuned during the training of the CNN architecture to exploit the strong spatially local correlation present in input images. CNN is deduced as leading image classification architectures with state of the art performance on many image classification applications such as hand written digit recognition [11], traffic signs classification [12], and 1000 class ImageNet dataset classification and localization [9]. Although such applications, best of our knowledge, the CNN has not been applied on airport detection problem yet. Thus, in this paper we propose a deep CNN based airport detection system. Inspiring from the efficient airport detection schemes [5], a two stages airport detection scheme is also adopted in this work. The first stage aims to locate various regions as candidate airport regions in the input RSI. To this end, we consider the methodology that was proposed in [5]. Budak et al. developed an efficient candidate airport region extraction based on an improved LSD algorithm [13]. The developed candidate airport region localization scheme has six steps. The algorithm starts with the application of the LSD algorithm, and then a short line elimination procedure is adopted. A line segment labelling procedure is considered in the following step in order get the relations between line segments. A regularization step and a line segment connection step are in the subsequent steps of the algorithm. After line segment connection step, another line segment labelling procedure is applied to re-labelling the line segments. The too long and too short line segments are
removed in final step of the algorithm. In the second stage, we consider a popular deep CNN architecture [9]. Krizhevsky et al. developed the AlexNet architecture which consists of 5 layer of CNN and 3 fullyconnected layers for large scale image classification [9]. Extensive experiments are conducted to evaluate the performance of the proposed scheme. Accuracy, sensitivity and specificity values are used in the evaluation. We also conduct several experiments to compare the performance of proposed method with previously proposed methods. The results show that the deep CNN outperforms the previously proposed methods. The paper is organized as follows; in Section 2, we briefly review the CNN. Experimental work is given in Section 3. Conclusions are given in Section 4. II. CONVOLUTIONAL NEURAL NETWORK (CNN) Recently, CNN becomes a popular tool for image classification/recognition and image retrieval applications. Although MLPs can be used for the similar purposes, to obtain enough good generalization performance, it is better to consider prior knowledge into the network architecture [10]. CNN aims to incorporate spatial information between pixels of an input image into network architecture. CNN contains two basic operations namely; convolution and pooling. These operations are embedded in the sequential layers of the network. Performing convolution and pooling operations construct the high level features on which classification is performed. The classification is performed in the fully connected layer of the CNN architecture. In CNN architecture, there is a huge number of parameter that needs to be adjusted during CNN training. For keeping the number of parameters tractable, the weights of convolutional nodes in the same map are shared. The training of CNN is handled with the conventional back propagation algorithm. CNN has three different types of layer; 1-) Convolution layer: This layer is known as the core layer of the CNN architecture. There are a bunch of learnable filters in this layer. During training of he CNN, each filter is convolved across the width and height of the input volume in the forward pass. After convolution operation, 2-dimensional activation maps of that filters are constructed. As a result, the network learns filters that activate when they see some specific type of feature at some spatial position in the input. 2-) Pooling Layer: Pooling is another important concept of the CNN architecture. It forms a non-linear down-sampling. Pooling operation can be handled with several non-linear functions. Max pooling seems the most common, where the input image is partitioned into a set of non-overlapping rectangle sub-regions. For each sub-region, the maximum value is used as output. The pooling operation reduces the spatial size of input which also reduces the amount of parameters and computation in the network. 3-) Fully Connected Layer: After several convolutional and pooling layers, the classification process is handled in fully connected layer. Neurons in a fully connected layer have full connections to all activations in the previous layer. Their activations can be computed with a matrix multiplication
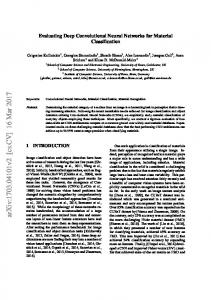
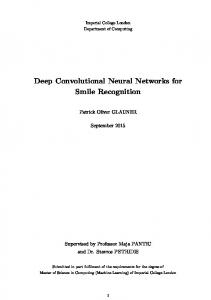
followed by a bias offset. III. EXPERIMENTAL SETUP A. The Architecture of the CNN The input to CNN is a fixed size of 224x224x3 color image. The mean color image, which is computed on training color images, is subtracted from each pixel. The CNN model has 5 convolutional layers and 3 fully connected layers. The first convolution layer employs 64 filters of size 11x11. The convolution stride is 4 pixels. Rectification linear unit (RELU) and local response normalization layers follow the first and second convolution layers. There are 5 Max-pooling layers in the architecture which follow some of the convolution layers. The pooling operation is performed over a 3x3 pixel window, with stride 2. The second convolution layer filters the output of the previous layer by using 256 filters of size 5x5. The convolution stride is 1 pixel and spatial padding is 2 pixels. The third convolutional layer also employs 256 filters of size 3x3. The convolution stride and spatial padding is 1 pixel. There is only a RELU layer which follows the third convolutional layer. The fourth and fifth convolutional layers have the same structure of third convolutional layer. As we mentioned earlier, three fully connected layers follow the convolutional layers. All fully connected layers have 4096 channels. There are two dropout layers, which come after first and second fully connected layers, with probability 0.5. Finally, a loss layer is used in the last layer. A number of loss functions can be used in loss layer. B. Dateset Construction Various experiments were conducted to evaluate the performance of the proposed method on real RSIs that were obtained from Google Earth containing airports worldwide [14]. The size of the airport images is 3000×2000 with 1m resolution. Totally, 92 images were collected. 48 of them were randomly selected for training and the rest was used for testing. The labeling of the candidate region was handled visually. If 40% of a candidate region overlaps with true airport region than that candidate region was labeled as positive (airport), otherwise the candidate was assumed as negative (not airport). Thus, 89 airport regions and 251 nonairport regions were labelled in training images and 68 airport regions and 245 non-airport regions were labelled in test images. Several samples of airport and non-airport regions are shown in Fig. 1 and 2 respectively. C. Dateset Augmentation We opted to enlarge the training dataset artificially in order to reduce the overfitting. Firstly, input images were flipped on X, Y and XY axis, respectively. We then rotated input images 90o and -90o. In addition, the rotated images were also flipped on Y axis. Therefore, we obtained 8x(89+251)=2720 images. An example of data augmentation is illustrated in Fig. 3. Figure 3 (a) shows the original image. In Fig. 3 (b,c and d), a flipped version of the original image on to X, Y and XY axises are shown. We did not do any enlarging operation on test dataset.
Fig. 3. Data augmentation, a) original image, b) Flipping on X axis, c) Flipping on Y axis,d) Flipping on XY axis. D. Results
Fig. 1. Airport regions
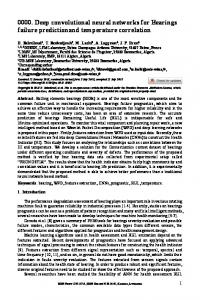
We used MATLAB 2014b on a computer having an Intel Core i7-4810 CPU and 32 GB memory. We also used the MaTConvNet Tool to generate the CNN model [15]. The CNN model was trained using stochastic gradient descend. The batch size of 70 training instances was considered during training. The learning rate was changed in the logarithmic space with a proper incremental step. The soft-max loss function was considered in the loss layer. Initialization of the weights in each layer was handled over a Gaussian distribution which has 0 mean and 0.01 standard deviation. We further initialized the neuron biases in the second, fourth, and fifth convolutional layers, as well as in the fully-connected hidden layers, with the constant 1. In Fig. 4, we showed the 64 convolutional kernels of size 11×11×3 learned by the first convolutional layer on the 224×224×3 input images. Fig.3 illustrates the learned convolution kernels. It is obvious that the CNN model learned various frequency and orientation. In addition, the model learned various color blobs.
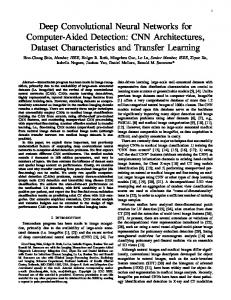
Fig. 4. 64 convolutional kernels of size 11x11x3 learned in the first convolutional layer. Fig. 2. Non-airport regions In Fig. 5, successfully detected airport images were given. In the first column of Fig. 5, the detected airport candidate regions were illustrated and in the second column of Fig. 5, the recognized airports were given.
(a)
(b)
(c)
(d)
second best accuracy with 94.6%. In addition, the method in [7], got the third best result where the accuracy was 88.6, and the GBVS-based method [6] yielded the worst accuracy, which is 83.6%. These results showed that we improved the performance of [5] where our result was 0.6% more accurate. In addition, our result was 6.6 % and 23.5% more accurate than methods [7] and [6], respectively. IV. CONCLUSIONS
Fig. 5. Successfully detected airport regions, a) Detected airport candidates, b) Recognized airports To evaluate the overall performance of the proposed scheme on the test set, the performance measures of accuracy sensitivity and specificity were considered. The obtained results were tabulated in Table 1.
Accuracy 95.21%
Sensitivity 94.12%
V. REFERENCES [1]
Table 1 Performance of the CNN model Classifier structure CNN
In this paper, we investigated the usage of deep CNN for airport detection problem. After potential airport regions were detected, a CNN architecture was trained for the purpose of airport recognition. CNN can not only extract the distinct features that characterize airports but also perform classification which outperforms than other methods. In the previous works authors generally performed airport detection based on SIFT features and SVM classification. The obtained results show that CNN yielded better results than compared methods.
Specificity 95.51%
As can be seen in Table 1, the CNN model obtained 95.21 % accuracy, 94.12% sensitivity and 95.51% specificity, respectively. While 298 candidate regions were classified correctly, only 15 candidate regions were mis-classified by the proposed efficient model. This results showed that the CNN model classified both airport and non-airport regions successfully. We also compared the proposed method with four methods presented in [5], [6] and [7]. These methods are chosen because of their successful results. In addition, the compared methods also have some similarity in the methodology. However, the proposed method is different and effective in feature extraction and classification stage. Convolutional kernels are quite efficient in order to extract the features that discriminate the airport and non-airport regions. In [7], the authors used SIFT features and SVM classifier and in [5], the authors used SIFT features and then the features were encoded based on Fisher Vector (FV). FV encoded features were then classified with Liblinear SVM. Table 2 Performance comparison with other methods Methods Accuracy Proposed method 95.2% Budak et al. [5] 94.6% Qu et al. [6] 71.7% Zhu et al. [7] 88.6% The related accuracy comparisons can be seen in Table 2, where the proposed method has accuracy of 95.2% and it outperforms the other methods. The method in [5] yielded the
[2]
[3]
[4]
[5]
[6]
[7]
[8]
[9] [10] [11]
[12] [13]
[14] [15]
O. Aytekin, U. Zongur, and U. Halici, “Texture-based airport runway detection,” IEEE Trans. Geosci. Remote Sens. Lett., vol. 10, no. 3, pp. 471-475, May 2013. W. Wang, L. Liu, C. B. Hu, and Y. M. Jiang, “Airport detection in SAR image based on perceptual organization,” in Proc. Int. Workshop M2RSM, Jan. 2011, pp. 1–5. [3] X. Wang, B. Wang, and L. Zhang, “Airport detection in remote sensing images based on visual attention,” in Neural Information Processing. Springer, 2011, pp. 475-484. [4] Z. Kou et al., S. Zhenwei, and L. Liu. “Airport detection based on line segment detector.” International Conference on Computer Vision in Remote Sensing (CVRS), IEEE, 2012. [5] U. Budak, U. Halıcı, A. Şengür, M. Karabatak, and Y. Xiao, “Efficient Airport Detection using Line Segment Detector and Fisher Vector Representation,” IEEE Trans. Geosci. Remote Sens. Lett., accepted. Y. Y. Qu, C. H. Li, and N. N. Zheng, “Airport detection base on support vector machine from a single image,” in Proc. 5th Int. Conf. Info., Commun. Signal Process., Los Alamitos, CA, USA, 2005, pp. 546-549. D. Zhu, B. Wang, L. Zhang, “Airport Target Detection in Remote Sensing Images: A New Method Based on Two-Way Saliency,” IEEE Trans. Geosci. Remote Sens. Lett., vol.12, no.5, pp.1096-1100, May 2015. C. Tao, Y. H. Tan, H. J. Cai, and J. W. Tian, “Airport detection from large IKONOS images using clustered SIFT keypoints and region information,” IEEE Trans. Geosci. Remote Sens. Lett., vol. 8, no. 1, pp. 128-132, Jan. 2011. A. Krizhevsky, I. Sutskever, and G. Hinton. ImageNet classification with deep convolutional neural networks. In NIPS, 2012. Y. LeCun, L. Bottou, Y. Bengio, and P. Haffner. Gradient-based learning applied to document recognition. Proc. of the IEEE, 1998. Y. LeCun, B. Boser, J. Denker, D. Henderson, R. Howard, W. Hubbard, and L. Jackel. Backpropagation applied to handwritten zip code recognition. Neural Comp., 1989. P. Sermanet, and Y. LeCun, Traffic sign recognition with multiscale convolutional neural networks. In IJCNN, 2011. R. G. Von Gioi, J. Jakubowicz, J. M. Morel, and G. Randall, “LSD: A fast line segment detector with a false detection control,” IEEE Trans. Pattern Ana. Mach. Intell., vol. 32, no. 4, pp. 722-732, Apr. 2010. https://www.google.com/maps, Last accessed: 10.03.2015 http://www.MatConvNet.org/, Last accessed: 05.04.2016.