DELPHI: A pattern-based method for detecting sequence similarity
by A. Floratos I. Rigoutsos L. Parida Y. Gao
We describe DELPHI, a new computational tool for identifying sequence similarity between a query sequence and a database of proteins. Use is made of a set of patterns obtained from the underlying database through a one-time computation. The patterns are subsequently matched against every query sequence presented to the system. A pattern matched by a region of the query pinpoints a potential local similarity between that region and all of the database sequences also matching that pattern. In a final step, all such local similarities are examined more closely by aligning and scoring the corresponding query and database regions. By prudently choosing a set of patterns, the method can be used to discover weak but biologically important similarities. We provide a number of examples using both classified and unclassified proteins that corroborate this claim.
assisted annotation techniques attempt to achieve this goal by exploiting the following biological fact: If two peptide stretches exhibit sufficient similarity at the sequence level, they probably are biologically related [1– 4]. More specifically, when presented with a query sequence Q (representing a protein) and a set D of well-characterized proteins, such techniques look for all regions of Q which are similar to regions of sequences in D. Substantial homologies are then used for transferring information from the sequences of D to the query sequence Q. The first approaches [5, 6] used for realizing this task were based on a technique known as dynamic programming. Unfortunately, the computational requirements of this method quickly render it impractical, especially for searching large databases (as is the current norm). The problem is, roughly speaking, that dynamic programming variants spend a good part of their time computing homologies which eventually turn out to be unimportant. In an effort to work around this issue, a number of algorithms have been proposed which focus on discovering only extensive local similarities; the best known are FASTA [7, 8] and BLAST [9]. In the majority of the cases, increased performance is achieved by first looking for ungapped homologies, i.e., similarities due exclusively to mutations and not insertions or deletions.
1. Introduction The first task following the sequencing of a new gene is to identify the function of its related protein. Computer-
娀Copyright 2001 by International Business Machines Corporation. Copying in printed form for private use is permitted without payment of royalty provided that (1) each reproduction is done without alteration and (2) the Journal reference and IBM copyright notice are included on the first page. The title and abstract, but no other portions, of this paper may be copied or distributed royalty free without further permission by computer-based and other information-service systems. Permission to republish any other portion of this paper must be obtained from the Editor. 0018-8646/01/$5.00 © 2001 IBM
IBM J. RES. & DEV.
VOL. 45 NO. 3/4 MAY/JULY 2001
A. FLORATOS ET AL.
455
456
The rationale behind this approach is that in any gapped substantial homology between two peptide strings, chances are that there exists at least a pair of substrings whose match contains no gaps. Locating these substrings (the ungapped homology) can then be used as the first step toward obtaining the entire (gapped) homology. Identifying the similar regions between the query and the database sequences is, however, only the first (and computationally most demanding) part of the process. The second part (the one that is of interest to biologists) is the evaluation of these similarities, i.e., deciding whether they are substantial enough to sustain the inferred relation (functional, structural, or otherwise) between the query and the corresponding database sequence(s). Such evaluations are usually performed by combining biological information and statistical reasoning. Typically, similarity is quantified as a score computed for every pair of related regions. Computation of this score involves the use of gap costs (for gapped alignments) and appropriate mutation matrices representing the evolutionary probability of any given amino acid changing into another (e.g., the PAM [10] and BLOSUM [11] matrices). Then, the statistical importance of this cost is evaluated by computing the probability (under some statistical model) that such a score could arise purely by chance [12, 13]. Depending on the statistical model used, this probability can depend on a number of factors such as the length of the query sequence and the size of the underlying database. Existing statistical frameworks are memoryless; whenever a homology is found between a region A of the query sequence and a region B of some database sequence, the similarity is evaluated without taking into account that A might also be similar to several other database regions. So, although seen in isolation the homology between A and B might seem statistically insignificant, this is certainly not the case when the overall objective is considered. In this work, we try to address this issue by introducing memory into our calculations. Memory is introduced by identifying groups of related oligopeptides, each of which appears unexpectedly many times in the underlying database. Each such group is represented by an appropriate regular expression, designated as a pattern (to be described precisely in the following section). Whenever a query sequence is presented to the system, we locate all of the query regions matching one or more patterns. Every match acts as a hypothesis of similarity between the query region and all of the database regions also matching a specific pattern. In a final step, all of these hypotheses are further examined by aligning and scoring the areas around the corresponding similarity regions. The highest-scoring among them are then reported to the user. The success of the method we propose here depends crucially on our ability to identify a set of patterns
A. FLORATOS ET AL.
characteristic of the underlying database. Previously there were no computational tools powerful enough to handle the task of pattern discovery in datasets of the size of existing protein databases. As a result, analogous efforts [14 –16] were restricted to patterns characterizing groups of proteins already known to be related. Here, however, we use TEIRESIAS, a new pattern-discovery algorithm [17, 18] which is suitable for use on large datasets. We are thus able to detect not only family-specific patterns but also patterns that appear to cross family boundaries. In the sections that follow, we describe the precise methodology used to obtain the patterns used, and give examples of the power of our new tool, designated as DELPHI, by applying the tool to both annotated and unannotated sequences. We also discuss how our approach can lead to extremely fast search times. The database used as a test bed in this work is SwissProt [19] Release 34, but the methodology we propose can be used on any protein database.
2. Motivation and definitions The key concept used is that of a pattern. Patterns are regular expressions describing families of polypeptides. As we explain later, the polypeptide family represented by a single pattern is expected to contain stretches of related amino acids (in which the nature of the relationship may be structural, functional, or evolutionary). More specifically, given the alphabet ⌺ of amino acids, we define a pattern P as a regular expression of the form ⌺ 共⌺ 艛 兵‘.’其兲* ⌺, where ‘.’ (referred to as the don’t-care character) denotes a position that can be occupied by an arbitrary residue. Since it is a regular expression, every pattern P defines a language G(P) of polypeptides consisting of all the strings that can be obtained from P by substituting an arbitrary residue from ⌺ for each don’t-care character. For the pattern “A.CHѠE,” for example, the following polypeptides are all elements of G(“A.CHѠE”): ADCHFFE
ALCHESE
AGCHADE.
Given a pattern P and a sequence S 僆 ⌺*, we say that P matches S if S contains a substring (a continuous stretch of residues) which is a member of G(P). Furthermore, if D ⫽ {S 1 , S 2 , . . . , S n } 債 ⌺*, we say that a given pattern P has support K (1 ⱕ K ⱕ n) within D if P exactly matches K of the sequences in D. We also define the offset list of P with respect to D (or simply the offset list of P, when D is unambiguously implied) as the set of pairs LD共P兲 ⫽ {共i, j兲 兩 P matches the substring of Si starting at offset j}.
IBM J. RES. & DEV.
VOL. 45 NO. 3/4 MAY/JULY 2001
As an example, consider the pattern P ⫽ “AѠDFE” and the set of sequences D ⫽ 兵S1 ⫽ GHASEDFER, S2 ⫽ LKERAHPDFE, S3 ⫽ LKMNAKLD}. In this set, the pattern P has support 2 (the boldface substrings indicate the sequence regions matching P), and its offset list is L D (P) ⫽ {(1, 3), (2, 5)}. A pattern P is regarded as being maximal with respect to D, if for every other pattern P⬘ that is more specific than P (i.e., P⬘ can be obtained from P either by substituting characters from ⌺ for don’t-cares or/and by extending P to the left or/and right) has an offset list strictly smaller than the offset list of P, i.e., 兩L D (P)兩 ⬎ 兩L D (P⬘)兩. In the context of pattern-discovery algorithms, it is always desirable to look exclusively for maximal patterns in order to reduce the redundancy of the output. Given a pattern P, the backbone of P is defined as a string over the alphabet {1, 0} obtained from P by turning every residue of P into the character “1” and every don’tcare into the character “0.” For example, the backbone of the pattern P ⫽ “AѠDFE” introduced above is the string B ⫽ “100111.” Backbones partition the set of patterns into equivalent classes, with each class containing all of the patterns sharing the same backbone. A pattern with backbone B is designated as a B-pattern. Another useful concept is that of the density of a pattern. Roughly speaking, the density describes the minimum amount of homology between any two members of G(P) and is defined by two integers L and W (L ⱕ W): A pattern P has an 具L, W 典 density if every substring of P that starts and ends with an amino acid and has a length of at least W contains L or more residues (notice that, by definition, an 具L, W 典 pattern has at least L residues). The integers L and W are parameters of our method, and their values control the amount of similarity allowed in the 1 searches performed. At the level of our pattern-discovery algorithm, the integers L and W define a structural restriction on the patterns to search for. More specifically, TEIRESIAS takes as input a set D of n sequences, and three integer parameters L, W, and K (where K ⱕ n). The algorithm produces as output the complete set of all of the maximal 具L, W 典 patterns that appear in at least K of the sequences in the set D. Given the above definitions, we now provide a first, informal description of our approach. It is composed of two distinct phases: information gathering and searching: ●
Information gathering: First, before any search is performed, the underlying database D is mined. During this step all of the significant 具L, W 典 patterns are
1
A more detailed discussion of these parameters as well as the TEIRESIAS algorithm can be found in [17, 18].
IBM J. RES. & DEV.
VOL. 45 NO. 3/4 MAY/JULY 2001
●
gathered, and each such pattern P is associated with its offset list L D (P) (the particular criterion used for deciding whether a pattern is significant is detailed in the next section). Searching: The second step is the actual search. Given a query sequence Q, we identify all of the patterns P (among those collected in the first phase of the process) which match the sequence Q. For every such P, we pair the region(s) of Q which match P with the corresponding regions of all database sequences that also match P [these regions are easily accessible through the offset list L D (P)]. Finally, the paired regions are extended and aligned in both directions and scored by the use of a (user-defined) mutation matrix, and the highest-scoring matches are reported along with implied alignments.
It is worth pointing out here that the informationgathering phase is a one-time computation over D. The results obtained are stored in a file and used every time a search session is performed over the database D. So although it is a time-consuming process (it can take several hours, depending on the size of D), it has to be performed only once. The usefulness of patterns in modeling biologically important protein regions is based on the fact that such regions are much less tolerant of mutations than regions of a subordinate role. It is then reasonable to expect that biologically related polypeptides can be identified by discovering a) conserved positions in their primary structure and b) an increased degree of reusability. In our terminology, these properties correspond to patterns with unexpectedly high support.
3. Methods As already mentioned, the methodology we propose comprises two phases: information gathering and searching. The first of these is the more computationally intense but has to be performed only once for every database D of interest. It is also the more important, because the success of the subsequent homology searches over D depend crucially on the quality of the pattern set collected during information gathering. In this section we describe the implementation of both phases. To facilitate the description, we discuss the two phases in reverse order, starting with the search phase. Searching During this phase, query proteins Q are provided to the system, and database sequences S 僆 D similar to Q are identified and reported back to the user. The searching phase utilizes a set ⌸ of patterns obtained (as explained later) by mining the input database D. For the purposes of this discussion, it is sufficient to assume that ⌸ is a set of 具L, W 典 patterns of the form described at the beginning of
A. FLORATOS ET AL.
457
Q = AFGHIKLPNMKAMGH W = 4, Position = 6 Substring starting at position 6
Hash value
KL
(first_char = K, last_char = L, gap = 0)
1,184
KLP
(first_char = K, last_char = P, gap = 1)
1,601
KLPN
(first_char = K, last_char = N, gap = 2)
1,394
KLPNM
(first_char = K, last_char = M, gap = 3)
1,291
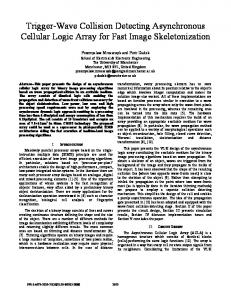
Figure 1 Hash values generated for the W 4 substrings starting at position 6 of the sequence Q. The hash value used for a substring s is H(s)[[av( first_char)–av(‘A’)][av(last_char)–av(‘A’)]*26]*W+gap, where av(c) is the ASCII value of the character c, first_char and last_char are, respectively, the first and last characters of s, and gap is the number of residues between the first and last characters of s. Notice that because of the < L, W > density restriction, gap is always less than W.
Q AFGHIKLPNMKAMGH W4
AF
1
GH
3 14
.. . G.I A..H
3 1 12
.. . Figure 2 Snapshot of the hash table generated for the sequence Q AFGHIKLPNMKAMGH. Instead of using actual numeric hash values to label the table entries, we use a pattern describing all of the strings that hash to a particular hash value. Each hash entry points to a list of offsets. Every offset in that list marks the beginning of a substring in Q which hashes to the relevant hash entry.
Section 2. Each pattern P 僆 ⌸ is accompanied by its offset list L D (P) and has support at least K min in D. The numbers L, W, and K min are parameters of our method, and the way in which they are set is described next.
458
Pattern matching Initially, when a query sequence Q is provided to the system, all P 僆 ⌸ that match Q are located. This can be done very rapidly by using a hashing variation of a technique presented in [20]. More specifically, for every
A. FLORATOS ET AL.
position within Q we generate W hash values, one for every substring of length 2, 3, . . . , (W ⫹ 1) starting at that position. For every such substring, the corresponding hash value depends only on the first and last characters of the substring as well as on the number of residues between those two characters. Figure 1 provides an example of the process for a given query sequence. The hash entry corresponding to a particular value h contains all of the offsets p of the query sequence Q such that a substring (of length at most W ⫹ 1) starting at p hashes to the value h. For example, Figure 2 shows a snapshot of the hash table generated for a particular query sequence. To check whether a pattern P 僆 ⌸ matches Q, we use an array of counters C[1Ѡ兩Q兩] of size equal to the length of Q. Initially, every entry of the array is set to 0. Starting at offset 1 in P, we locate all offsets j within P corresponding to a residue, excluding the offset corresponding to the last residue. For every such j, let R be the shortest substring of P starting at j and containing exactly two residues. Let OL denote the list of offsets in Q pointed to by the hash table entry corresponding to R. If OL is not empty, then for every offset p 僆 OL the counter C[ p ⫺ j ⫹ 1] is incremented by one. If the pattern P contains exactly n residues, then at the end of this process the counter C[i] will have the value (n ⫺ 1) if and only if Q matches P at offset i. (An advantage of this matching technique is that it typically requires time which is sublinear to the size of the query sequence Q and depends only on the number of residues in the pattern P.) Chaining and scoring Once a pattern P 僆 ⌸ is found to match a substring of Q starting at offset i, we must correlate that substring of Q with all of the database regions also matching P. This is easily done by scanning the offset list L D (P), which contains exactly those regions. More specifically, each entry ( j, k) 僆 L D (P) indicates that the substring starting at offset k of the jth database sequence S j is an element of G(P). The local similarity between the query sequence Q and the database sequence S j is then registered as a quadruplet (i, j, k, l ), called a segment, which is associated with S j . The number l ⫽ 兩P兩 is the length of the local similarity. Sometimes two distinct patterns P and P⬘ matching both Q and a database sequence S j correspond to the same local similarity between Q and S j . An example of such a situation is depicted in Figure 3. In such cases, the individual segments corresponding to the two patterns must be chained into one. In particular, two segments (i, j, k, l ) and (i⬘, j, k⬘, l⬘) associated with S j are designated as compatible iff k ⱕ k⬘, k ⫹ l ⫹ w len ⬎ k⬘, and k⬘ ⫺ k ⫽ i⬘ ⫺ i, where w len is an integer parameter (defined by the user) that allows for the chaining of
IBM J. RES. & DEV.
VOL. 45 NO. 3/4 MAY/JULY 2001
segments which do not intersect as long as one begins no more than w len positions after the end of the other. The segment resulting from chaining (i, j, k, l ) and (i⬘, j, k⬘, l⬘) together is [i, j, k, max(l, k⬘ ⫺ k ⫹ l⬘)]. Chaining of compatible segments takes place every time a new segment becomes associated with a database sequence S j , as the result of locating a pattern P 僆 ⌸ matched by both Q and S j . If there are segments already associated with S j which are compatible with the newly arriving segment, the relevant pair comprising the new segment and the existing segment is discarded and replaced by the segment resulting from their chaining. Having identified all of the local similarities between Q and the database sequences, we are left with the task of evaluating these similarities. This is done by assigning a score (using a user-defined scoring matrix) to every database sequence S j that is associated with at least one segment. Several options are available for the scoring function. One approach is to score each segment of S j individually and assign to S j the highest of these scores. Scoring a segment (i, j, k, l ) can usually be done as follows: ●
●
No gaps allowed: In this case the score is computed from the ungapped alignment implied by the segment, namely the alignment of the regions Q[i, i ⫹ l ⫺ 1] of the query and S j [k, k ⫹ l ⫺ 1] of the sequence. Furthermore, the user is given the option to extend the alignment “around” the segment by setting the variable extend; if this value is greater than 0, the score is computed from the ungapped alignment of the regions Q[i ⫺ extend, i ⫹ l ⫺ 1 ⫹ extend] and S j [k ⫺ extend, k ⫹ l ⫺ 1 ⫹ extend]. Gaps allowed: This option is available only when extend ⬎ 0; it permits a finer scoring of the area around the segment by allowing for gaps in that area.
Other scoring options are also possible, taking into account the relative order of the segments associated with the database sequence S j currently being scored. One possibility, after scoring each segment individually as described above, is to construct a directed, weighted graph. The vertices of this graph are the segments associated with S j , and there is a directed line between the segments (i, j, k, l ) and (i⬘, j, k⬘, l⬘) if i d i⬘ and k d k⬘. Every vertex is assigned a weight equal to the score of the corresponding segment, while every edge is weighted on the basis of a) the proximity of the two segments [i.e., the value of (i⬘ ⫺ i ⫺ l )] and b) the regularity of the displacement between the two segments [i.e., how different (i⬘ ⫺ i) is from (k⬘ ⫺ k)]. The score of a path within this graph is the sum of the weights of all of the vertices and edges of the path. The path with the maximal score is then computed, and that score is assigned to S j .
IBM J. RES. & DEV.
VOL. 45 NO. 3/4 MAY/JULY 2001
i
i'
Q k
Sj
k'
l l' i Q k
Sj
k'kl'
Regions in Q and Sj matching a pattern P; (i, j, k, l ) is the corresponding segment. Regions in Q and Sj matching a pattern P'; (i', j, k', l' ) is the corresponding segment. Result of chaining together the above two segments.
Figure 3 Each of the segments (i, j, k, l ) and (i', j, k', l' ) indicates a local similarity between the query sequence Q and the database sequence Sj. In the example shown here, the two segments are compatible, and they can be chained together into the single segment (i, j, k, k'kl' ).
Information gathering During this phase TEIRESIAS is employed in order to construct the set ⌸ of all of the significant 具L, W 典 patterns found in the database D under consideration. This is, in essence, a data-mining step in which D is exploited with the intention of discovering hidden relationships among the sequences of D. The approach involves focusing on those relationships which are “unexpected” and by virtue of that quality are also (it is hoped) of biological relevance. For our purposes, the significance of a pattern is described by its support within D. More specifically, we seek to define a number K min (the minimum support) such that every pattern with support at least K min can be shown to be statistically important. All such patterns (along with a few exceptions which do not abide by the minimum support requirement) are included in the set ⌸, the input to the search phase. As is perhaps evident by now, the quality of the results obtained in the search phase of our method depends crucially on the outcome of the information-gathering phase, which, in turn, depends on the selection of the parameters L, W, and K min . Setting the values of these parameters involves the consideration of a number of sometimes conflicting and interconnected factors. The ratio L/W, for example, describes the amount of homology allowed, during the search phase, between a query sequence and the proteins in D. A small value of L/W will permit the detection of weak similarities. Since several value pairs (L, W) lead to the same ratio L/W, what
A. FLORATOS ET AL.
459
8
2.5 Backbone 101001
Backbone 110001001 6
Log no. of patterns
Log no. of patterns
2
1.5
1
4
2 0.5
0
5000 10000 No. of matches (a)
15000
0
14
1000 1500 No. of matches (b)
2000
2500
20 Backbone 1101000011001
Backbone 1101010001
12
15
10
Log no. of patterns
Log no. of patterns
500
8 6 4
10
5
2
0
200
400
800
No. of matches (c)
0
50
100 No. of matches (d)
150
200
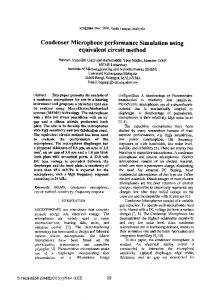
Figure 4 Distribution of patterns with given backbone structures in CleanSP ( ) and comparison with the random distribution () of the same backbones. A point ( X, Y ) in a curve indicates that there are Y patterns (of the given backbone structure) matched by X distinct sequences. From [21], reproduced with permission.
460
should the exact settings for L and W be? Opting for a large value of L usually results in a long running time for the information-gathering phase (unless L/W is close to 1). Furthermore, selecting a large L ignores weak patterns with only a few amino acids, which are among the ones that are of interest (i.e., are usually missed by existing similarity-searching tools). To address these points in the context of our test database, SwissProt (Release 34), we first cleaned up the database (this process is necessary for the removal of highly homologous sequences; details are given later in this section) and then applied the following procedure (from now on the cleaned-up version of SwissProt will be referred to as CleanSP). First we computed the support within CleanSP of every 具L, W 典 pattern with exactly L residues (for the values of L, W shown in Figure 4).
A. FLORATOS ET AL.
The results were tabulated by creating one row for each possible backbone: The ith column of the row corresponding to a given backbone B indicates the number of patterns (of that backbone structure) with support i within CleanSP. Then random distributions were obtained by following exactly the same approach for 2000 randomly shuffled versions of CleanSP (each such version was obtained by randomly permuting the amino acids within every sequence of CleanSP). In this case, the row for a given backbone B was obtained by averaging the rows corresponding to B in all 2000 tables. As a result, the ith column gives a relatively accurate estimate of the mean number of patterns with backbone B that appear in exactly i sequences within a random database having the sequence/residue composition of CleanSP. Figure 4 shows CleanSP results of selected backbones against the
IBM J. RES. & DEV.
VOL. 45 NO. 3/4 MAY/JULY 2001
distribution of the means for the same backbones. Although the results presented involve particular backbones, there is no qualitative change if other backbones are used. As Figure 4 implies, we begin to distinguish the compositional bias (in terms of patterns) in CleanSP versus a random database only when the value of L becomes 5 or larger. In general, the value of L depends on the size of the underlying database D: The larger the database, the higher this value should be. The results presented below for SwissProt were obtained using the value L ⫽ 6. For W we chose the value 15, so that the ratio L/W (corresponding roughly to the minimum allowed homology) is 40%. Having set the values of L and W, we must next decide what the minimum support K min should be. We focus only on patterns with exactly L residues, since every larger pattern contains at least one subpattern with exactly that many amino acids. One approach is to select K min so that the probability of a pattern appearing in K min or more distinct sequences is small. Similar significance criteria have previously been proposed and used [22–24]. A closer look at Figure 4(d), however, reveals that this approach might be too strict. In particular, consider a support level of K ⫽ 15. The random distribution indicates that one expects, by chance alone, one to two patterns with support 15. So, according to the aforementioned criterion, a pattern with support 15 within SwissProt would be deemed not important. However, the two distributions have a striking difference at that support level. In particular, while the mean of the random distribution at K ⫽ 15 has a value of about 1.5, within the SwissProt database there are about 180 patterns with support 15. Thus, it seems that if one considers the probability of a pattern in isolation, the result will be to discard many patterns which, according to the above distribution, are above the noise level. This observation prompts us to use a different criterion for significance. In our approach, instead of looking at individual patterns, we consider all of the patterns of a particular backbone structure. More specifically, for any given backbone B and an underlying database D, let N B,K be the number of patterns with backbone B which have support K within D, and let X B,K be the random variable (defined over the space of all shuffled versions of D) corresponding to N B,K . The minimum support K min is then the smallest number K for which the following inequality is true: max 兵Pr关XB,K ⱖ NB,K兴其 ⱕ threshold,
(1)
B
where threshold is a user-defined probability imposing a level of confidence on the minimum support K min coming out of the above inequality. A smaller threshold leads to a
IBM J. RES. & DEV.
VOL. 45 NO. 3/4 MAY/JULY 2001
larger value for K min and to a greater statistical importance for the patterns that will eventually be selected. Cleaning up the database Several databases contain groups of highly homologous sequences (e.g., the hemoglobin alpha-chain proteins). Such groups not only slow down the pattern-discovery process by introducing a huge number of patterns [18], but can also spuriously elevate the significance of a pattern; this occurs for patterns that appear many times within a family of highly homologous sequences and only occasionally outside it. To address this situation, a database D must be “cleaned up” before the pattern-discovery process begins. The cleaning-up process involves identifying and grouping together highly similar protein sequences. Two sequences are placed in the same group if, after being optimally aligned, the shorter one has X% of its positions (for the results in this work we used X ⫽ 50) identical to that of the longer sequence. The resulting groups are designated as redundant groups. The set D⬘ on which the informationgathering process will operate comprises a) those sequences in D which were not found to be sufficiently homologous to other proteins and b) the longest sequence from each of the redundant groups. Finally, each of the redundant groups is separately processed by TEIRESIAS, collecting patterns until all of the sequences of the group match at least one of these patterns. This approach guarantees that even groups representing multidomain proteins are treated correctly, by generating at least one pattern per domain. It is worth pointing out that patterns resulting from the processing of the redundant groups are usually quite dense (the number of residues is much larger than the number of don’t-care characters) and long. This is a consequence of the high homology of the group sequences. For such patterns, we allow approximate matches during the search phase. Low-complexity regions It is well known [25] that many proteins contain regions of low complexity, characterized by tandem repeats and/or overrepresentation of particular amino acids. The existence of such proteins within a database creates a number of problems during the process of similarity searching, because they can give rise to local homologies which, although statistically important, can be attributed to the compositional bias of the query and/or the database sequences. Several methodologies have been proposed for identifying low-complexity regions [26, 27]. Either of them can be used with our approach as well. One should be aware, however, that an extensive masking of such regions can sometimes lead to the loss of useful information. Such
A. FLORATOS ET AL.
461
Table 1 The cleanup process on SwissProt (Release 34) generates 9165 redundant groups of highly similar sequences. The cleaned-up database (the one on which the informationgathering phase operates) is formed by removing the highly similar sequences from the original input and then augmenting the resulting set by adding to it the longest sequence from each redundant group. From [21], with permission. No. of sequences/ No. of highly similar No. of sequences/ No. of amino acids sequences/groups No. of amino acids in original database in cleaned-up database 59,021/21,210,388
40,407/9,165
27,779/10,596,414
a situation is exemplified by the pattern “ALNAAѠ AAѠ A.” Although it is of low complexity, this pattern forms a highly specific signature for proteins involved in chemotaxis. Because of examples such as this, we have adopted in this work a rather moderate approach in masking lowcomplexity regions. At the level of information gathering, this approach consists of a) not considering streaks of the same amino acid of length L or more and b) disregarding, when computing the offset list of a pattern, matches due to overlapping substrings of a sequence. During the search phase, two mechanisms are available for prohibiting the association of two sequences along a potentially lowcomplexity region. The first permits the use of only a “linguistically rich” subset of the patterns discovered during information gathering. In particular, for each pattern P, we define its variability v(P) as v共P兲 ⫽ maxR 兵number of times that the residue R appears in P其 total number of positions in P covered by residues
,
and allow the user access to a global parameter V which dictates that a pattern P is employed in the search phase only if v(P) ⬍ V. The second mechanism allows the disregarding of local similarities of low informational content. Assuming that a pattern P matches a sequence (either the query or a database sequence) at offset j, the match is considered one of low complexity if there are X offsets left and right of j approximately matching P. The number X as well as the exact size of an approximate match are parameters that can be set by the user.
4. Results
462
In this section we discuss the results of the proposed methodology when applied to our test database, SwissProt (Release 34). Next, we present a quantitative and qualitative description of the patterns discovered in the information-gathering phase. More specifically, we analyze
A. FLORATOS ET AL.
the coverage that these patterns achieve for the SwissProt database, and we annotate the patterns that occur most frequently. Subsequently, we present the results of the search phase for a number of query sequences. Information gathering The treatment of the SwissProt database begins by cleaning it up as described in the previous section. The results of this process are detailed in Table 1. When the cleaned-up database is available, all that is required for TEIRESIAS to operate on it is to set the values of the parameters L, W, and K min . As already explained, we use the settings L ⫽ 6 and W ⫽ 15. In order to decide the value of K min , a threshold must be chosen and then used to solve inequality (1), a process we describe in the next few paragraphs. Since we do not have an analytical description for the distribution of the random variables X B,K , we resort to standard sampling techniques. Using the experiments described in Section 3 with the shuffled version of CleanSP, it is possible to compute quite accurate point estimates for both the mean and the deviation of X B,K . More specifically, for any B and K, let m B,K and s B,K denote the sample mean and the sample deviation of the random variable X B,K ; the values of m B,K and s B,K are computed from the 2000 experiments performed on the shuffled versions of CleanSP. Assuming that B,K and B,K are the actual mean and deviation of X B,K and using elementary statistics, we can deduce that, with probability at least 0.95 (in the relations below, n stands for the number of trials, i.e., n ⫽ 2000),
B,K ⱕ
sB,K 1⫹
1.96
;
冑2n
B,K ⱕ mB,K ⫹ 1.96
B,K
冑n ;
2 consequently, with probability no less than (0.95) ,
B,K ⱕ mB,K ⫹ 1.96
冑n
冉
sB,K 1⫹
1.96
冑2n
冊
.
Notice that there is no particular reason why we selected a confidence level of 95%. Any other level would be applicable (although more than n ⫽ 2000 samples would be required in order to achieve a higher confidence level). The above inequalities for B,K and B,K can be used in conjunction with Chebyshev’s inequality in order to provide upper bounds for the probabilities Pr[X B,K ⱖ N B,K ]
IBM J. RES. & DEV.
VOL. 45 NO. 3/4 MAY/JULY 2001
500 400 No. of patterns (Thousands)
Table 2 Coverage of the entire SwissProt (Release 34) database by the patterns generated in the informationgathering phase. The database regions covered by a pattern are exactly those substrings matching the pattern. Notice that for dense and long patterns (arising mostly from the processing of the redundant groups) we have allowed for approximate matches, in which “most” of the pattern (specifically, 80% of the pattern’s residues) matches a region. It is worth pointing out that most of the uncovered sequences are fragments. More specifically, only 231 have size greater than 50.
0
12,567,345
used in inequality (1). In particular, given any value N B,K , we define the number C as
冢
NB,K ⫽ mB,K ⫹ 1.96
冑n
冉
sB,K 1⫹
1.96
冑2n
冊冣
sB,K
⫹C
1⫹
1.96
冑2n
冤 冢
冑n
冉
1⫹
1.96
冑2n
冊冣
⫹C
50
sB,K 1⫹
1.96
冑2n
10
15
20 Length (b)
25
30
Figure 5
冥
ⱕ 1/C 2. Subsequently, solving inequality (1) is a straightforward task: We just compute the appropriate constant C for every value N B,K of interest and then plug the values 1/C 2 into inequality (1). Doing that for CleanSP and using a ⫺11 threshold value of 10 , we obtain K min ⫽ 15. Examining the results of TEIRESIAS, we find that the number of 具6, 15典 patterns with support 15 or higher is 534 185. Actually, in selecting the particular value of threshold to ⫺11 use, we did a little reverse engineering: The value of 10 is chosen so that, for each backbone B, no more than 1.5 B-patterns were expected by chance. There is a tradeoff at play here: We are willing to allow a small number of pattern-induced local homologies which can be the result of chance (the 1.5 patterns above) in order to be able to capture the many more statistically important similarities implied by the other patterns at that same support level present within SwissProt. Mining the cleaned-up database is only the first step of the information-gathering phase. It is also necessary to
VOL. 45 NO. 3/4 MAY/JULY 2001
100
5
ⱕ Pr关XB,K ⱖ B,K ⫹ C B,K兴
IBM J. RES. & DEV.
25
0
Pr关XB,K ⱖ NB,K兴 ⫽ sB,K
10 15 20 No. of residues in a pattern (a)
.
The above equation can be solved directly for C. We 2 can then use the value 1/C as an upper bound for the probability Pr[X B,K ⱖ N B,K ]:
Pr XB,K ⱖ mB,K ⫹ 1.96
5
150
58.1% No. of patterns (Thousands)
57,983
200 100
Total no. No. of proteins No. of amino Average percentage of patterns covered acids covered of protein length covered 565,432
300
Distributions for (a) number of residues per pattern and (b) lengths of the SwissProt (Release 34) patterns.
apply the pattern-discovery process on the 9165 redundant groups. Again we use TEIRESIAS to treat each such group, collecting enough 具6, 15典 patterns to make sure that each sequence in the group is matched by at least one pattern. These patterns are then added to the 534 185 patterns obtained from CleanSP in order to form the final set of patterns ⌸ which will be used by the search phase. Table 2 provides information regarding the coverage achieved by these patterns over the entire SwissProt Release 34, while Figure 5 shows distributions for characteristics of the patterns. As exemplified by Table 2, one of the key goals for the success of the search phase to follow (good coverage of SwissProt) has been achieved. The question that remains is whether the patterns discovered are of biological relevance. In an effort to address this concern, we have analyzed the most frequently occurring among these patterns. The results obtained for the 100 patterns with the highest support are summarized in Table 3. It is evident from the table (at least for the patterns which were examined) that the pattern-discovery process identifies sequence features that are biologically important.
A. FLORATOS ET AL.
463
Table 3 The 100 patterns with the highest support. Wherever possible, the patterns within a category were aligned with respect to one another. The lowercase italics were used for convenience and are placeholders for the following bracketed expressions: a: [STGDAR], b: [STGDK], c: [STGDKY], d: [STGK], e: [GASMDL], f: [GISETV], g: [LIVMFY], h: [LIVMF], i: [LIVMA], j: [LIVMC], k: [LIVMF], l: [ILVMF], m: [QKCS], n: [KRQA], o: [IVTNF], p: [QKCASN], q: [QKIAGN], r: [RKAHQN], s: [KRQNE], t: [KRQMN], u: [LFYIMS], and v: [AGSPE]. A bracket indicates a position that can be occupied by any one of the residues in the bracket. ATP/GTP-binding P-loop variations G..G.GKST G..G.GKaTL G..G.GKTT G..G.GKS.L G..G.GKT.L L.G..G.GKbT L.G..G.GKT L.G..G.GK..L G..GSGKS GP.G.GKT G..GSGKcT G....GKSTL L.G..G.GKS G..G.GKS..L L..G..G.GKT G.GKST....L G.SG.GKS I.G..G.GKS G.GKSTL G.GKST....L Protein kinase active site
L.G....GKST G...SGKST G....GKdTLL G.GKTT....L G..G.GKT..A G..GSGKT V...G..G.GKT G....GKTTL I.G..G.GKT G....GKST.L I...G..G.GKT G.GKTTL G.GKS.L...L G....GKS.LL L.G....GKT.L GSGKST G..GSG.ST I.G....GKST V.L.G..G.GK L.G....GKTT Collagen, P/G repeats
I.G....GKS.L G....GKT.LL L.G..G.G.T.L G....GKTT.L GP...GKT.L G.SG.G.ST G..G.G.S.LL L.G....GKS.L G.GKT..A...A I.G.SG.GK G.GKT.....LA L.eP.G.GKT GP...GKT..A V.I.G..G.GK TGSGKT I.G....GKTT G...SGKS..L G.SGSG.S G.fKSTL...L ABC transporter signature
HRDgK..N.L HRDhKP.N
G.PG..G.PG G..G.PG..G.P
LSGG...R...A
H.DiKP.N.L HRDL...N.L
G.PG..G..G.0 G..GP.GP.G
ATP-binding/downstream box
RDjKP.N.L I.HRDlK..N HRDkK..NI
G.PG.PG..G PG..G.PG..G G..G.PG.PG
I.H.DlK..N.L HRDLK..N
GP.G..G.PG PG.PG..G.P
IHRD....N.L H.DL.P.N.L
G.PG.PG....P PG.PG....PG
L.LDE....LD L.LDE.T..L
Protein kinases GT..Y.APE Nuclear hormone receptors
G..G..GAPG Zinc finger, transcription H.R.H.GEsP H...HTGEtP H.R.HT.E.P R.H.G.KP..C ATP-binding protein kinase
Homeobox DNA-binding motif
CRu.KC...GM C.vC..FFRR
WFQN.R.K WFmNRR.K WFQNRR WFQN.R.n.K V.oWFpNRR QV.oWFqNR
LG.G.FG.V LSGG.....A.A
464
It should be noted that not all of the discovered patterns exhibit such clear-cut functional specificity. Several of them correspond to regions (e.g., loops, coiled
A. FLORATOS ET AL.
coils, transmembrane) which are traditionally considered uninteresting, at least for the purposes of functionally annotating a protein. Sometimes, though, even such
IBM J. RES. & DEV.
VOL. 45 NO. 3/4 MAY/JULY 2001
High-scoring homologies between H31 HUMAN and the SwissProt sequences. Next to each sequence is given the similarity score (using the scoring table PAM 130) of the highest-scoring local alignment between that sequence and H31 HUMAN.
Table 4
H31 HUMAN (302)
H3 DROME (302)
H32 BOVIN (302)
H3 STRPU (300)
H3 PSAMI (300)
H32 XENLA (298)
H3 ACRFO (297)
H3 CAEEL (291)
H3 VOLCA (289)
H32 MEDSA (288)
H3 ENCAL (288)
H3 CHLRE (287)
H31 SCHPO (286)
H3 PEA (284)
H3 MAIZE (284)
H33 CAEEL (284)
H33 HUMAN (284)
H33 SCHPO (277)
H31 TETPY (274)
H34 CAIMO (272)
H3 EMENI (271)
H3 NEUCR (271)
H3 YEAST (269)
H32 ORYSA (269)
YB21 CAEEL (232)
H3 HORVU (221)
H34 MOUSE (204)
H3 ENTHI (179)
H32 TETAM (177)
H32 TETPY (176)
H33 TETTH (168)
H32 TETBO (153)
H3 LEIIN (110)
CENA HUMAN (100)
CSE4 YEAST (96)
YL82 CAEEL (86)
CENA BOVIN (84)
YMH3 CAEEL (79)
H3 NARPS (64)
weak similarities can provide useful hints for the characterization of protein regions. We have implemented two mechanisms that allow the exploitation of this potential. First, the user is provided with the list of all of the patterns which match the query sequence. An expert user will, in most cases, be able to identify which patterns are of biological importance. Selection of a particular pattern leads to a refinement of the scoring, focusing only on the areas of the database covered by this pattern. Second, when the underlying database includes annotations of the various database sequence regions, this annotation is used in conjunction with the patterns for the extraction of useful information. Examples of the use of these two mechanisms are given in the next subsection. Searching To showcase the searching phase (and to explain how it should be used) we have selected two query sequences. The first is a well-studied and annotated core histone 3 protein (SwissProt ID: H31 HUMAN), while the second is a not-yet-characterized ORF (SwissProt ID: YZ28 METJA) from Methanococcus jannaschii. H31 HUMAN Core histones have been the object of extensive study because of their central role in the packaging of DNA within a cell. These small proteins are rich in positively charged amino acids that help them bind to the negatively charged DNA double helix [28]. The four core histones (H2A, H2B, H3, and H4) bind together into an octameric construct (reminiscent of a cylindrical wedge) that provides the substrate for 146-bps-long DNA segments
IBM J. RES. & DEV.
VOL. 45 NO. 3/4 MAY/JULY 2001
to wrap around, thus creating the nucleosome complexes within the cell chromatin. The SwissProt database (Release 34) contains 33 sequences which are annotated as histones 3. The protein H31 HUMAN (the core histone 3 protein found in humans) is one of them. The top-scoring results of searching this sequence with our homology-detection tool are listed in Table 4. The scores shown were obtained using the PAM 130 matrix [10], and every matching sequence from the database is assigned the score of its highest-scoring segment. All of the 33 core histones 3 of SwissProt Release 34 were correctly identified as homologous to H31 HUMAN. Furthermore, several other proteins (YB21 CAEEL, CENA HUMAN, CSE4 YEAST, YL82 CAEEL, CENA BOVIN, YMH3 CAEEL) were found to have extensive local similarities to H31 HUMAN. Inspection of the annotation for these proteins indicated that they are known histone-3-like proteins. As a final note, H3 NARPS (a known histone 3) appears within Release 34 of the SwissProt database only as a fragment and for that reason has been scored lowest in the list of results. Figure 6 shows a selected view (both high- and low-scoring) of the alignments generated for the query sequence H31 HUMAN. YZ28 METJA H31 HUMAN is in a sense an easy test case because its database contains several sequences which are highly homologous to it. An interesting question to ask is how our methodology fares when presented with “borderline”
A. FLORATOS ET AL.
465
Score = 269 ********************************************************************* Local Alignment(s) with the sequence H3_YEAST Query 0 ARTKQTARKSTGGKAPRKQLATKAARKS ARTKQTARKSTGGKAPRKQLA+KAARKS ARTKQTARKSTGGKAPRKQLASKAARKS Seq 0 --------------------------------------------------------------------------Query 33 GVKKPHRYRPGTVALREIRRYQKSTELLIRKLPFQRLVREIAQDFKTDLRFQ GVKKPHRY+PGTVALREIRR+QKSTELLIRKLPFQRLVREIAQDFKTDLRFQ GVKKPHRYKPGTVALREIRRFQKSTELLIRKLPFQRLVREIAQDFKTDLRFQ Seq 33 --------------------------------------------------------------------------Query 96 EAYLVGLFEDTNLCAIHAKRVTIMPKDIQLARRIRGERA EAYLV LFEDTNL AIHAKRVTI KDI LARR+RGER EAYLVSLFEDTNLAAIHAKRVTIQKKDIKLARRLRGERS Seq 96 ---------------------------------------------------------------------------
Score = 100 ********************************************************************* Local Alignment(s) with the sequence CENA_HUMAN Query 45 VALREIRRYQKSTELLIRKLPFQRLVR L+EIR+ QKST LLIRKLPF RL R GWLKEIRKLQKSTHLLIRKLPFSRLAR Seq 45 --------------------------------------------------------------------------Query 77 FKTDLRFQSSAVMALQEACEAYLVGLFEDTNLCAIHAK D Q A++ALQEA EA+LV LFED L +HA RGVDFNWQAQALLALQEAAEAFLVHLFEDAYLLTLHAG Seq 79 --------------------------------------------------------------------------Query 111 IHAKRVTIMPKDIQLARRIRGERA +HA RVT+ PKD+QLARRIRG LHAGRVTLFPKDVQLARRIRGLEE Seq 113 ---------------------------------------------------------------------------
Figure 6 Local alignments of H31_ HUMAN with a highly similar (H3_ YEAST ) and a moderately similar (CENA_ HUMAN ) protein. For every sequence, a number of local similarities are indicated. For every such similarity, the relevant query (“Query” ) and the database sequence (“Seq”) regions are listed one under the other, having between them the resulting consensus regions. The character + is used to indicate chemically similar amino acids.
466
sequences, i.e., sequences for which no known homology exists. In an effort to address this question, the system was presented with the not-yet-annotated sequence YZ28 METJA, an open reading frame with 1272 residues from the genome of M. jannaschii. The top-scoring alignments produced by our system when presented with this query sequence are depicted in Figure 7. For the purposes of functional annotation of YZ28 METJA, the results are not very enlightening because the database hits include quite diverse protein sequences: the first two (NTNO HUMAN, NTNO BOVIN) correspond to sodium-dependent noradrenaline transporters, while the last one (KAPL APLCA) corresponds to a kinase.
A. FLORATOS ET AL.
With these questions in mind, we proceeded to a closer examination of the similarities between YZ28 METJA and the database sequences. For this analysis, every pattern matching YZ28 METJA was scrutinized individually. As mentioned at the end of the preceding subsection, the search phase allows the user to select any of the patterns matching the query sequence at hand and focus on the local alignments induced by that particular pattern, disregarding all of the other patterns. This feature was employed for each of the patterns matched by YZ28 METJA. The intention was to discover whether any such pattern was specific to one particular protein family, thus giving clues about the functionality of YZ28 METJA.
IBM J. RES. & DEV.
VOL. 45 NO. 3/4 MAY/JULY 2001
Score = 51 ********************************************************************* Local Alignment(s) with the sequence NTNO_HUMAN
Query
196 VEKDILPHKVAFTGGGLRFILYPERPILEE E + VA G+GL FILYPE HEHKVNIEDVATEGAGLVFILYPEAISTLS Seq 369 ----------------------------------------------------------------------------
Score = 51 ********************************************************************* Local Alignment(s) with the sequence NTNO_BOVIN
Query
196 VEKDILPHKVAFTGGGLRFILYPERPILEE E + VA G+GL FILYPE HEHKVNIEDVATEGAGLVFILYPEAISTLS Seq 367 ----------------------------------------------------------------------------
Score = 49 ********************************************************************* Local Alignment(s) with the sequence KAPL_APLCA
Query
816 NAMIEMFKENYKLLKEYLETDIEVLKELDKNYK A +F E K LKEYLE+ +E L MAHNQVFPESQKWLKEYLESSLEQFENLFNKNV Seq 0 ----------------------------------------------------------------------------
Figure 7 Top-scoring alignments for the query sequence YZ28_METJA. The mutation matrix used was PAM130. From [21], reproduced with permission.
As it turned out, there exist three patterns (“Y..S..I...DLK,” “NIL......IKL,” and “I.H.DLK......D”) which are very specific for the kinase family. Figure 8 describes several of the top-scoring alignments produced for the first pattern, while Table 5 contains a complete listing of all of the SwissProt database sequences containing that particular pattern. Tables 6 and 7 contain the corresponding listings for the remaining two patterns. Figure 9(a) depicts the distribution of all of the patterns matched by YZ28 METJA; Figure 9(b) shows the regions covered by the three kinase-specific patterns. The pattern “Y..S..I...DLK” generates 24 hits within the SwissProt database. All of these proteins (with the exception of NABA RAT, a sodium/bile acid cotransporter) are annotated as protein kinases (two of them, KD82 SCHPO and KKK1 YEAST, are characterized as putative/probable kinases), with the majority belonging or showing similarity to the serine/threonine kinase family.
IBM J. RES. & DEV.
VOL. 45 NO. 3/4 MAY/JULY 2001
Furthermore, “Y..S..I...DLK” not only belongs to the kinase domain of these proteins but actually contains the active site (amino acid D) of that domain. Similar results (Table 6) are obtained for “NIL......IKL,” the second of the three patterns. In this case there are 34 database hits, and all of them (excluding two unannotated ORFs from Yeast and Mycoplasma hominis) are known (or probable) protein kinases. Finally, the third pattern, “I.H.DLK......D,” generates 30 hits, all of them known or putative protein kinases. Furthermore, as in the case of the first of the three patterns, the pattern “I.H.DLK......D” includes the active site of the kinase domain. It is interesting to note that all three of these patterns are specific instances of (parts of) the general pattern [LIVMFYC].[HY].D[LIVMFY]KѠN[LIVMFYCT] [LIVMFYCT][LIVMFYCT],
467
A. FLORATOS ET AL.
Local alignments of sequence ----> YZ28_METJA along the pattern Y..S..I...DLK Local alignment with the sequence ---> MP38_MOUSE Score = 27 Query 24 DKYQINVSGIYNISDDILESDLKLHIAQLLFLI YQI Y S DI+ DLK + LIYQILRGLKYIHSADIIHRDLKPSNLAVNEDC Seq 129 ---------------------------------------------------------------------------Local alignment with the sequence ---> MKK2_DROME Score = 22 Query 24 DKYQINVSGIYNISDDILESDLKLHIAQLLFLI I Y S DI DLK IMHEICAAVDYLHSRDIAHRDLKPENLLYTTTQ Seq 121 ---------------------------------------------------------------------------Local alignment with the sequence ---> MP38_XENLA Score = 22 Query 24 DKYQINVSGIYNISDDILESDLKLHIAQLLFLI YQI Y S I+ DLK + LIYQILRGLKYIHSAGIIHRDLKPSNLAVNEDC Seq 130 ---------------------------------------------------------------------------Local alignment with the sequence ---> KRAF_CAEEL Score = 20 Query 24 DKYQINVSGIYNISDDILESDLKLHIAQLLFLI Q+ + Y S I+ DLK L+ + ILKQVSLGMNYLHSKNIIHRDLKTNNIFLMDDM Seq 581 ----------------------------------------------------------------------------
Figure 8 Several of the top-scoring local alignments for the query sequence YZ28_ METJA, induced by the pattern “Y..S..I…DLK.” The mutation matrix used was PAM130. From [21], reproduced with permission.
SwissProt (Release 34) sequences containing the pattern “Y..S..I...DLK.” All of them are annotated as protein kinases or probable/putative protein kinases (almost exclusively of the serine/threonine variety). The only exception is the protein NABA RAT, which is annotated as a sodium/bile acid cotransporter.
Table 5
468
MP38 MOUSE
MKK2 DROME
MP38 XENLA
KRAF CAEEL
DAPK HUMAN
PKX1 HUMAN
KAPC YEAST
KAPA YEAST
ASK2 ARATH
KCC1 YEAST
CC28 YEAST
KD82 SCHPO
SPK1 YEAST
SGK RAT
GCN2 YEAST
FUSE DROME
NABA RAT
KAPC ASCSU
KKK1 YEAST
KGPA BOVIN
KGPB HUMAN
KGP3 DROME
KGP2 DROME
KDC2 DROME
where the notation [XYZ] indicates a position which can be occupied by any of the residues X, Y, Z. This more general pattern is the PROSITE database [14] entry with accession number PS00108, namely the signature of the serine/threonine protein kinase active site. Note that this PROSITE signature is too specific for detecting a kinase catalytic site in the areas of YZ28 METJA covered by the
A. FLORATOS ET AL.
three patterns examined above. This situation (known in the language of artificial intelligence as overrepresentation of the training set) is typical of learning systems trained by a finite number of positive examples: There is always the danger that the set of positive examples (in this case, the specific set of known serine/threonine kinases used by PROSITE) is biased. Consequently, the features learned
IBM J. RES. & DEV.
VOL. 45 NO. 3/4 MAY/JULY 2001
Using existing annotation Of the 410 patterns matched by YZ28 METJA, only the three patterns analyzed above exhibit such clear-cut functional specificity. This does not mean that the remaining 407 are useless. As discussed in the preceding subsection, the kind of biological inference that can be drawn from a local similarity between two sequences is not always of a functional nature. Sometimes the homology indicates preservation of structure, and at other times it might correspond to functional units of a supporting role (e.g., DNA-binding domains) in the overall function of the sequences compared. In an effort to explore such weaker similarities, we have used the method described next to
No. of patterns covering a position
(here, the kinase signature), while explaining the observations, are not general enough to extrapolate efficiently to new instances of the family under consideration (i.e., there are false negatives). The cure for this difficulty is to use as large a training set as possible; this is the crux of the approach we propose here. Of course, it is also possible that our methodology creates the reverse problem, that of underrepresentation, in which case the patterns discovered explain too liberally the observed data and introduce false positives. However, until a definite answer is obtained from the appropriate laboratory tests, we offer the statistical significance and the functional specificity of the patterns examined above as indications that they do correctly model kinase activity.
60
30
0 Amino acid positions (arbitrary scale) (a)
Kinase pattern (b)
Figure 9 Distribution of the 410 patterns (among those discovered in the information-gathering phase) matched by YZ28_METJA is depicted in (a). A pattern “covers” a residue position if it starts before (or at) that position and ends after (or at) that position. Shown, for each residue position (x-axis), are the number of patterns ( y-axis) that cover that position. With regard to (b), the three kinase patterns discussed in the text match sequence regions that start at offsets 35 (pattern “Y..S..I…DLK ”), 112 (pattern “NIL……IKL”) and 1052 (pattern “I.H.DLK……D”). These offsets are depicted in (b) relative to the spikes of the pattern distribution in (a).
exploit the annotation available in the underlying database. We use the SwissProt annotation format.
Table 6 SwissProt (Release 34) sequences containing the pattern “NIL......IKL.” All (except those from the nonannotated YFH8 YEAST and YL11 MYCHO) are protein kinases (known or probable). Again, serine/threonine kinases are the majority. CC7 SCHPO
CDK2 ENTHI
CDK6 HUMAN
IPL1 YEAST
JKK1 HUMAN
JKK1 MOUSE
KG1Z YEAST
KKIA HUMAN
KNQ1 YEAST
KPBG MOUSE
KPBG RABIT
KPBG RAT
KS61 MOUSE
KS62 HUMAN
KS62 MOUSE
KS6A CHICK
KS6A XENLA
KS6B XENLA
MKK2 YEAST
MPK1 HUMAN
MPK1 MOUSE
MPK1 RABIT
MPK1 RAT
MPK1 XENLA
MPK2 HUMAN
MPK2 RAT
MPK2 XENLA
PAK1 SCHPO
PK3 DICDI
PKD1 DICDI
PKX1 HUMAN
ST20 YEAST
YFH8 YEAST
YL11 MYCHO
SwissProt (Release 34) sequences containing the pattern “I.H.DLK......D.” All of these sequences are known or probable protein kinases.
Table 7
ASK1 ARATH
ASK2 ARATH
CDK7 CARAU
CDK7 HUMAN
CDK7 MOUSE
CDK7 RAT
CDK7 XENLA
CTR1 ARATH
FUSE DROME
GCN2 YEAST
KCC4 YEAST
KD82 SCHPO
KEMK MOUSE
KFD3 YEAST
KKK1 YEAST
KP78 HUMAN
KPBG MOUSE
KPBG RABIT
KPBG RAT
KPBH HUMAN
KPBH RAT
KPK1 ARATH
KPSC HUMAN
SNF1 CANAL
SNF1 YEAST
SRK6 BRAOL
YNA3 CAEEL
IBM J. RES. & DEV.
VOL. 45 NO. 3/4 MAY/JULY 2001
CC2C DROME
CC2 DICDI
CC2 SCHPO
A. FLORATOS ET AL.
469
############################################################ ID ASK1_ARATH STANDARD; PRT; 363 AA. DE SERINE/THREONINE-PROTEIN KINASE ASK2 (EC 2.7.1.-). --------> I.H.DLK......D: Matching at offset 119 FT DOMAIN 4 260 PROTEIN KINASE. FT ACT_SITE 123 123 BY SIMILARITY. ############################################################ ID ASK2_ARATH STANDARD; PRT; 353 AA. DE SERINE/THREONINE-PROTEIN KINASE ASK2 (EC 2.7.1.-). --------> I.H.DLK......D: Matching at offset 119 FT DOMAIN 4 260 PROTEIN KINASE. FT ACT_SITE 123 123 BY SIMILARITY. ############################################################ ID CC2C_DROME STANDARD; PRT; 314 AA. DE CELL DIVISION CONTROL PROTEIN 2 COGNATE (EC 2.7.1.-). --------> I.H.DLK......D: Matching at offset 126 FT DOMAIN 8 287 PROTEIN KINASE. FT ACT_SITE 130 130 BY SIMILARITY. ############################################################ ID CC2_DICDI STANDARD; PRT; 296 AA. DE CELL DIVISION CONTROL PROTEIN 2 HOMOLOG (EC 2.7.1.-) (P34 PROTEIN DE KINASE). --------> I.H.DLK......D: Matching at offset 125 FT DOMAIN 10 288 PROTEIN KINASE. FT ACT_SITE 129 129 BY SIMILARITY. ############################################################ ID CC2_SCHPO STANDARD; PRT; 297 AA. DE CELL DIVISION CONTROL PROTEIN 2 (EC 2.7.1.-) (P34 PROTEIN KINASE). --------> I.H.DLK......D: Matching at offset 130 FT DOMAIN 4 293 PROTEIN KINASE. FT ACT_SITE 134 134 BY SIMILARITY.
Figure 10 Example of part of the output produced using sequences matching the pattern “I.H.DLK……D.” For every such sequence, the ID and DE lines are reported, giving the SwissProt name of the sequence and a short description of its functionality (for details, see the SwissProt user manual). Next follows the offset within the sequence where the match originates. Finally, there are the FT lines for all of the annotated regions having an intersection with the region covered by the pattern. From [21], reproduced with permission.
The SwissProt database associates with most of its sequences annotations of sequence regions (the FT lines [19]). In a typical region description, FT
470
DOMAIN
528
779
PROTEIN KINASE
the keyword “FT” denotes it as a region description line, and the remaining characters describe the region by giving its starting and ending positions (from residue 528 up to and including residue 779 of the relevant database sequence) and its annotation (a protein kinase domain). When presented with a pattern P, we can use the offset list L D (P) to locate all of the sequences in the database that match P. Assuming that S is such a sequence and that P matches the substring of S starting at offset j, if P happens to fall in an annotated region of S (either entirely or in part), we can associate this region with P. Performing this process for every sequence S that P matches gives rise to a set RS D (P) of regions associated with P. Figure 10 provides an example of part of the output produced by our system for one of the three kinase patterns described above.
A. FLORATOS ET AL.
Now, given a pattern P matching a subsequence A of a query sequence Q, the question is how to use RS D (P) in an effort to characterize A. A number of approaches can be used. For example, if RS D (P) is large enough and the majority of its members agree in their functionality, it can be inferred that A is quite likely to have the same functionality. Another consideration is the relative lengths of the pattern P and the regions described by the FT lines. If, for example, a pattern P has an extent of 15 residues while an annotated sequence region containing P has a length of 300 amino acids, one might not wish to transfer the annotation of that region to P. In conclusion, the end user is expected to apply his/her expertise in deciding how to best exploit the information provided by the system. Figure 11 shows two ways to use the sets RS D (P) for annotating regions of YZ28 METJA, thus extending part (b) of Figure 9. The first approach, depicted in part (c) of Figure 11, assigns an annotation X (e.g., X ⫽ transmembrane region) to a pattern P if 1) the size of RS D (P) is at least 15; 2) the majority (80%) of the regions in RS D (P) are annotated as X; and 3)
IBM J. RES. & DEV.
VOL. 45 NO. 3/4 MAY/JULY 2001
Performance The running time of a homology search for a query sequence Q depends on the size of the set of patterns ⌸ used and on the actual number of local similarities (induced by the patterns matching Q) between Q and the database sequences. For the case of the SwissProt (Release 34) database used here, typical searches for query proteins about a thousand residues in size take 4 – 6 seconds on a Pentium** 266-MHz computer with 256 MB of memory capacity. It should be mentioned that the running time reported above is achieved by keeping all of the program data (patterns and their offset lists) in memory. For the SwissProt database, this data occupies around 200 MB. However, from preliminary work [29] with the nonredundant protein database from the National Center for Biotechnology Information (NCBI), it seems that although the search-time components mentioned above are related to the size of the underlying database, this dependence is sublinear. In a sense, real protein databases induce a saturation of sorts on the size of ⌸ after a certain point; introducing new sequences in the database does not result in the generation of many new patterns. As a result, we expect that even as the size of the database used becomes larger, the performance of the search phase (both running time per search and memory used) will increase at a much slower rate.
5. Concluding remarks We have described a method, DELPHI, for performing sequence similarity searches based on the discovery of patterns over an underlying database D of proteins and the use of these patterns for the identification of homologies between a query sequence and the proteins of the database. The crucial step for the success of the method is the collection of a set of patterns which is characteristic of the database D. We have described a way to define this set precisely using statistical arguments and have discussed how patterns provide more sensitivity in identifying significant homologies by introducing memory into the statistical computations. We have shown how TEIRESIAS, a powerful pattern-discovery algorithm, can be used for obtaining the desired set of patterns. We have described the utility of DELPHI by using the SwissProt (Release 34) database as a test bed and showing how it can be used for annotating query sequences. Finally, in this context we have discussed the potential of exploiting the discovered patterns in conjunction with the annotation
IBM J. RES. & DEV.
VOL. 45 NO. 3/4 MAY/JULY 2001
60 No. of patterns covering a position
at least 50% of every region of RS D (P) annotated as X is covered by P. The second approach, depicted in part (d) of Figure 11, shares the first two requirements and relaxes the third by allowing the percentage of the annotated region covered by the pattern to be 30% or more.
30
0 Amino acid positions (arbitrary scale) (a) (b)
(c)
(d) Kinase
Transmembrane ATP binding
Leucine zipper DNA binding
Figure 11 Characterization of various segments of YZ28_METJA from the annotation of the patterns matching these segments. The annotation of the patterns is obtained by exploiting the information available for the various regions of the database sequences also matched by these patterns. The segments are again shown relative to the spikes of the distribution of patterns over the entire YZ28_METJA.
of the underlying database toward characterizing even weak similarities between the query and the database sequences. The DELPHI approach differs from other pattern-based tools for homology detection (e.g., BLOCKS [15]) in the completeness of the set of patterns used. The patterns are learned in an unsupervised way from a very large training set, that of all of the proteins within the underlying database D. There are no bias-creating prior assumptions on which sequences “should” be considered as members of the same family. As a result, the patterns discovered are expected to be more sensitive. Furthermore, by considering together sequences of distinct functionalities, the method facilitates the discovery of weak similarities that span family boundaries (e.g., patterns that describe transmembrane regions). Such similarities, although not sufficient for the inference of functional annotations, nevertheless provide useful information regarding the role of different parts of the query sequence under examination. Another advantage of the DELPHI approach pertains to the running times for homology searches. The speedup afforded by using patterns rather than scanning the entire database for every search can become a factor as the size of genomic databases increases ever more rapidly
A. FLORATOS ET AL.
471
(especially for users who wish to run in-house tests rather than use public servers). On the downside, the use of patterns may not make it possible to find all existing local homologies, as can be done with methods such as BLAST or FASTA. If there exists within the database a sequence S which is a singleton, in the sense that it has homologous regions with none or only a few other database proteins, a query sequence Q homologous to S will go uncharacterized because there will be no patterns to associate it with S. It is expected, however, that such situations will become increasingly rare as the size of the database used becomes larger. We intend to extend our work to a large-scale validation of the proposed methodology. To achieve that, we plan to use as queries members of a sizable and well-annotated sequence database (e.g., Pfam [30], SCOP [31]). For each query we plan to quantify the success of the annotation produced by DELPHI. Methodologies for doing so have already been proposed ([32]). Aggregating the results of this annotation experiment should provide us with a more precise idea about the overall effectiveness of DELPHI. We have already begun that work and expect to report our results in a forthcoming publication. **Trademark or registered trademark of Intel Corporation.
References
472
1. A. M. Lesk, “Computational Molecular Biology,” Encyclopedia of Computer Science and Technology, Vol. 31, A. Kent and J. G. Williams, Eds., Marcel Dekker, New York, 1994, pp. 101–165. 2. R. F. Doolittle, “What We Have Learned and Will Learn from Sequence Databases,” Computers and DNA, G. Bell and T. Marr, Eds., Addison-Wesley Publishing Co., Reading, MA, 1990, pp. 21–31. 3. C. Caskey, R. Eisenberg, E. Lander, and J. Straus, “Hugo Statement on Patenting of DNA,” Genome Digest 2, 6 –9 (1995). 4. W. R. Pearson, Protein Sequence Comparison and Protein Evolution, Tutorial of Intelligent Systems in Molecular Biology, Cambridge, England, 1995. 5. S. B. Needleman and C. D. Wunsch, “A General Method Applicable to the Search for Similarities in the Amino Acid Sequence of Two Proteins,” J. Mol. Biol. 48, 443– 453 (1970). 6. T. F. Smith and M. S. Waterman, “Identification of Common Molecular Subsequences,” J. Mol. Biol. 147, 195–197 (1981). 7. W. R. Pearson and D. J. Lipman, “Improved Tools for Biological Sequence Comparison,” Proc. Natl. Acad. Sci. USA 85, 2444 –2448 (1988). 8. D. J. Lipman and W. R. Pearson, “Rapid and Sensitive Protein Similarity Searches,” Science 227, 1435–1441 (1989). 9. S. Altschul, W. Gish, W. Miller, E. W. Myers, and D. Lipman, “A Basic Local Alignment Search Tool,” J. Mol. Biol. 215, 403– 410 (1990). 10. M. O. Dayhoff, R. M. Schwartz, and B. C. Orcutt, “A Model of Evolutionary Change in Proteins,” Atlas Prot. Seq. & Struct. 5, 345–352 (1978).
A. FLORATOS ET AL.
11. S. Henikoff and J. G. Henikoff, “Amino Acid Substitution Matrices from Protein Blocks,” Proc. Natl. Acad. Sci. USA 89, 915–919 (1992). 12. S. Karlin, A. Dembo, and T. Kawabata, “Statistical Composition of High-Scoring Segments from Molecular Sequences,” Ann. Statist. 2, 571–581 (1990). 13. S. Karlin and S. Altschul, “Methods for Assessing the Statistical Significance of Molecular Sequence Features by Using General Scoring Schemes,” Proc. Natl. Acad. Sci. USA 87, 2264 –2268 (1990). 14. A. Bairoch, P. Bucher, and K. Hofmann, “The PROSITE Database: Its Status in 1995,” Nucleic Acids Res. 24, 189 –196 (1996). 15. S. Henikoff and J. Henikoff, “Automatic Assembly of Protein Blocks for Database Searching,” Nucleic Acids Res. 19, 6565– 6572 (1991). 16. S. Henikoff and J. Henikoff, “Protein Family Classification Based on Searching a Database of Blocks,” Genomics 19, 97–107 (1994). 17. I. Rigoutsos and A. Floratos, “Motif Discovery in Biological Sequences Without Alignment or Enumeration,” Proceedings of the Second ACM Conference on Computational Molecular Biology (RECOMB’98), 1998, pp. 221–227. 18. I. Rigoutsos and A. Floratos, “Combinatorial Pattern Discovery in Biological Sequences: The TEIRESIAS Algorithm,” BioInformatics 14, No. 1, 55– 67 (1998). 19. A. Bairoch and R. Apweiler, “The SWISS-PROT Protein Sequence Data Bank and Its Supplement TrEMBL in 1998,” Nucleic Acids Res. 26, 38 – 42 (1998). 20. D. Gusfield, Algorithms on Strings, Trees and Sequences: Computer Science and Computational Biology, Cambridge University Press, New York, 1997, pp. 62– 63. 21. A. Floratos, I. Rigoutsos, L. Parida, Y. Gao, and G. Stolovitsky, “Sequence Homology Search Through LargeScale Pattern Discovery,” Proceedings of the Third ACM Conference on Computational Molecular Biology (RECOMB’99), April 1999, pp. 164 –173. 22. M. Suyama, T. Nishioka, and J. Oda, “Searching for Common Sequence Patterns Among Distantly Related Proteins,” Prot. Eng. 8, 1075–1080 (1995). 23. G. Thode, J. A. Garcia-Ranea, and J. Jimenez, “Search for Ancient Patterns in Protein Sequences,” J. Mol. Evol. 42, 224 –233 (1996). 24. A. Neuwald and P. Green, “Detecting Patterns in Protein Sequences,” J. Mol. Biol. 239, 698 –712 (1994). 25. S. Altschul, M. Boguski, W. Gish, and J. C. Wooton, “Issues in Searching Molecular Sequence Databases,” Nature Genet. 6, 119 –129 (1992). 26. P. Salamon, J. C. Wooton, A. K. Konopka, and L. Hansen, “On the Robustness of Maximum Entropy Relationships for Complexity Distributions of Nucleotide Sequences,” Comput. Chem. 17, 135–148 (1993). 27. J. C. Wooton and S. Federhen, “Statistics of Local Complexity in Amino Acid Sequences and Sequence Databases,” Comput. Chem. 17, 149 –163 (1993). 28. J. D. Watson, N. H. Hopkins, J. W. Roberts, J. Steitz, and A. M. Weiner, Molecular Biology of the Gene, Fourth Edition, The Benjamin/Cummings Publishing Company, 1987. 29. I. Rigoutsos, A. Floratos, C. Ouzounis, L. Parida, and Y. Gao, “Dictionary Building via Unsupervised Hierarchical Motif Discovery in the Sequence Space of Natural Proteins,” J. Proteins: Struct. Funct. Genet. 37, No. 2, 264 –277 (November 1999). 30. E. L. L. Sonnhamer, S. R. Eddy, and R. Durbin, “Pfam: A Comprehensive Database of Protein Families Based on Seed Alignments,” Proteins 28, 405– 420 (1997). 31. A. G. Murzin, S. E. Brenner, T. Hubbard, and C. Chothia, “SCOP: A Structural Classification of Proteins Database for the Investigation of Sequences and Structures,” J. Mol. Biol. 273, 535–540 (1995).
IBM J. RES. & DEV.
VOL. 45 NO. 3/4 MAY/JULY 2001
32. S. Park, K. Karplus, C. Barrett, R. Hughey, D. Haussler, T. Hubbard, and C. Chothia, “Sequence Comparisons Using Multiple Sequences Detect Three Times as Many Remote Homologues as Pairwise Methods,” J. Mol. Biol. 284, 1201–1210 (1998).
Received July 31, 2000; accepted for publication October 27, 2000
Aris Floratos First Genetic Trust, Inc., 9 Polito Avenue,
Lyndhurst, New Jersey 07071 (
[email protected]). Dr. Floratos is Director of Bioinformatics of the First Genetic Trust Corporation, responsible for the development of nextgeneration tools for analyzing genetic data. While the work described in this paper was being carried out, he was a Research Staff Member in the Computational Biology Center at the IBM Thomas J. Watson Research Center in Yorktown Heights, New York. He received a B.S. degree in computer science and engineering from the University of Patras, Greece, in 1991, and M.S. and Ph.D. degrees in computer science from New York University in 1995 and 1999, respectively. Dr. Floratos joined IBM at the Thomas J. Watson Research Center in 1996. His current work focuses on the application of sophisticated algorithmic and statistical tools for the analysis of data obtained from genome studies.
Isidore Rigoutsos IBM Research Division, Thomas J. Watson Research Center, P.O. Box 218, Yorktown Heights, New York 10598 (
[email protected]). Dr. Rigoutsos manages the Bioinformatics and Pattern Discovery group in the Computational Biology Center at the IBM Thomas J. Watson Research Center. He received a B.S. degree in physics from the University of Athens, Greece, and M.S. and Ph.D. degrees in computer science from the Courant Institute of Mathematical Sciences at New York University. He is currently a Visiting Lecturer in the Department of Chemical Engineering at the Massachusetts Institute of Technology. He has received a Fulbright Foundation Fellowship and has held an appointment as Adjunct Professor in the Computer Science Department at New York University. He is the author or coauthor of seven patents and numerous technical papers. Dr. Rigoutsos is a member of the Institute of Electrical and Electronics Engineers (IEEE), the IEEE Computer Society, and the American Association for the Advancement of Science.
Laxmi Parida IBM Research Division, Thomas J. Watson
Research Center, P.O. Box 218, Yorktown Heights, New York 10598 (
[email protected]). Dr. Parida is a Research Staff Member and works with the Bioinformatics and Pattern Discovery group of the Computational Biology Center at the IBM Thomas J. Watson Research Center. She received an M.S. degree in 1995 and a Ph.D. degree in 1998, both in computer science, from the Courant Institute of Mathematical Science at New York University. She joined the IBM Research Division in 1998 and has been working on computational problems arising in biology.
Yuan Gao IBM Research Division, Thomas J. Watson Research Center, P.O. Box 218, Yorktown Heights, New York 10598 (
[email protected]). Dr. Gao is a Research Associate in the Bioinformatics and Pattern Discovery group of the Computational Biology Center at the IBM Thomas J. Watson Research Center. He received his B.S. degree from Beijing University in 1992 and attended the University of Tennessee at Memphis for graduate study. After finishing his M.S. degree in biochemistry, he carried out his Ph.D. degree studies at the Department of Mathematical Sciences of the University of Memphis, completing work on the degree at the Thomas J. Watson Research Center. His primary research interests are motif-based protein structure and function prediction.
IBM J. RES. & DEV.
VOL. 45 NO. 3/4 MAY/JULY 2001
A. FLORATOS ET AL.
473