ing [2] (pathology, MRI, CT scan, etc.). ..... work is part of the DataCutter project [6], that provides ..... a generic message passing implementation, for example us-.
Design of a Framework for Data-Intensive Wide-Area Applications Michael D. Beynon, Tahsin Kurc, Alan Sussman, Joel Saltz Department of Computer Science University � of Maryland, College Park, MD 20742 beynon,kurc,als,saltz� @cs.umd.edu Abstract Applications that use collections of very large, distributed datasets have become an increasingly important part of science and engineering. With high performance wide-area networks becoming more pervasive, there is interest in making collective use of distributed computational and data resources. Recent work has converged to the notion of the Grid, which attempts to uniformly present a heterogeneous collection of distributed resources. Current Grid research covers many areas from low level infrastructure issues to high level application concerns. However, providing support for efficient exploration and processing of very large scientific datasets stored in distributed archival storage systems remains a challenging research issue. We have initiated an effort that focuses on developing efficient data-intensive applications in a Grid environment. In this paper, we present a framework, called filter-stream programming, that represents the processing units of a dataintensive application as a set of filters, which are designed to be efficient in their use of memory and scratch space. We describe a prototype infrastructure that supports execution of applications using the proposed framework. We present the implementation of two applications using the filter-stream programming framework, and discuss experimental results demonstrating the effects of heterogeneous resources on application performance.
1. Introduction Increasingly powerful computers have made it possible for computational scientists and engineers to model physical phenomena in greater detail. As a result, overwhelming amounts of experimental data are being generated by scientific and engineering simulations. In addition, large amounts
� This research was supported by the National Science Foundation under
Grants #ASC-9619020 (UC Subcontract #10152408), and by the Office of Naval Research under Grant #N66001-97-C-8534.
of data are being gathered by sensors of various sorts, attached to devices such as satellites and microscopes. There are many examples of large useful datasets from simulations [26, 29, 33], sensor data [25, 28], and medical imaging [2] (pathology, MRI, CT scan, etc.). The primary goal of generating data through large scale simulations or sensors is to better understand the causes and effects of physical phenomena. Understanding is achieved through running analysis codes on the stored data, or by a more interactive visualization that relies on the ability to gain insight from looking at a complex system. Thus, both data analysis and visual exploration of large datasets plays an increasingly important role in many domains of scientific research. Decision support database applications are similar to scientific applications because they deal with large quantities of data (relational data), and need to perform significant computation in processing the data. The value provided by decision support systems and data-mining algorithms depend greatly on the amount of data, and hence businesses are inclined to retain as much data as possible. Disks continue to become larger and cheaper making them commodity items. This helps to make it relatively easy to setup a large set of archival storage disks at a relatively low cost. For example, to build a large disk farm out of commodity PC components for the lowest current price: $400 for a motherboard with a Celeron or AMD K6-2 400MHz cpu and 64MB memory [9], four 40GB EIDE disks at $254 each [10] and a fast ethernet interconnect (100 Mbps), a farm of 8 PCs can present 1.25TB of disk space for less than $15K. The price point is sufficiently low to enable many such disk collections to be setup independently at multiple disparate locations, where local storage needs dictate. We anticipate that this trend will result in the emergence of islands of data, where cheap archival storage systems will be used to hold large locally generated datasets. Use of computation farms also is important for handling very large datasets in a reasonable amount of time. Oftentimes, high performance computation farms are where the data is generated (as in large scientific simulations), and the data may reside locally on the computation farm in an archival storage
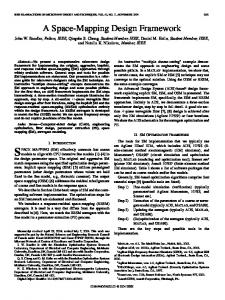
system such as HPSS [22]. Thanks to high-performance networks, increasing numbers of computation farms have become accessible across a wide-area network. These computation farms span a spectrum of widely varying configurations and computation power, from relatively inexpensive network of workstations and PC clusters to very expensive high-performance machines, providing computing performance in the order of Teraflops. These trends combine to present a new opportunity: very large distributed datasets that can be used by applications for computationally and data intensive analysis, exploration and visualization. Consider the following scenario: A scientist wants to compare properties of a 3D reconstructed view of a raw dataset recently generated at a collaborating institution, with the properties of a large collection of reference datasets. The 3D reconstruction operation involves retrieving portions of 2D slices from the regions in question, and then performing feature recognition and interpolating between the slices to extract the important 3D features. A description of these features and the associated properties are then compared against a database of known features, and some appropriate similarity measure is computed. The final result is the set of reference features found that are close in some way to those found in the new raw dataset, along with the corresponding view renderings to visualize.
gih�j k�lnm�o p]q`r:s t u#vxw y�z {}| ~
site where the sensor readings were taken. If the hosts containing the data are low-power archival systems that make the execution of the 3D reconstruction code prohibitively expensive, it becomes unclear how to structure the application for efficient execution. Ideally we would like to execute portions of the application at strategic points in the collection of machines. A set of possible locations for performing computation is indicated in the figure by question marks. For example, if the portion of code that performs the range select on the new raw dataset could be run on the host where the data lives, the amount of data to be transmitted over the wide-area network (WAN) would be reduced. The computation farm is an ideal location for the feature recognition and 3D reconstruction due to the parallelism inherent in the codes. Given the set of features that were identified, it would be efficient to perform the selection of similar features from the reference database on the data server where the database is located. The low end PC where the scientist is located can be used to collect the 3D rendering and the similar feature information for interactive presentation to the scientist. The success of this scenario depends on the application allowing portions of its computation to be executed in a distributed fashion. Beyond the mere possibility of execution in a distributed environment is the question of how efficient the application is. One interpretation of efficiency in this context is the ratio of useful data transmitted to the total amount of data transmitted between any two pieces of the application. For example, if an application transmitted a full dataset from a remote host, and discarded a large portion not required by subsequent processing, then this would not be considered efficient operation. We have initiated an effort to investigate and develop methodologies and a framework for efficient execution of applications that make use of distributed collections of datasets in a Grid environment. There are two main challenges in developing efficient applications in a Grid environment:
N 8:9=2?2@ A4B�C D6EGFIHKJML
f
Z/[]\ ^`_Ka2bMcId2e ����� -/.�0214365 7 �
�������������� �����!#" $�% &�'#(�) *!+#,
Y OQP R S2T6UWV6X
The Grid is composed of collections of heterogeneous resources. The characteristics, capacity and power of resources, including storage, computation, and network, vary widely. This requires that applications should be structured to accommodate the heterogeneous nature of the Grid. These distributed resources can be shared by many applications. This requires that applications should be designed to be optimized in their use of shared resources.
Figure 1. 3D reconstruction/visualization scenario on distributed collection of resources. Consider the problems that can occur when the application is executed in a Grid [16] environment. That is, the required resources (new raw dataset, reference database, and the scientist) are all at distributed locations in a wide-area network as seen in Figure 1. The reference database is likely to be stored in an image library, since the dataset is large and useful to many users. The new raw dataset is stored at the
In order to address these challenges, we are investigating:
2
Methodologies and a framework for structuring applications. In particular, we address decomposition of application processing into components and placement of these components onto a collection of heterogeneous resources that will aid efficient execution.
Feasibility and effects of exposing application structure and characteristics. In particular, we address exposing resource requirements and the communication pattern between application components, and how this extra application structure information can be used. An infrastructure for providing execution of applications that conform to the developed framework.
Figure 2. A simple example of this model is Unix system pipes, where the standard output of a process is used as standard input for another process. Unix pipes represent a linear chain of filters, each of which have a single input stream and a single output stream. The filter-stream model allows for arbitrary graphs of filters with any number of input and output streams.
©�ª «6¬®°¯K±/²i³ ´
In this paper, we present a framework, called filterstream programming, that represents the processing in a data-intensive application as a set of processing units, referred to here as filters, which are designed to be efficient in their use of memory and scratch space. In this framework, data exchange between any two filters is described via streams, which are uni-directional pipes that deliver data in fixed size buffers. We describe a prototype infrastructure that provides support for execution of applications using the proposed framework. We present the implementation of two applications in filter-stream programming framework, and experimental results to demonstrate the effects of heterogeneous resources on the performance of the applications.
iM}6// 6¡#¢�£�¤2¥¦�§�¨
Data);
VM_zoom::finalize() ¬ ® FreeToScratch(bufOut);
5.2. Filter Implementation
����'��
¬
¨�© ª «
Zoom query->Zoom;
Figure 5. Virtual Microscope decomposition Figure 6. The high-level code for zoom filter. In this implementation each of the main processing steps in the server is a filter:
reads the query from stream (st.ins[0]) and data chunks from stream (st.ins[1]), and subsamples the received data chunks using the zoom chunk function. The zoom filter uses scratch space to store results during subsampling and to pack the subsampled chunk into the output buffer. The result is written to the output stream (st.outs[0]), which connects the filters zoom and view.
read data: Full-resolution data chunks that intersect the query region are read from disk, and written to the output stream. decompress: Image blocks are read individually from the input stream. The block is decompressed using JPEG decompression and converted into a 3 byte RGB format. The image block is then written to the output stream. clip: Uncompressed image blocks are read from the input stream. Portions of the block that lie outside the query region are removed, and the clipped image block is written to the output stream. zoom: Image blocks are read from the input stream, subsampled to achieve the magnification requested in the query, and then written to the output stream. view: Image blocks are received for a given query, collected into a single reply, and sent to the client using the standard Virtual Microscope client/server protocol.
5.3. Experimental Results Using the filters described in Section 5.2, we have implemented a simple data server for digitized microscopy images [6], stored in the IBM HPSS archival storage system at the University of Maryland. An existing Virtual Microscope client trace driver was used to drive the experiments. This driver was always executed on the same host as the view filter, which is referred to as the client host. The server host is where the read data filter is run, which is the machine containing the disks with the dataset. The HPSS setup has 10TB of tape storage space, 500GB of disk cache, and is accessed through a 10-node IBM SP. In
Figure 6 illustrates the high-level code for the zoom filter, which has two input streams and one output stream. It 8
À Á Â�à 50
¯±°
Original Server
²R³
Response Time (sec)
ÄÅÆ
¸R¹
½¾¿
´Cµ
¶�·
Total Volume 3.60 MB 83.42 MB 57.83 MB 57.83 MB .90 MB
Filter Server
30
20
10
0
º�»�¼
Filter read data decompress clip zoom (no) zoom (8)
40
q1
Volume Per Chunk 102.52 KB 2373.04 KB 1645.02 KB 1645.02 KB 25.70 KB
q2
q3
q4
q5
Query
Figure 8. Query execution times for the original server and the filter implementation. (subsampling factor is 8)
Figure 7. 2D dataset and query regions. The table lists transmitted data sizes for ÇÈ . zoom (no) is for no subsampling and zoom (8) is for a subsampling factor of 8 (in each of the two spatial dimensions).
tation are executed on the same uniprocessor SUN workstation where the dataset has been pre-loaded. In both cases the client is run on another SUN Ultra 1 workstation connected to the local Ethernet segment. As is seen from the figure, the filter implementation does not introduce much overhead compared to the optimized original server. The percent increase in query execution time ranges from 6% to 30% across all queries. The filter version contains extra work not present in the original server, such as flattening of the chunk and metadata into a linear buffer on the sending filter, and expanding the chunk and metadata into the same structure in the receiving filter. This overhead is necessary when filters are located on distributed machines, but could be eliminated for the co-located case by instead sending a pointer to an inmemory structure, which would eliminate much of the overhead. This experiment is designed to be biased against the filter implementation to see what the overhead is in the decomposed version. We should also note that the timings do not include the time for loading the dataset from tape, which can substantially increase for larger datasets and datasets stored in archival storage systems across a wide-area network. Varying the Processing. One node of the IBM SP is used to access the stored dataset, and the client was run on a SUN workstation connected to the SP node through the department Ethernet. We experimented with different placements of the filters by running some of the filters on the same SP node where the data is accessed, as well as on the SUN workstation where the client is run. In Figure 9 we consider varying the placement of the filters under different processing requirements. Fig-
all experiments we use a 4GB 2D compressed JPEG image dataset (90GB uncompressed), created by stitching together smaller digitized microscopy images. This dataset is equivalent to a digitized slide with a single focal plane that has �ÉRCÊÌËÍÉRCÊ RGB pixels. The 2D image is regularly partitioned into ÎRRÏËÐÎCR data chunks and stored in HPSS in a set of files. We defined five possible queries, each of which covers ÑËÒ chunks of the image (see Figure 7). The execution times we will show are response times seen by the visualization client averaged over 5 repeated runs. For the presented experiments, we eliminated the effects of retrieving data stored on tape by insuring the data was staged to the HPSS disk cache before each run. We are using machines on our local area network for experimental repeatability, and will switch to hosts in a wide-area Grid environment once application behavior is sufficiently well-understood. Overhead of Using Filters. The query execution times for the original optimized Virtual Microscope server versus the prototype filter implementation are shown in Figure 8. In this experiment the entire dataset is loaded from HPSS and stored on a single local disk attached to a SUN Ultra 1 workstation, because the original server can only access datasets stored on disks. The loading of the dataset took 4750 seconds (1 hour 19 minutes). The original server is run as a single process, and all filters in the filter-stream implemen9
500
Response Time (sec)
Response Time (sec)
500 400 300 200 100 0
q1 q2 q3 q4 q5
q1 q2 q3 q4 q5
q1 q2 q3 q4 q5
q1 q2 q3 q4 q5
RDCZ--V
RDC--ZV
RD--CZV
R--DCZV
400 300 200 100 0
q1 q2 q3 q4 q5
q1 q2 q3 q4 q5
q1 q2 q3 q4 q5
q1 q2 q3 q4 q5
RDCZ--V
RDC--ZV
RD--CZV
R--DCZV
Filter Placement / Query
Filter Placement / Query
(a) no zooming (no subsampling)
(b) subsampling by a factor of 8
Figure 9. Execution time of queries under varying processing (subsampling). R,D,C,Z,V denote the filters read data, decompress, clip, zoom, and view, respectively. – denotes the placement of the filters in each set.
ures 9(a) and (b) show the query execution times when the image is viewed at the highest magnification (no subsampling) and when the subsampling factor is 8 (i.e. every 8th pixel in each dimension is output), respectively. There are three predominant factors in these experiments. The first is the placement of the most computationally intensive filter (decompress). The second is the volume of data transmitted between the two machines. The final factor is the amount of data sent by the view filter to the client driver. Consider the first two groups of bars in the figures. The difference between the groups within each figure is the placement of the zoom filter on the server (RDCZ-V) or client host (RDC-ZV). When there is no subsampling, query execution times remain almost the same for both placements, because the volume of data transfer between the server and client is the same in both cases. In the case of subsampling, the placement of the zoom filter makes a difference, because the volume of data sent from the server to the client decreases if the zoom filter is executed at the server. Now consider the last two groups of bars in the figures. The difference between the groups within each figure is the placement of the decompress filter (RD-CZV or R-DCZV). For no subsampling case, the time increases substantially when decompress is placed on the client, because of the combined effects of the most computationally intensive filter (decompress) and the high amount of data being processed by view and sent to the client driver. When there is subsampling, the query execution time is not as high, because the amount of data processed by view and sent to the client driver is much lower. These experiments demonstrate the complex interactions between placement of computation and communica-
tion volume. Varying the Server Load. In the next set of experiments (Figure 10), we consider varying the server load. We use the same experimental setup as for the previous experiment. In all experiments, we use a subsampling factor of É . Figures 10(a), (b), and (c) show query execution times when the server load is doubled, tripled, and quintupled, respectively. The different loads were emulated by artificially slowing down the set of filters running on the server host such that the total running time was delayed. For example, the zoom filter runs twice as long in the ÎÓË case because the time is delayed. As server load increases (or the client host becomes relatively faster), running the filters on the client host achieves better performance. This result is not unexpected, but the experiment quantifies the effect for this particular configuration. The use of a different client to server network, or hosts with different relative speeds would significantly change the observed trends and trade-off points.
6. Application: External Sort External sort has a long history of research in the database community and has resulted in many fast algorithms [3, 5]. The application starts with a large unsorted data file that is partitioned across multiple nodes, and the output is a new partitioned data file that contains the same data sorted on a key field. The sample data file is based on a standard sorting benchmark that specifies 100 byte tuples, with the first 10 bytes being the sort key. The distribution of the key values is assumed to be uniform, both in terms of the unsorted file as a whole and for each partition. A recent record holder 10
160
140
140
120 100 80 60 40 20 0
Response Time (sec)
160
140
Response Time (sec)
Response Time (sec)
160
120 100 80 60 40 20
q1 q2 q3 q4 q5
q1 q2 q3 q4 q5
q1 q2 q3 q4 q5
q1 q2 q3 q4 q5
RDCZ--V
RDC--ZV
RD--CZV
R--DCZV
Filter Placement / Query
(a) 2x server load
0
120 100 80 60 40 20
q1 q2 q3 q4 q5
q1 q2 q3 q4 q5
q1 q2 q3 q4 q5
q1 q2 q3 q4 q5
RDCZ--V
RDC--ZV
RD--CZV
R--DCZV
0
q1 q2 q3 q4 q5
q1 q2 q3 q4 q5
q1 q2 q3 q4 q5
q1 q2 q3 q4 q5
RDCZ--V
RDC--ZV
RD--CZV
R--DCZV
Filter Placement / Query
(b) 3x server load
Filter Placement / Query
(c) 5x server load
Figure 10. Execution time of queries under varying server load. ÎÓË means the server computation is delayed to double the execution time of a filter on the server, etc. (subsampling factor is 8)
for the fastest external sort is NowSort [5], and we use the pipelined version of their two-pass parallel sort for our basic algorithm. The algorithm proceeds in two phases. The first phase generates temporary sorted runs on each node, and the second phase produces the output sorted partition on each node. During the first phase, a reader reads chunks of tuples from the unsorted input file on disk, and partitions the records according to which node it will reside on when sorted, puts them into in-memory buffers, and when a buffer is full, sends it to the correct node. A writer collects tuples from all nodes, and when the in-memory buffer is full, sorts it using partial-radix sort2 , and writes the sorted run to disk. This first phase is over when all the unsorted input files have been processed, and written to disk as temporary sorted runs. For the second phase a merge-reader reads tuples from each local sorted run into merge input buffers. A merger selects the lowest-value key among all merge input buffers and copies it to an output buffer, from which the merge-writer appends buffers to the sorted output file on disk. This phase completes when tuples from all local runs have been merged.
Sorter continually reads buffers from the input streams, and extracts a portion of the key and appends it to a sort buffer. When the sort buffer becomes full, it is sorted and written to scratch space as a single temporary run. When all buffers have been read from the input streams, the merge phase begins with only the Sorter filters still executing. The Sorter filter then reads sorted tuples from each of the temporary run files and merges them into a single output buffer, and writes this buffer to the sorted output file on disk. This application is essentially a parallel SPMD program, with an all-to-all communication pattern. This organization is in contrast to the Virtual Microscope application that was structured as a processing chain pipeline.
6.2. Experimental Results The experimental setup is a 16 node cluster of dual 400MHz Pentium IIs with 256MB memory per node, running Linux kernel 2.2.12. There are two interconnects, a shared Ethernet segment, and a switched gigabit Ethernet channel. We use the faster switched interconnect for all experiments, and because of a problem with the network interface cards on some of the nodes, only use a maximum of 8 nodes in all experiments. The nodes are isolated from the rest of the network, and the cluster was not running other jobs during the experiments. Each node has a single Ultra2 SCSI disk. All data for a particular node, including temporary data, is stored on the single local disk. The dataset consists of a single 128MB unsorted file per node. The unsorted dataset was generated randomly with a uniform key distribution. The execution time for an experiment is the maximum time across all nodes used for the experiment. Each experiment is repeated for 5 trials, and the execution time shown represents the average of the trials. Both a Partitioner and
6.1. Filter Implementation The implementation of external sort using filters follows the above description. The location of the unsorted dataset dictates the number of nodes to be used for execution. There are two filters on each node, Partitioner and Sorter. The Partitioner filter reads buffers from the unsorted input file, and distributes the tuples into buckets based on the key value. When a bucket is full, it is sent over the stream that connects to the Sorter filter on the corresponding node. The 2 Making two passes over the keys with a radix size of 11-bits [3] plus a cleanup.
11
Filter Partitioner
140
Full Memory 256 KB
single disk buffer for reading tuples from the unsorted input file
120
Sort Time (sec)
Parameter read size
Partitioner
100
bucket size
1 MB
shared space for all outgoing tuple buckets, before sending to Sorter filters
keybuf size
80
Sorter (phase 1)
60
single buffer for storing extracted key and tuple pointer, before sorting and writing the temporary run
40
shared disk buffer for reading from all temporary runs during merge
20
Sorter (phase 2)
Sorter (phase 2)
sharedbuf outputbuf
1 MB 768 KB 512 KB
single disk buffer for writing sorted tuples to output file 0 0
1
2
3
4
5
6
7
8
9
Figure 12. Memory parameters used by the sort filters. The Full Memory column contains the initial value for each parameter.
Number of Nodes
Figure 11. Sort execution time as number of nodes is increased. The dataset size is scaled with the number of nodes (128MB/node). ing memory causes the filters to read/process/write data in smaller pieces, thus performance should suffer. As is shown by the solid line in the figure, the execution time increases as the size of the memory is decreased. In the experiments with heterogeneous memory configuration, we divide the eight nodes into two sets of four nodes. The first set of nodes retains the initial amount of memory (i.e., Full memory) for all runs, while the second set has their memory reduced for each case. The left bars for each case in each graph shows the maximum of the execution times on the nodes with full memory. Similarly, the right bar for each case in each graph shows the maximum of the execution times on the nodes with reduced memory. As is shown in Figure 13(a), we observe performance degradation similar to the base case. The nodes that use a constant amount of memory finish sooner, but the entire job runs no faster. In this experiment, both the input data to the Partitioner filter and the output of the Partitioner (i.e. the input data to the Sorter filter) on each node are regularly partitioned across all the nodes.
a Sorter filter are executed on each node used in the experiments for Figures 11 and Figures 13(a)–(d), and two Partitioner and Sorter filters are executed on some of the nodes in the experiments for Figures 13(e) and (f). The disk cache was cleared between executions to insure a cold disk cache for each run. Note that we are using a tightly coupled cluster for experimental repeatability, and will be switching to hosts on a wide-area Grid environment when application behavior is better understood. Scaling. The first experiment examines the scalability of the sort application as we increase the number of nodes and total dataset size. As seen in Figure 11, the application is well-behaved. There is good scaling due to the fast interconnect not becoming saturated by the traffic generated by sort. This experiment demonstrates there is nothing inherent in the filter-stream based implementation that would otherwise limit its scalability. Varying Memory Size. In this set of experiments we vary the amount of memory available for filters on some of the nodes while keeping it constant for filters on the remaining nodes. Our goal is to create a heterogeneous configuration in a controlled way, and observe the effects of heterogeneity on the application performance. Figure 13 shows the execution times under varying memory constraints. The solid line in all of the graphs denotes the base case, in which the size of the memory is reduced equally across all nodes, and shows the change in the execution time. The amount of the Full memory case is determined empirically to minimize execution time while consuming the least memory (see Figure 12). Memory parameters are varied by halving the full memory amount for the �ÔRÎ case, and halving again for the �Ô�Õ case, etc. Constrain-
Notice that the total amount of memory across all nodes for this experiment is larger than that for the base case because half the nodes keep full memory. For example, for the �ÔCÉ memory case, ÖRRC× more memory was being used in aggregate than for the �ÔRÉ base case. Instead of a reduction in sort time, the extra memory results in a load imbalance between the two sets of four nodes. Hence, in the next experiment we partitioned the amount of input data for each node irregularly, to attempt to reduce overall execution time. Figure 13(b) shows that the execution time increases when we partition the input data based on available node memory, i.e., full nodes have more input data than nodes with reduced memory. This results from an increase in the time for the partitioning phase, because the Partitioner filters on the set of nodes with full memory have more input records to process. The execution time for the merge phase is effec12
tively unchanged, because the amount of data sent to each node is unchanged. Figure 13(c) shows the result of partitioning the output of the Partitioner filter (and thus the merge phase work) according to the memory usage of the receiving node. This experiment, however, moves too much work to the nodes with full memory, so that those nodes become the longest running node set. To improve performance further, we followed two different approaches. In Figure 13(d), the Partitioner filter output is adjusted to balance the performance of both sets of nodes (approximately a R× reduction in the number of tuples assigned to a node for each ÔRÎ reduction in memory usage). In this case, we observe better performance than the previous cases. In the second approach, we partitioned both the input data and the output of the Partitioner filter as was done in the experiment for Figure 13(c), but executed two Sorter and two Partitioner filters on the nodes with Full memory to take advantage of the dual processors available in each node. As is seen in Figure 13(e), the performance is better than for the previous cases. Finally, Figure 13(f) shows the combined effect of running two sets of filters on the nodes with full memory, and adjusting the Partitioner output to balance the workload across both set of nodes. As expected, this configuration performs better than all other cases. These experimental results clearly show that application-level workload handling and careful placement of filters can deal with heterogeneity, which can have a significant impact on performance. Questions that require further investigation include (1) “can we develop cost models for filters and for the application performance so that the placement of filters and workload handling can be done by the runtime system, with little intervention from the user?” and (2) “can we make use of exposing resource requirements and communication characteristics to develop accurate and efficient cost models?”. We plan to work on more applications and different configurations to seek answers to these questions in future work.
Our experimental results show that there exists a delicate balance, and sometimes subtle interactions with heterogeneous resources, that can have a large impact on application performance. We plan to further investigate such interactions to develop cost models that can aid in decomposition of applications into filters and placement of the filters. We also are in the process of implementing other applications to use the filter-stream programming framework from application areas such as volume visualization, database decision support, and image processing.
References [1] A. Acharya, M. Uysal, and J. Saltz. Active disks: Programming model, algorithms and evaluation. In Proceedings of the Eighth International Conference on Architectural Support for Programming Languages and Operating Systems (ASPLOS VIII), pages 81–91. ACM Press, October 1998. ACM SIGPLAN Notices, Vol. 33, No. 11. [2] A. Afework, M. D. Beynon, F. Bustamante, A. Demarzo, R. Ferreira, R. Miller, M. Silberman, J. Saltz, A. Sussman, and H. Tsang. Digital dynamic telepathology - the Virtual Microscope. In Proceedings of the 1998 AMIA Annual Fall Symposium. American Medical Informatics Association, November 1998. [3] R. Agarwal. A super scalar sort algorithm for RISC processors. In Proceedings of 1996 ACM SIGMOD Conference, pages 240–6, 1996. [4] Alexandria Digital Library. http://alexandria.ucsb.edu/. [5] A. Arpaci-Dusseau, R. Arpaci-Dusseau, D. Culler, J. Hellerstein, and D. Patterson. High-performance sorting on networks of workstations. In Proceedings of 1997 ACM SIGMOD Conference, Tucson, AZ, 1997. [6] M. D. Beynon, R. Ferreira, T. Kurc, A. Sussman, and J. Saltz. DataCutter: Middleware for filtering very large scientific datasets on archival storage systems. In Proceedings of the 2000 Mass Storage Systems Conference, College Park, MD, March 2000. IEEE Computer Society Press. To appear. [7] A. Chervenak, I. Foster, C. Kesselman, C. Salisbury, and S. Tuecke. The Data Grid: Towards an architecture for the distributed management and analysis of large scientific datasets. (Submitted to NetStore ’99), September 1999. [8] A. Choudhary, R. Bordawekar, M. Harry, R. Krishnaiyer, R. Ponnusamy, T. Singh, and R. Thakur. PASSION: Parallel and scalable software for input-output. Technical Report SCCS-636, NPAC, September 1994. Also available as CRPC Report CRPC-TR94483. [9] Phoenix Computers Catalog. http://www.phoenixcomputers.net/, Jan 2000. Following link from http://www.pricewatch.com/. [10] ShopHere USA Catalog. http://205.164.161.100/products.asp?dept=33, Jan 2000. Following link from http://www.pricewatch.com/. [11] F. Douglis and J. Ousterhout. Process migration in the Sprite operating system. In Proceedings of the Seventh International Conference on Distributed Computing Systems, pages 18–25, September 1987.
7. Conclusion and Future Work We have presented a framework, called filter-stream programming, for developing data-intensive applications in a Grid environment. This framework represents the processing in an application as a set of processing components, called filters. The goal is to constraint application components to allow for location independence, and to expose communication characteristics and resource requirements, thus enabling a runtime system to support efficient execution of the application. We have described a prototype runtime infrastructure to execute applications using the filterstream programming framework. We have discussed implementations of two data-intensive applications that make use of our filter-stream framework, and presented experimental results. 13
300
merge phase partition/sort phase
partition/sort phase
120
180
120
60
60
0
0 Full Full
Full 1/2
Full 1/4
300
Full 1/4
Full 1/8
Full Full
Sort Time (sec)
120
60
300
merge phase
Full 1/8
(d) Irregular partitioning of input data and Partitioner filter output (tuned)
merge phase partition/sort phase
180
120
180
120
60
0 Full 1/4
Filter Memory Usage (4 node groups)
Full 1/8
240
60
0
Full 1/4
(c) Irregular partitioning of input data and Partitioner filter output
240
180
Full 1/2
Filter Memory Usage (4 node groups)
partition/sort phase
240
Sort Time (sec)
0 Full 1/2
(b) Irregular partitioning of input data
partition/sort phase
Full 1/2
120
Filter Memory Usage (4 node groups)
merge phase
Full Full
180
60
Full Full
Full 1/8
Filter Memory Usage (4 node groups)
(a) Regular partitioning of input data and Partitioner filter output
240
Sort Time (sec)
180
merge phase partition/sort phase
240
Sort Time (sec)
Sort Time (sec)
240
300
300
merge phase
Sort Time (sec)
300
0 Full Full
Full 1/2
Full 1/4
Full 1/8
Filter Memory Usage (4 node groups)
(e) Irregular partitioning of input data and Partitioner output, 2 pair of filters per Full node
Full Full
Full 1/2
Full 1/4
Full 1/8
Filter Memory Usage (4 node groups)
(f) Irregular partitioning of input data and Partitioner filter output (tuned), 2 pair of filters per Full node
Figure 13. Execution time of sorting a 1GB dataset using 8 nodes. Two groups of four nodes: (1) memory usage held constant (Full), (2) memory usage reduced (1/X).
[12] I. Foster. Automatic generation of self-scheduling programs. IEEE Transactions on Parallel and Distributed Systems, 2(1):68–78, January 1991. [13] I. Foster. Compositional parallel programming languages. ACM Trans. Prog. Lang. Syst., 18(4):454–476, July 1996. [14] I. Foster. The Beta Grid: A national infrastructure for computer systems research. In Network Storage Symposium, October 1999. [15] I. Foster and C. Kesselman. Globus: A metacomputing infrastructure toolkit. International Journal of Supercomputer Applications and High Performance Computing, 11(2):115– 128, 1997. [16] I. Foster and C. Kesselman. The GRID: Blueprint for a New Computing Infrastructure. Morgan Kaufmann, 1999. [17] I. Foster, C. Kesselman, and S. Tuecke. The Nexus approach to integrating multithreading and communication. Journal of Parallel and Distributed Computing, 37:70–82, 1996. [18] I. Foster, D. Kohr, R. Krishnaiyer, and A. Choudary. Double standards: Bringing task parallelisn to HPF via the message passing interface. In Proceedings Supercomputing’96. IEEE Computer Society Press, November 1996. [19] I. Foster, D. Kohr, R. Krishnaiyer, and J. Mogill. Remote I/O: Fast access to distant storage. In Fifth Workshop on I/O
[20] [21] [22] [23]
[24]
[25]
[26]
14
in Parallel and Distributed Systems (IOPADS), pages 14–25. ACM Press, 1997. Geographic Information Systems. http://www.usgs.gov/research/gis/title.html. Grid Forum. Birds-of-a-Feather Session, SC99, Nov 1999. The High Performance Storage System (HPSS). http://www.sdsc.edu/hpss/hpss1.html. T. Johnson. An architecture for using tertiary storage in a data warehouse. In the Sixth NASA Goddard Space Flight Center Conference on Mass Storage Systems and Technologies, Fifteenth IEEE Symposium on Mass Storage Systems, 1998. W. Johnston and B. Tierney. A distributed parallel storage architecture and its potential application within EOSDIS. In the Fourth NASA Goddard Conference on Mass Storage Systems and Technologies, 1995. Land Satellite Thematic Mapper (TM). landhttp://edcwww.cr.usgs.gov/nsdi/html/landsat tm/ sat tm. K.-L. Ma and Z. Zheng. 3D visualization of unsteady 2D airplane wake vortices. In Proceedings of Visualization’94, pages 124–31, Oct 1994.
Joel Saltz is a professor of Computer Science at the University of Maryland College Park and a professor of Pathology at the Johns Hopkins School of Medicine. His research interests are in the development of systems sofware, databases and compilers for the management, processing and exploration of very large datasets.
[27] Message Passing Interface Forum. Document for a standard message-passing interface. Technical Report CS-93214, University of Tennessee, November 1993. [28] Microsoft Corp. Microsoft TerraServer. http://www.terraserver.microsoft.com, 1998. [29] G. Patnaik, K. Kailasnath, and E. Oran. Effect of gravity on flame instabilities in premixed gases. AIAA Journal, 29(12):2141–8, Dec 1991. [30] V. Sarkar. Partitioning and scheduling parallel programs for multiprocessors. In Research Monographs in Parallel and Distributed Computing. Cambridge, MA, 1989. [31] SRB: The Storage Resource Broker. http://www.npaci.edu/DICE/SRB/index.html. [32] N. Talagala, S. Asami, and D. Patterson. The Berkeley-San Francisco fine arts image database. In the Sixth NASA Goddard Space Flight Center Conference on Mass Storage Systems and Technologies, Fifteenth IEEE Symposium on Mass Storage Systems, 1998. [33] T. Tanaka. Configurations of the solar wind flow and magnetic field around the planets with no magnetic field: calculation by a new MHD. Jounal of Geophysical Research, 98(A10):17251–62, Oct 1993. [34] M. Teller and P. Rutherford. Petabyte file systems based on tertiary storage. In the Sixth NASA Goddard Space Flight Center Conference on Mass Storage Systems and Technologies, Fifteenth IEEE Symposium on Mass Storage Systems, 1998. [35] M. Uysal. Programming Model, Algorithms, and Performance Evaluation of Active Disks. PhD thesis, Department of Computer Science, University of Maryland, College Park, 1999. [36] M.-Y. Wu and D. D. Gajski. Hypertool: A programming aid for multicomputers. In Proceedings of the 1989 International Conference on Parallel Processing, pages II–15 – II–18. Pennsylvania State University Press, August 1989. [37] T. Yang and A. Gerasoulis. PYRROS: static task scheduling and code generation. In Proceedings of the 1992 International Conference on Supercomputing, July 1992.
Michael D. Beynon is a Ph.D. candidate in the Department of Computer Science at the University of Maryland, College Park. His research interests include resource intensive application performance and high performance parallel and distributed systems. Tahsin Kurc is a postdoctoral research associate in the Department of Computer Science at the University of Maryland College Park. His research interests include algorithms and systems software for high-performance and dataintensive computing. Alan Sussman is a Research Scientist in the Computer Science Department at the University of Maryland College Park and a visiting scientist in Pathology at the Johns Hopkins School of Medicine. His research interests include high performance runtime and compilation systems for data- and compute-intensive applications. 15