2(d)
Detection and Location of Defects in Wiring Networks using Time Domain Reflectometry and Neural Networks M. K. Smail, T. Hacib, L. Pichon, and F. Loete Laboratoire de Génie Electrique de Paris, UMR 8507 CNRS, SUPELEC, Université Paris-Sud, Université Pierre et Marie Curie, 11 rue Joliot-Curie, 91192 Gif-sur Yvette cedex, France
[email protected]
I. INTRODUCTION
In thirty years, the length of cables on board of car has increased more than tenfold, from about 200 to 4000 meters. As wires in all transportation mean are aging, they are exposed to different types of problems. In this area, reliability becomes a safety issue. Wiring networks can be affected with two types of faults: “soft ones” are created by the change of the impedance along the line due to different kinds of defects (insulation, radial crack, degradation of connector…) in the wire. “Hard faults” correspond to open and short circuits. For the first type of faults, the time-domain response of the faulty wiring presents a simple modification of the impedance of the fault, in the defect location. In the case of hard faults the structure of the network as well as the response changes. The most widely used technique for testing wires is reflectometry [1]. It is based on the same principle that radar. A high frequency electrical signal is sent down the wire, where it reflects from any impedance discontinuity. The difference (time delay or phase shift) between the incident and reflected signal is used to locate the fault on the wire. In this paper a new methodology is developed in order to detect, localize and characterize defects in wiring networks from the time domain reflectometry response.
III.
RESULTS
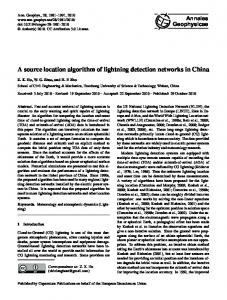
The methodology is illustrated in the case of the faulty wiring network shown in figure 1. The network is constituted with a coaxial cable and the terminations of the branches are open circuits. It is assumed to be affected by a single defect (open circuit). The impulse response is deduced from measurement of S11 parameter with a Vector Network Analyzer (VNA) in frequency domain from 200 MHz to 2 GHz, fig. 2. The datasets required to train the NN were created thanks to the FDTD method. The datasets are constituted of examples linking the reflectometry response to the position of the fault. In this case the parameters are the lengths of the branches Li. The training domain is as follows: the space of estimated parameters (Li) is regularly discretized. The input of the NN is the reflectometry response of the faulty network shown in figure 2. The results obtained from the reconstruction of the network structure gives the information about the fault position. In the conference, various and complex configurations will be presented. Open Circuit
L2=1.5m L1=1.5m
50Ω
Hard fault Open Circuit
L3=1.5m
Fig. 1. Network structure with open ended (broken wire) 0.5 Reflectometry Response of Healthy Network Reflectometry Response of Faulty Network
0.4
0.3
Magnitude
Abstract— This paper presents a new technique to reconstruct faulty wiring networks from the time domain reflectometry response. The method is also for characterization of defects in branches on the network. The direct model for wave propagation along the transmission lines is modelled by RLCG circuit parameters and the Finite Difference Time Domain (FDTD) method. Neural Networks (NNs) are used to solve the inverse problem.
0.2
0.1
0
II. METHODOLOGY
In our approach a direct model for wave propagation along the transmission lines including electrical faults is built via the telegrapher’s equations solved by a one dimensional FDTD method The per unit length circuit parameters of the transmission line are obtained with a finite element technique. The inversion is carried out by means of Multi-Layer Perceptron NN (MLP). This NN consists of two layers, a hidden layer with hyperbolic tangent activation functions and an output layer constituted of a single neuron having linear activation function [2]. The parameters to be optimized with NN include the position of the fault. In the case of soft faults the parameters also include the electrical parameters (inductance and capacitance).
-0.1
-0.2
0
2
4
6
8
10
Distance (m)
Fig. 2. Comparison between the reflectometry responses of the healthy network and that affected by open ended circuit fault (measures) IV. [1] [2]
REFERENCES
C. Furse, Y. C. Chung, C. Lo, and P. Pendayala, “A Critical Comparison of Reflectometry Methods for Location of Wiring Faults,” Journal of Smart Structures and System, vol.2, no.1, pp. 25-46, 2006. H. Acikgoz, B. Jannier, Y. Le Bihan, O. Dubrunfaut, O. Meyer, and L. Pichon, “ Direct and Inverse Modeling of a Microwave Sensor Determining the Proportion of Fluids in a Pipeline,” IEEE Transactions on Magnetics, vol. 49, no. 3, pp. 1510-1513, March 2009.