Detection of Periods of Food Intake using Support Vector Machines Paulo Lopez-Meyer1, Stephanie Schuckers1, Member, IEEE, Oleksandr Makeyev1, Student Member, IEEE and Edward Sazonov1, Member, IEEE
Abstract— Studies of obesity and eating disorders need objective tools of Monitoring of Ingestive Behavior (MIB) that can detect and characterize food intake. In this paper we describe detection of food intake by a Support Vector Machine classifier trained on time history of chews and swallows. The training was performed on data collected from 18 subjects in 72 experiments involving eating and other activities (for example, talking). The highest accuracy of detecting food intake (94%) was achieved in configuration where both chews and swallows were used as predictors. Using only swallowing as a predictor resulted in 80% accuracy. Experimental results suggest that these two predictors may be used for differentiation between periods of resting and food intake with a resolution of 30 seconds. Proposed methods may be utilized for development of an accurate, inexpensive, and non-intrusive methodology to objectively monitor food intake in free living conditions.
I. INTRODUCTION The obesity epidemic has been suggested as a primary cause for a potential decline in US life expectancy [1]. Recent research indicates that control of food intake may be the primary factor for maintaining a healthy weight [2]. At the present time, there is no accurate, inexpensive, non-intrusive way for objectively Monitoring of Ingestive Behavior (MIB) in free living conditions. Several methods have been proposed to measure food intake including observation, weighed food records, estimated records, diet history, food-frequency questionnaires, food recall methods, and others. In a review of 43 studies comparing these methods with the gold standard of doublylabeled water, the majority suffered from underestimation of energy intake, on the order of 0.83 (EI:EE ratio) [3]. People tend to miscalculate and underreport their daily intake due to two main factors: change in eating behavior that occurs when subjects are asked to record their intake, and the unintentional and intentional misreport the eating behavior [48]. Even when the usage of these self-report methods may Manuscript received March 31, 2010. P. L. Meyer is with the Department of Electrical and Computer Engineering, Clarkson University, Potsdam, NY 13699, USA (e-mail:
[email protected]). S. Schuckers is with the Department of Electrical and Computer Engineering, Clarkson University, Potsdam, NY 13699, USA (e-mail:
[email protected]). O. Makeyev is with the Department of Electrical and Computer Engineering, Clarkson University, Potsdam, NY 13699, USA (e-mail:
[email protected]). E. S. Sazonov is with the Department of Electrical and Computer Engineering, Clarkson University, Potsdam, NY 13699, USA (phone: 315268-3914; e-mail:
[email protected]).
provide fairly good estimates of portions of energy intake, they lack information on the specific patterns of food intake throughout the day. Some studies [9] reported that the total daily energy intake was significantly lower than measured intake due to snacking where subjects tend to misreport or admitted not reporting snacks at all. It is necessary to improve the detection of this type of intake activities to reduce bias due to underreporting. Thus, dietary assessment should employ objective MIB methods, since periods of food intake can provide useful information and bring a more explicit insight in the study of eating behaviors associated with overweight and obesity. The methods of MIB are relatively poorly developed. In a study that involved patients with chronic kidney disease [10], a semi-automated MIB methodology was studied where subjects introduced data from food products using voice recordings and a PDA that scanned the bar code of products to be eaten. This methodology still relies heavily on self-report cooperation from the subjects. Our earlier work [11], reported on a MIB method that achieved >95% accuracy in detection of food intake using information from chews and swallows counted within a fixed time window of 30 seconds. In a recent publication [12] we presented an acoustical methodology for automatic detection of swallowing events which can serve as a foundation for the methodology suggested in this paper. Our long term goal is to create a non-invasive wearable device that would monitor ingestive behavior identifying foodrelated swallowing as a means of quantifying the number and length of eating periods per day. Such a device would be suitable for free living individuals that are not required to cooperate in the reporting of food consumption beyond the wearing of the device and may be used for both advising individuals about moderating their food intake and in obesityrelated research. In this study we propose the use of Support Vector Machines (SVM) models to detect periods of food intake using information extracted from the Instantaneous Swallowing Frequency (ISF) signal and the binary indicators of chewing. Features derived from swallow and chew scores obtained on the data collected from 18 subjects are evaluated. Experimental results suggested that the combination of swallows and chews used as features allow differentiating periods of food intake from no intake.
II. METHODOLOGY A. Data collection Data from 18 human subjects were used (11 males, 7 females) [13]. The average BMI across the sample population was 28.01 ± 6.35km/m2, age of the subjects varied from 18 to 57 years. Institutional Review Board approval was obtained for this study. Subjects read and signed the informed consent form document. Each subject performed 4 experiments. These experiments consisted of a 20 min inactivity period, a meal period and a final 20 min inactivity period. For both inactivity periods the subject was asked to stay silent for the first 10 minutes and then to read aloud for the last 10 minutes; the meal period consisted on an unlimited time to eat a meal of fixed size that included the following food items: a slice of cheese pizza, a can of 1% fat yogurt, an apple, and a peanut butter sandwich. The provided drink was clear water. The following is a brief description of the sensors and data collection procedure while a detailed version of the same can be found in [13]. A miniature throat microphone located over the laryngopharynx was used to detect swallow sounds which were captured through a line-in input of a standard sound card. Monitoring of chews was done by mechanical means using a piezoelectric film strain sensor to monitor skin strain due to chewing. This signal was acquired by a 16-bit data acquisition module USB-1608FS at a sampling rate of 100 Hz. During each session of the data collection, subjects were videotaped in profile by a camcorder to capture subject activity. A human rater marked manually the beginning and the end of swallows and of the chewing periods based on the video, audio recordings and strain sensor signals using specially designed LabVIEW software. Reliability of the manual scores was established by Intra-class Correlation Coefficients [13]. The resulting scores included the following: 1. The swallowing score contained the time of occurrence and duration of each swallow during the experiment. 2. The chewing score contained the time of occurrence, duration and number of chews in each chewing sequence. The swallowing and chewing scores provided the initial data for the food detection methodology described here.
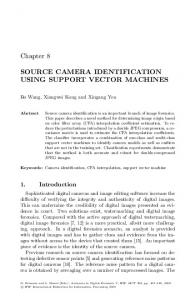
Fig. 1. Example of the ISF signal for a complete visit
also plotted on the timeline for resting swallows (cross marks) and food related swallows (dot marks). Higher amplitude of the ISF signal indicates a shorter time difference between two consecutive swallows. For our study we interpolated the original swallowing frequency signals that consisted on unevenly distributed points in time to obtain a set of points uniformly distributed in the same time range in such a way that each point of a new set would correspond to time period of 0.25 second or a sampling frequency of 4 Hz. This sampling frequency is significantly higher than the highest swallow frequency observed in our experiments (45.8 sw/min = 0.76 sw/sec) and guaranties that there will be no information loss due to sampling. The ISF signal is divided in M decision for j = 1,2,…M of 30 epochs Ε j = [ S j1 , S j 2 ,..., S j120 ] , second duration; each one of these epochs has a total number of 120 sample points ( S k , k = 1,2,...120 ). The next preprocessing step consisted of applying Fast Fourier Transform (FFT) to each decision epoch, resulting in 120 coefficients Fk , k = 1,2,...120 in the frequency domain. The phase of the spectrum was not of interest, therefore only the absolute value of the spectrum (60 coefficients) was used to build magnitude spectrum frames Γ j .
FFT {Ε j } → Γ j = [ F j1 , F j 2 ,..., F j 60 ]
for j = 1,2,…M.
To make spectrum frames from different experiments and different subjects comparable to one another, each frame was 60
B. Data preprocessing For each swallow, the difference in time was calculated between a swallow located at moment ti with respect to the previous one located at moment ti −1 , where i = 2,....k is the number of the current swallow in a subject’s visit. Instantaneous Swallowing Frequency (ISF) for i-th swallow is defined as: f i = (60 t i − t i −1 ) , where fi is ISF, expressed in swallows per minute. That is, swallowing frequency is the inverted difference in time between two consecutive swallows represented as an instantaneous value. An example of the ISF signal generated for a complete visit of one subject is presented in Fig. 1. Swallow locations are
normalized to unit power:
Γ′j = Γ j
∑F
jk
. Examples of 30
k =1
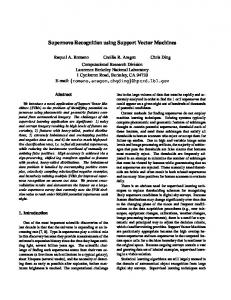
second epochs are presented in Figure 2 and 3, where the ISF signal segment and its associated frame spectrum for a typical resting period epoch (Figure 2) and a food intake epoch (Figure 3). These plots show that food intake epochs present higher frequency components in the normalized magnitude spectrum frames. Amplitude of each Ej is obtained as the root mean square of the sample points for that epoch: A j
=
1 120 2 ∑ S ji . 120 i =1
optimized through a grid search procedure varying C as C = ex for x = {0,...,5} and γ as γ = ey for y = {− 4,−3.9...,−3}. Different group models were implemented. The first one was implemented with only information extracted from the swallow sequences, that is, using amplitude and magnitude spectrum
{
frames as features x j = A j , Γ' j Fig. 2. Example of an epoch from a resting period. First 25 harmonics of the spectrum are shown
Fig. 3. Example of an epoch from a food intake period. First 25 harmonics of the spectrum are shown
Once the amplitude and the normalized magnitude spectrum frames are defined for each epoch, they are used as characteristic features with additional binary indicator of chewing inside the epoch, defined as ς j = −1 if no chew is present inside the epoch and ς j = +1 if chewing is present. Class labels are defined as
r j = −1
if E j ∈ C1 , and
r j = +1 if E j ∈ C 2 , where C1 represents the resting label and C2 the food intake label. The data set is then described as pairs of
{
}kN=1 ,
where
and
{
}Mj=1 for j=1,…,M total number of epochs and
x j = A j , Γ' j , ς j
labels:
Vk = x j , r j
features
k=1,2,…,N total number of visits. C. Classification model using SVM A model with a population-based approach is proposed here, where a significant sample of the population is used to define a representative group model. This model is obtained using training data that consists of labeled examples defined by common descriptive features. The resulting group model is then used to predict the labels of future data based on their known features. There are many supervised learning techniques that can be used for classification tasks, one of them being Support Vector Machines (SVM), which has proved to have excellent performance in classification problems [14]. SVM relies on the processing of the data to represent patterns in a higher dimension, with an appropriate mapping function into a new space, to be solved by a linear function, which would be the same as a non-linear function in the original space. Because of this particularity, SVM is capable of producing very complex decision functions. To implement a classifier using SVM technique, LibSVM software package was used [15]. Radial Basis Function kernels were used for the model and parameters, penalty value C and kernel’s gamma value γ, were
}Mj=1 . The second model uses
information from swallows and chews together as features
{
like x j = A j , Γ' j , ς j
}Mj=1 . Also, models were compared when
data was scaled and not scaled. Data scaling was used to represent different features in a comparable range between them, in our case ‘0’ for the minimum value and ‘1’ for the maximum. In order to quantify the ability of the evaluated features to differentiate between periods of resting and food intake we used accuracy measurement, defined as the ratio between the number of correctly classified epochs and the total number of T+ + T− , where (T+) is epochs in each visit Acc = T+ + F− + T− + F+ the number of correctly classified food intake epochs, and (T-) is the number of correctly classified resting epochs; (F+) and (F-) are the number of incorrectly classified food intake and resting epochs respectively. Hold-out cross-validation was used to train and validate the group model. From the 18 subjects, 9 are selected randomly and their visits were used to train the group model; remaining 9 subjects were used as the validation data set. To reduce bias in results, 10 randomized rounds were performed and the accuracy of the classifier was obtained as the average accuracy across the validation results. III. RESULTS Data from 18 subjects were used for analysis; 72 visits were divided in epochs and for each one, amplitude of the ISF segment, normalized magnitude frequency spectrum, and presence or absence of chewing were computed. These attributes were used as features to develop an SVM classification model. The first model was implemented using information only from swallowing, that is, average amplitude and frequency spectrum of the ISF segment, and achieved an accuracy of 77.6%. When scaling the features to have a comparable range among them, the accuracy increased in about 3% (Table 1). The addition of the chewing sensor resulted in a significant improvement of the model. When data were not scaled, the model achieved an accuracy of 94%. When comparing this model with the one implemented with scaled data, no significant difference in results was observed (p>0.05), obtaining an accuracy of 93.8%. Table 1 summarizes the results obtained for the different models implemented. IV. DISCUSSION It can be seen from Figure 2 and 3 that the differences observed in the ISF signal obtained from swallowing
TABLE I ACCURACY OF DIFFERENT SVM MODELS IMPLEMENTED FOR DETECTION OF FOOD INTAKE
Predictor
Non scaled Features (%)
Scaled Features (%)
Swallows
77.6 (CI: 64.4-90.7)
80.9 (CI: 79.5-82.5)
Swallows and Chews
94.0 (CI: 93.5-94.5)
93.8 (CI: 93.2-94.3)
sequences can be used as features for classification between periods of resting and food intake. However, the group models may suffer from high inter subject variability. When using only the swallowing sequences, accuracy was improved in about 3% with scaled data. The addition of chewing into the models significantly improves their accuracy reducing the effect of the inter subject variability. This is a more efficient model since detection of solid food intake mostly relies on chewing while liquid intake is supported by a higher swallowing frequency. In a previous study, we developed several classification models for detection of periods of food intake using less complex techniques. Results obtained here are comparable with those reported in [13] where an adaptive floating average model efficiently achieves >95% classification accuracy, however, this model is strongly dependent on the time duration of the experiment, since the threshold is obtained based on the average of the complete ISF signal. The model proposed here overcomes this issue by training an SVM group model using labeled epochs regardless of the length of time of the experiment. The ISF and the chewing signals used in this study were obtained with the manual scores of sound recordings and strain sensor signal recognition, but our methodology may potentially be applied to the scores obtained with automatic swallowing and chewing detection methods that would enable creation of a wearable device. Future work includes evaluation of the proposed features for real free-living conditions, integrating these models to automatic swallow and chew detection techniques currently being studied and developed as part of our ongoing research.
be advantageous for development of an accurate, inexpensive, and non-intrusive methodology to objectively monitor food intake in free living conditions. REFERENCES [1]
[2] [3]
[4]
[5]
[6]
[7]
[8]
[9]
[10]
[11]
[12]
V. CONCLUSION Three potential features derived from the ISF signal and presence of chewing were proposed and evaluated on the data collected from 18 subjects for differentiation between periods of resting and food intake including amplitude, frequency spectrum, and presence or absence of chewing. Experimental results suggested that all of the evaluated features combined can be used to differentiate periods of resting and food intake. The lowest accuracy obtained was >77% when only information of swallowing sequences were used. A significant improvement was obtained with the addition of the chewing signal into the mode increasing the accuracy up to 94%. Utilization of the proposed features for determination of periods of food intake from the ISF and chewing signals may
[13]
[14] [15]
S.J. Olshansky, D.J. Passaro, R.C. Hershow, J. Layden, B.A. Carnes, J. Brody, L. Hayflick, R.N. Butler, D.B. Allison, and D.S. Ludwig, “A Potential Decline in Life Expectancy in the United States in the 21st Century,” N Engl J Med, vol. 352, Mar. 2005, pp. 1138-1145. J.P. Flatt, “Substrate utilization and obesity,” Diabetes Rev., vol. 4, 1996, pp. 433-449. M.B.E. Livingstone and A.E. Black, “Markers of the validity of reported energy intake,” The Journal of Nutrition, vol. 133 Suppl 3, Mar. 2003, pp. 895S-920S. A.M. Prentice, A.E. Black, P.R. Murgatroyd, G.R. Goldberg, and W.A. Coward, “Metabolism or appetite: questions of energy balance with particular reference to obesity,” Journal of Human Nutrition and Dietetics, vol. 2, 1989, pp. 95-104. J.L. Weber, P.M. Reid, K.A. Greaves, J.P. DeLany, V.A. Stanford, S.B. Going, W.H. Howell, and L.B. Houtkooper, “Validity of selfreported energy intake in lean and obese young women, using two nutrient databases, compared with total energy expenditure assessed by doubly labeled water,” European Journal of Clinical Nutrition, vol. 55, Nov. 2001, pp. 940-50. C.M. Champagne, G.A. Bray, A.A. Kurtz, J.B.R. Monteiro, E. Tucker, J. Volaufova, and J.P. Delany, “Energy intake and energy expenditure: a controlled study comparing dietitians and nondietitians,” Journal of the American Dietetic Association, vol. 102, Oct. 2002, pp. 1428-32. N. Day, N. McKeown, M. Wong, A. Welch, and S. Bingham, “Epidemiological assessment of diet: a comparison of a 7-day diary with a food frequency questionnaire using urinary markers of nitrogen, potassium and sodium,” International Journal of Epidemiology, vol. 30, Apr. 2001, pp. 309-17. J.M. De Castro, “Methodology, correlational analysis, and interpretation of diet diary records of the food and fluid intake of freeliving humans,” Appetite, vol. 23, Oct. 1994, pp. 179-92. M.B. Livingstone, A.M. Prentice, J.J. Strain, W.A. Coward, A.E. Black, M.E. Barker, P.G. McKenna, and R.G. Whitehead, “Accuracy of weighed dietary records in studies of diet and health.,” BMJ : British Medical Journal, vol. 300, Mar. 1990, pp. 708-712. K.A. Siek, K.H. Connelly, Y. Rogers, P. Rohwer, D. Lambert, and J.L. Welch, “When Do We Eat? An Evaluation of Food Items Input into an Electronic Food Monitoring Application,” 2006 Pervasive Health Conference and Workshops, Innsbruck, Austria: 2006, pp. 110. E.S. Sazonov, S.A. Schuckers, P. Lopez-Meyer, O. Makeyev, E.L. Melanson, M.R. Neuman, and J.O. Hill, “Toward Objective Monitoring of Ingestive Behavior in Free-living Population,” Obesity, vol. 17, May. 2009, pp. 1971-1975. E. Sazonov, O. Makeyev, P. Lopez-Meyer, S. Schuckers, E. Melanson, and M. Neuman, “Automatic detection of swallowing events by acoustical means for applications of monitoring of ingestive behavior,” Biomedical Engineering, IEEE Transactions on, vol. 57, Mar. 2010, pp. 626-633. E. Sazonov, S. Schuckers, P. Lopez-Meyer, O. Makeyev, N. Sazonova, E.L. Melanson, and M. Neuman, “Non-invasive monitoring of chewing and swallowing for objective quantification of ingestive behavior,” Physiological Measurement, vol. 29, 2008, pp. 525-541. D. Meyer, F. Leisch, and K. Hornik, “The support vector machine under test,” Neurocomputing, vol. 55, 2003, pp. 169-186. C. Chang and C. Lin, “LIBSVM : a library for support vector machines,” Software available at: http://www.csie.ntu.edu.tw/~cjlin/libsvm, 2001.