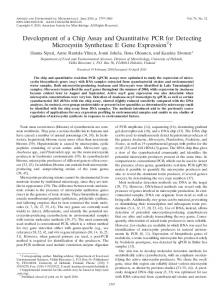
Development and validation of a direct real-time PCR assay for Mycobacterium bovis and implementation into the United States national surveillance program Philip E Dykema, Kevin D Stokes, Nadine R Beckwith, James W Mungin, Lizhe Xu, Deborah J Vickers, Monica M Reising, Doris M Bravo, Bruce V Thomsen, Suelee Robbe-Austerman
Abattoir surveillance for bovine tuberculosis, which consists of identifying and submitting granulomas for histopathology and mycobacterial culture was the primary means for detecting new cases in the United States. Mycobacterial culture is expensive, labor intensive and identifies cases weeks after slaughter, hampering trace back efforts. To address this inefficiency, the United States Department of Agriculture replaced culture with real-time PCR for screening granulomas. The objectives of this paper were to describe the development and validation of this PCR as well as the performance of the assay during the first year of implementation. Using archived culture and histologically positive tissue, the sensitivity was 0.96 (95% CI: 0.89, 0.99) for the Mycobacterium tuberculosis complex primer-probe set and 0.89 (95% CI: 0.80, 0.95) for the Mycobacterium bovis specific primer-probe set. Specificity, estimated during by side by side testing was 0.998 (95% CI: 0.994, 1.000). After implementation, 6124 samples over 54 weeks were tested and all 36 histopathology positive samples were detected including 2 additional cases initially misclassified by histopathology. It appeared that specificity may have declined during post validation testing with 47/6086 signaling positive but not confirmed by either histopathology or culture. While PCR implementation has significantly improved the efficiency of the US slaughter surveillance program, careful attention must be paid to prevent and address cross contamination in the laboratory.
PeerJ PrePrints | https://doi.org/10.7287/peerj.preprints.1703v1 | CC-BY 4.0 Open Access | rec: 3 Feb 2016, publ: 3 Feb 2016
1
Development and validation of a direct real-time PCR assay for Mycobacterium bovis and
2
implementation into the United States national surveillance program
3
Philip Dykema1, Kevin Stokes1, Nadine Beckwith1, James Mungin1, Lizhe Xu1, Deborah
4
Vickers1, Monica M. Reising2, Doris Bravo1, Bruce Thomsen1, Suelee Robbe-Austerman1*
5
1National
6
USA
7
2Center
8
*Corresponding Author:
9 10
Veterinary Services Laboratories, United States Department of Agriculture, Ames, IA
for Veterinary Biologics, United States Department of Agriculture, Ames, IA USA Suelee Robbe-Austerman 1920 Dayton, Ames, IA 50010
[email protected]
11 12
PeerJ PrePrints | https://doi.org/10.7287/peerj.preprints.1703v1 | CC-BY 4.0 Open Access | rec: 3 Feb 2016, publ: 3 Feb 2016
13
Abstract
14
Abattoir surveillance for bovine tuberculosis, which consists of identifying and submitting
15
granulomas for histopathology and mycobacterial culture was the primary means for detecting
16
new cases in the United States. Mycobacterial culture is expensive, labor intensive and identifies
17
cases weeks after slaughter, hampering trace back efforts. To address this inefficiency, the
18
United States Department of Agriculture replaced culture with real-time PCR for screening
19
granulomas. The objectives of this paper were to describe the development and validation of this
20
PCR as well as the performance of the assay during the first year of implementation. Using
21
archived culture and histologically positive tissue, the sensitivity was 0.96 (95% CI: 0.89, 0.99)
22
for the Mycobacterium tuberculosis complex primer-probe set and 0.89 (95% CI: 0.80, 0.95) for
23
the Mycobacterium bovis specific primer-probe set. Specificity, estimated during by side by side
24
testing was 0.998 (95% CI: 0.994, 1.000). After implementation, 6124 samples over 54 weeks
25
were tested and all 36 histopathology positive samples were detected including 2 additional cases
26
initially misclassified by histopathology. It appeared that specificity may have declined during
27
post validation testing with 47/6086 signaling positive but not confirmed by either
28
histopathology or culture. While PCR implementation has significantly improved the efficiency
29
of the US slaughter surveillance program, careful attention must be paid to prevent and address
30
cross contamination in the laboratory.
31 32 33 34
PeerJ PrePrints | https://doi.org/10.7287/peerj.preprints.1703v1 | CC-BY 4.0 Open Access | rec: 3 Feb 2016, publ: 3 Feb 2016
35
Introduction
36
Bovine tuberculosis (bTB), caused by Mycobacterium bovis, is an important zoonotic disease
37
that impacts international trade. Many countries spend significant resources eradicating,
38
controlling or conducting surveillance for bTB in livestock and wildlife species. In the United
39
States, the primary method to detect new bTB cases is abattoir surveillance where suspicious
40
granulomas identified during inspection are submitted to the United States Department of
41
Agriculture’s (USDA) National Veterinary Services Laboratories (NVSL) in Ames, IA for
42
examination.(Naugle et al. 2014) Historically, submitted granulomas were tested with
43
histopathology and a subset of approximately 40% were also parallel tested using mycobacterial
44
culture (Fig. 1). Mycobacterial culture was used to obtain isolates for genotyping and improve
45
sensitivity by identifying cases not found on histopathology. Unfortunately, bTB cases identified
46
by culture but not detected by histopathology would be found weeks after the carcass was
47
sampled making tracing the animal back to the herd of origin significantly more expensive and
48
challenging.
49
Direct PCR on fresh or borate preserved tissue has the potential to offer a parallel test to
50
histopathology, and greatly reduce the labor, expense, and turnaround time required for
51
mycobacterial culture. Published literature contains numerous PCR methods for the
52
Mycobacterium tuberculosis complex (MTBC), including M. bovis, starting in 1990 with the
53
exploitation of IS6110 and then IS1081 in 1991. (Collins & Stephens 1991; Eisenach et al. 1990)
54
After 15 years of use in laboratories, two published meta-analyses reviewed in-house PCR
55
methods analyzing sputum samples for human TB diagnosis, and these meta-analyses highlight
56
variability in methods and in sensitivity and specificity for a relatively homogeneous
57
specimen.(Flores et al. 2005; Greco et al. 2009) Variation from laboratory to laboratory
PeerJ PrePrints | https://doi.org/10.7287/peerj.preprints.1703v1 | CC-BY 4.0 Open Access | rec: 3 Feb 2016, publ: 3 Feb 2016
58
significantly impacts the usefulness and reliability of an assay, especially for a disease that
59
requires regulatory guidelines. The development of real-time PCR technology, which provides a
60
quantification of the nucleic acid target, was an important advancement in PCR.(Wittwer et al.
61
1997) Several researchers published primer-probe combinations for the IS6110 and IS1081
62
insertion elements.(Broccolo et al. 2003; Pan et al. 2013; Taylor et al. 2007; Thacker et al. 2011)
63
In 2009, the “Minimum Information for Publication of Quantitative Real-Time PCR
64
Experiments” (MIQE) guidelines outlining documentation of real time PCR protocols were
65
published.(Bustin et al. 2009).
66
Veterinary researchers and diagnosticians have recognized the advantages of using PCR to detect
67
M. bovis in tissues, but the variation in tissue matrices adds complexity not generally seen with a
68
sputum sample. Extraction methods must be able to deal with the diverse tissues matrices at a
69
reasonable cost and be scalable to the daily influx of specimens. Previous studies investigated
70
several methods including sequence capture, immunomagnetic methods, bead disruption,
71
proteinase K digestion and others with moderate to successful results, some amenable to higher
72
throughput testing.(Garbaccio & Cataldi 2010; Stewart et al. 2013; Taylor et al. 2007; Taylor et
73
al. 2001). Commercialized PCR reagents have been developed and marketed such as: LSI
74
VetMAX targeting all MTBC organisms (Thermo Fisher Scientific Waltham, MA, USA), and
75
BoviMAN (Sliverline Bio, Valdivia, Chile), which targets M. bovis and was adopted as an
76
official test by Servicio Agricola y Ganadero (SAG) the Animal Health Agency of Chile.
77
However, a complete system, including extraction and control reagents, is not currently
78
available. Furthermore, to the authors’ knowledge, no country has yet published complete
79
methods, workflow and performance of an in-house direct real-time PCR while being used in a
80
national slaughter surveillance program.
PeerJ PrePrints | https://doi.org/10.7287/peerj.preprints.1703v1 | CC-BY 4.0 Open Access | rec: 3 Feb 2016, publ: 3 Feb 2016
81
The objectives of this paper were to describe the development and validation of an optimized
82
extraction method, various probe-primer combinations and the manufacturing of controls used to
83
monitor the performance of the assay. Finally, we report on the overall performance of the assay
84
in the first year of national program use.
85
Materials and Methods
86
Development of primer-probe sets
87
To develop primer-probe sets, IS1081 and IS6110 transposase sequences representing
88
Mycobacterium africanum, M. bovis, Mycobacterium canetti, and Mycobacterium tuberculosis
89
species were obtained from NCBI database and aligned using Geneious v. 6.0.3 (Biomatters,
90
Auckland, New Zealand) to identify conserved regions. To identify the most optimal primer-
91
probe combinations, regions were selected throughout the transposases (Fig S1). The design
92
feature available in Geneious was used to construct primers and probe, adjusting the Tm range to
93
64-68°C (66°C optimum) for the primers and 70-74°C (72°C optimum) for the probe. The best 3
94
combinations were selected for each insertion element, based on no dimer formation, no self-
95
complementarity, and to hold amplicon size below 150bp. This study also included a previously
96
published primer-probe set, extRD9, which targets a single copy region of the MTBC (Halse et
97
al. 2011).
98
To develop primer-probe sets specific for M. bovis, differences between other Mycobacterium
99
tuberculosis complex (MTBC) and M. bovis genomes were analysed using WebACT, the web-
100
based version of Artemis Comparison Tool (www.webact.org). Large rearrangements were
101
identified and several real-time PCR primer-probe sets were designed following parameters
102
described above using MacVector (MacVector, Inc., Cary, North Carolina, USA) based on the
PeerJ PrePrints | https://doi.org/10.7287/peerj.preprints.1703v1 | CC-BY 4.0 Open Access | rec: 3 Feb 2016, publ: 3 Feb 2016
103
sequence of M. bovis (NCBI reference sequence NC_002945). Each of these primer sets were
104
evaluated against publically available sequences of MTBC isolates. Two sites, Locus 2 (L2) and
105
Locus 3 (L3), were identified to be specific for M. bovis. This study also included a previously
106
published primer-probe set, targeting the lpqT locus, specific to M. bovis.(Reddington et al.
107
2011) Sequences and genome location of primer probe sets are contained in Table S1.
108
All primer-probe sets were manufactured at Integrated DNA Technologies (Coralville, Iowa,
109
USA). All probe oligonucleotides incorporate a 5’ FAM reporter, with the exception of extRD9
110
which signals with a 5’ CY5 reporter. All probe oligonucleotides incorporated an internal
111
fluorescent quencher (zen) and a 3’ non-fluorescent quencher, both recommended by the
112
manufacturer (Table S1). All PCR reactions reported in this study were performed in 20 l
113
reaction volumes using 10 l Taqman Fast-Advanced PCR Master Mix (Thermo Fisher
114
Scientific, Waltham, Massachusetts, USA), 1 l 20x primer-probe mix (final concentration:
115
primer, 500 nM; probe, 250nM), 4 l Milli-Q pure water, and 5 l of the purified DNA template.
116
The reaction mixture was initially incubated at 50oC for 2 minutes, then 95oC for 10 minutes.
117
Amplification occurred in 40 cycles: denaturation at 95oC for 15 seconds, and
118
annealing/extension at 60oC for 60 seconds. The PCR reaction was performed on either a ViiA7
119
or 7500 Fast real-time PCR system (Thermo Fisher Scientific).
120
Analytical sensitivity and specificity
121
Genomic DNA from selected Mycobacterium species (Table 1) was quantified using a Qubit®
122
(Thermo Fisher Scientific). Ten-fold serial dilutions of DNA were made using 1x TE pH8.0 to
123
reach the following concentration range: 1 ng/5l to 0.1 fg/5 l and were used to evaluate the
124
analytical sensitivity and efficiency of the 10 primer-probe sets. These DNA dilutions were also
125
used to test a cross-reactivity to Mycobacterium fortuitum with the primer-probe sets targeting
PeerJ PrePrints | https://doi.org/10.7287/peerj.preprints.1703v1 | CC-BY 4.0 Open Access | rec: 3 Feb 2016, publ: 3 Feb 2016
126
IS1081 and IS6110. Results were analysed by calculating % efficiency from the slope of the
127
standard curve for each primer-probe set.
128
Tissue extraction
129
The extraction process was separated into 2 parts, DNA isolation and then DNA purification. M.
130
bovis culture-positive, granulomatous tissue was obtained from 5 animals, dissected into 27,
131
300 mg portions, and stored at -20oC. Using a generalized randomized complete block design, 3
132
isolation methods and 3 purification methods were evaluated using 3 aliquots from each of the 5
133
animals. DNA purifications for a given DNA isolation method were performed on the same day,
134
and analyzed on the same PCR plate. (Note: the fourth DNA isolation method was adopted after
135
some inhibition issues were identified.).
136 137
DNA isolation methods: 1) NaOH: tissues were incubated in 50 mM sodium hydroxide (NaOH) at 95oC for 30
138
minutes, bead-disrupted using an equal mixture of 0.1 mm and 1.0 mm silicon beads (Bio
139
Spec Products, Inc., United Kingdom) for 2 minutes, and then centrifuged 10 minutes at
140
13K x g at 20oC.
141
2) Phenol/chloroform (PC): tissues were added to vials containing equal volumes TE and
142
phenol/chloroform (approximately 400 l each), bead-disrupted and centrifuged as above.
143
3) TE: tissues were incubated with 400 l 1x TE at 95oC for 30 minutes, bead-disrupted and
144 145
centrifuged as above. 4) TE/ PC: tissues were incubated with 400 l 1x TE at 95oC for 30 minutes and bead-
146
disrupted; tubes were centrifuged as above; approximately 400 l of the aqueous liquid
147
was removed and purified with phase separation using an equal volume of
148
phenol/chloroform and centrifuged as above.
PeerJ PrePrints | https://doi.org/10.7287/peerj.preprints.1703v1 | CC-BY 4.0 Open Access | rec: 3 Feb 2016, publ: 3 Feb 2016
149 150 151 152
Aqueous eluants from 1-3 were used to test three purification methods: 1) Method A: a commercial kit and protocol was followed (MagMAX™ Total Nucleic Acid Isolation Kit, 96 well plate format, Thermo Fisher Scientific). 2) Method B: a customized technology for high-throughput preparations; briefly, up to 400
153
l of the aqueous portion of the phase-separation extraction was removed and mixed with
154
1.2 ml DNA Binding Buffer (Zymo Research, Irvine, California, USA); this solution was
155
loaded onto the appropriate well either spin columns or 96-well spin plates, depending on
156
the number of samples; rinsed with pre-wash and wash buffers, and eluted with 100 l
157
buffer. (ZR Fecal DNA Miniprep, Spin columns or Zymo-Spin™ I-96 Plate (Deep-well)
158
formats, Zymo Research).
159 160
3) Method C: a traditional nucleic acid precipitation (400 l of aqueous liquid was combined with 1/10th volume 3M sodium acetate and 2 times volume ice-cold ethanol).
161
To evaluate the performance of the initial three DNA isolation and the three purification
162
methods, a linear model was fit using data from 4 of the 5 animals. One animal was eliminated
163
from the analysis because not all methods produced a C value. Methods were compared to each
164
other using mean differences in C values and 95% confidence intervals were calculated. A
165
result was considered statistically significant if the 95% CI did not span zero. DNA isolation
166
method 4 (TE/PC), developed later, was not included in these analyses.
167
Extraction and PCR controls
168
To monitor the extraction and PCR efficiency, 2.5 l of a commercially available control
169
was added to each disruption tube (E. coli hosting a plasmid containing a unique sequence,
170
DNA Extraction Control 670 (DEC670), Bioline, London, United Kingdom). One microliter
171
of DEC670 primer-probe mix (to achieve a Cvalue of 32-34) as added to the PCR mix and the
PeerJ PrePrints | https://doi.org/10.7287/peerj.preprints.1703v1 | CC-BY 4.0 Open Access | rec: 3 Feb 2016, publ: 3 Feb 2016
172
amount of water was adjusted to maintain a 20 l reaction volume. To establish an inhibition
173
cutoff value, standard deviations were calculated for 15 PCR runs and the acceptable range
174
for DEC670 was set at 3 standard deviations from the mean.
175
In addition to the commercially available control, three tissue controls were developed; a
176
negative control, and two tissue positive controls containing either H37Ra or BCG. The
177
negative control was produced by homogenizing approximately 300 g of bovine liver in 200
178
ml PBS. To produce the positive controls, cultures of M. bovis BCG (ATCC35734) and M.
179
tuberculosis H37Ra (ATCC25177) were grown in 7H9 broth containing 0.8% Tween-80 at
180
37oC with 10% CO2 for 3 - 4 weeks. Using a spectrophotometer, the optical density was
181
measured at 600 nm. Cells per ml was calculated using a modified extinction coefficient: 1
182
O.D. ~ 3 x 10⁶ cfu/ ml.(Larsen et al. 2007) Two ml of a type culture was added to 200 ml of
183
the homogenized liver, (final concentrations of bacteria per ml homogenate: H37Ra = 0.5 x 10 2
184
to 1.0 x 10² cfu/ml, BCG = 0.5 x 10³ to 1.0 x 10³ cfu/ml). One ml aliquots were stored at -20oC,
185
thawed once and kept refrigerated for up to 5 days before discarding. Approximately 100 l of
186
the controls were added directly to the prepared disruption tubes. The negative control and the
187
H37Ra tissue control were added between every 5th test sample for the first 20 samples and after
188
that, every 10th sample. The BCG tissue control was used one time at the end of the run.
189
Performance of the positive tissue controls was evaluated by measuring the mean and standard
190
deviation of the C values between replicate controls on the same plate and then comparing those
191
against previous runs. These controls are available through NVSL’s reagent catalog
192
www.aphis.usda.gov/nvsl .
193
Diagnostic sensitivity evaluation using archived tissues
PeerJ PrePrints | https://doi.org/10.7287/peerj.preprints.1703v1 | CC-BY 4.0 Open Access | rec: 3 Feb 2016, publ: 3 Feb 2016
194
Initially, 26 tissues archived at -20oC, (24 M. bovis culture positive, 2 M. tuberculosis positive
195
and 2 culture negative tissues) were blinded and tested with DNA isolation method 2 (PC), DNA
196
purification method B and MTBC primer-probe IS1081-3. Once method 2 was shown to be
197
problematic, those same tissues, along with 54 additional archived tissues were used to estimate
198
the sensitivities of both IS1081-3 and L3 primer-probe sets using DNA isolation method 4-
199
TE+PC, DNA purification method B. Inhibited samples were excluded from the analysis.
200
Sensitivity was calculated and 95% confidence intervals were obtained using the Clopper
201
Pearson method.(Agresti 2002)
202 203
Diagnostic specificity during side by side testing with slaughter surveillance
204
To characterize specificity, and develop a standardized laboratory workflow, the PCR was
205
implemented while continuing standard histopathology and culture testing during 4 months of
206
routine slaughter surveillance testing. Routine slaughter surveillance was defined as granulomas
207
identified during regular slaughter from animals with no known previous bTB exposure or
208
antemortem bTB test results. Briefly, granulomas identified during carcass inspection were split
209
with ½ the lesion placed in 10% buffered formalin for histopathology and ½ the lesion was
210
placed in sodium borate for culture. Histopathology was conducted the day after the samples
211
arrived, and tissue submitted in formalin for histopathology were routinely processed, sectioned
212
and stained with hematoxylin and eosin stains. If inflammatory lesions were identified
213
microscopically, additional histochemical stains were performed on the formalin fixed paraffin
214
embedded tissue and mycobacterial cultures were started on the tissue submitted in sodium
215
borate to help identify the underlying etiology of the inflammatory lesions. Samples were
216
diagnosed as ‘mycobacteriosis compatible” based on histopathology when there were
PeerJ PrePrints | https://doi.org/10.7287/peerj.preprints.1703v1 | CC-BY 4.0 Open Access | rec: 3 Feb 2016, publ: 3 Feb 2016
217
granulomatous lesions that contained acid-fast bacilli, and both the lesion characteristics and the
218
bacteria morphology were consistent with an M. bovis infection.(Waters et al. 2011) If the
219
diagnosis was mycobacteriosis compatible, the Pathology section would also perform
220
conventional PCRs targeting IS6110 for MTBC, 16S for M. avium, and IS900 for M.
221
paratuberculosis on sections from the paraffin block.(Miller et al. 1997; Waters et al. 2011)
222
Mycobacterial culture was performed by homogenizing the tissue, decontaminating with NaOH
223
and inoculating on to in-house modified 7H11 Middlebrooks solid media and BACTEC™
224
MGIT™ 960 liquid media.(Robbe-Austerman et al. 2013) Acid fast stains were conducted on all
225
signal positive media and suspicious colonies. If acid fast positive, DNA hybridization probes
226
specific to the MTBC were performed (AccuProbe Mycobacterium tuberculosis complex culture
227
identification test, Hologic, Sunnyvale, CA). If results were negative, cultures were reported out
228
as Mycobacterium species – not Mycobacterium tuberculosis complex. If results were positive,
229
whole genome sequencing was conducted to determine the species and genotype the isolate.
230
Direct PCR was performed on all sodium borate submitted samples following this workflow:
231
processing technicians sampled and heat inactivated the tissue, molecular technicians conducted
232
the bead disruption, extraction and PCR, and microbiologists analyzed the PCR run the next
233
morning. A run was considered valid if all the controls performed as expected and fewer than 1
234
in 10 samples were inhibited. Validated PCR results were provided to the pathologists after
235
histopathology was completed but prior to the report being released. Discrepant test results were
236
reviewed and the pathologists determined the final diagnosis. Once at least 1000 samples were
237
tested successfully, officials at the United States Department of Agriculture Animal Plant Health
238
Inspection Service (USDA-APHIS) evaluated the direct PCR assay workflow and results, and
239
approved its use in the National slaughter surveillance program.
PeerJ PrePrints | https://doi.org/10.7287/peerj.preprints.1703v1 | CC-BY 4.0 Open Access | rec: 3 Feb 2016, publ: 3 Feb 2016
240
To analyze these data, a true M. bovis case was defined as an animal that had both a
241
mycobacteriosis compatible histopathology result and a positive M. bovis culture. All other
242
samples were considered truly negative. Procedures allowed for specimens to be sampled
243
multiple times during the same PCR run at the discretion of the technician, and a sample was
244
considered PCR positive if any one subsample was positive. All direct PCR results with a
245
determined Cvalue were considered test positive.
246
Post validation performance
247
Once test implementation was approved by USDA-APHIS, the workflow outlined in Fig. 1 was
248
implemented. All borate samples were tested with the direct PCR independently and in parallel
249
with histopathology. If the results were PCR negative and the histopathology diagnosis was
250
anything other than mycobacteriosis compatible, no further testing was done. PCR signal
251
positive, mycobacteriosis compatible samples, and any discrepant results were cultured.
252
Histopathology results from discrepant cases were reviewed by the pathologists to re-access and
253
confirm their diagnosis. If the C value was less than 35, an M. bovis specific PCR was
254
conducted. To assist with trouble shooting the direct PCR assay, if the PCR results had a C
255
value greater than 35, a M. bovis specific PCR was generally not done, and the assay for that
256
sample was repeated. Data was collected from 2014-04-21 to 2015-05-06. The proportion of
257
histopathology positive and negative samples that tested positive and negative by PCR,
258
respectively, was estimated.
259
In addition to routine slaughter surveillance, animal health officials requested direct PCR testing
260
on cattle from known infected herds with gross lesions identified at necropsy or slaughter. A
261
total of 341 cattle from 3 affected premises were tested with the direct PCR in parallel with
262
either histopathology, culture, or both histopathology and culture as described above. For this
PeerJ PrePrints | https://doi.org/10.7287/peerj.preprints.1703v1 | CC-BY 4.0 Open Access | rec: 3 Feb 2016, publ: 3 Feb 2016
263
dataset, true positive cases were defined as either having a histopathologic diagnosis of
264
mycobacteriosis compatible or M. bovis culture positive results. Unlike the post validation
265
slaughter surveillance where direct PCR testing influenced culture results, these samples were
266
cultured independently of direct PCR results; consequently, sensitivity and specificity could be
267
calculated.
268
Results and discussion
269
Development of primer-probe sets, analytical sensitivity and specificity
270
The ten primer-probe sets ranged from 82-103% efficiency during the initial evaluation (Table
271
S2). All sets detected M. bovis DNA, and those designed to detect only M. bovis DNA did not
272
cross-react with other MTBC DNA (Table 1A). Primer-probes designed against IS1081 and
273
IS6110 did, however, cross-react with high concentrations of M. fortuitum DNA although at
274
significantly higher C values than comparable amounts of MTBC DNA. (Table 1B). At 100 pg,
275
these primer-probe sets did not detect M. fortuitum DNA, but still detected M. bovis DNA with
276
C values ranging from 19.52 to 21.89. While this cross-reactivity was interesting, M. fortuitum
277
DNA would not be expected to be found in diagnostic specimens at those levels, so the cross-
278
reactivity was not likely to be clinically relevant.
279
Because laboratory contamination with amplicons or even DNA is a well-known reoccurring
280
problem in clinical laboratories, it was prudent to identify and maintain multiple primer-probe
281
sets.(Mandal et al. 2012) Primer-probe sets targeting the multi-copy insertion sequences
282
consistently generated lower Cvalues than those targeting single copy locus (Table S2). While
283
no cross reactions occurred using the extRD9 primer-probe set, the analytical sensitivity
284
improvements gained by using a MTBC primer-probe sets to IS1081 or IS6110 was compelling.
PeerJ PrePrints | https://doi.org/10.7287/peerj.preprints.1703v1 | CC-BY 4.0 Open Access | rec: 3 Feb 2016, publ: 3 Feb 2016
285
Therefore, these were selected for the initial screening of borate submitted samples. Positive
286
results were followed with a M. bovis specific probe-primer set if M. bovis was suspected or with
287
extRD9 if another MTBC organism was expected. Consequently, the primer-probe sets 1081-3,
288
6110-2, extRD9, L2, L3, and lpqT were evaluated against tissue extracts reported below (Fig.
289
2B).
290 291
Tissue extraction
292
DNA isolation method 1 (NaOH) clearly underperformed when combined with purification
293
method A, failing to consistently identify 4 of the 5 culture positive animals (Fig. 2A, Table S3).
294
Sample 07315 failed to produce C values for all three subsamples in a majority of the testing,
295
and was excluded from comparative analysis of the methods. No significant differences were
296
identified between method 2 (phenol-chloroform), or method 3 (TE) (Table S4 A, B). DNA
297
purification method B was the only method to produce statistically significant lower mean C
298
values (Table S4 C, D). Demonstrating statistical significance with small sample sizes is
299
difficult, however, these small studies can provide rapid guidance when testing diverse methods.
300
Other criteria also influence choices of methodology, for example DNA isolation method 3
301
required a 30 minute incubation step not required in method 2. All samples purified by method
302
C, ethanol precipitation, showed negative test results. This may be due to high quantities of DNA
303
purified, which likely overwhelmed the PCR reactions. The spin filter (method B) and magnetic
304
beads (method A) inherently normalize DNA amounts in the final eluent. Because method C
305
would probably require an additional DNA quantification step to normalize the amount of DNA
306
added to the PCR reaction, this method was not investigated further. Because < 24 hour
PeerJ PrePrints | https://doi.org/10.7287/peerj.preprints.1703v1 | CC-BY 4.0 Open Access | rec: 3 Feb 2016, publ: 3 Feb 2016
307
turnaround time was desired, the more rapid, DNA isolation method 2 was initially chosen and
308
combined with purification method B.
309
Sensitivity
310
During the first week of slaughter surveillance side by side testing, all 5 PCR runs contained
311
inhibited samples (no C value detected for both the DEC670 and MTBC primer-probe sets)
312
with an overall rate of 22%, a problem not seen during development. A decision was made to
313
combine methods 2 and 3 into method 4, which solved the inhibition problem. The sensitivity
314
evaluation was repeated with 80 archived tissues (the original 26 in addition to another 54).
315
(Files S1, S2) It did not appear that the sensitivity was negatively impacted by combining
316
methods 2 and 3. The sensitivity for the 1081-3 primer-probe set was 0.96 (95% CI: 0.89, 0.99)
317
and for the L3 primer-probe set was 0.89 (95% CI: 0.80, 0.95). (Table 2A and 2B)
318 319
Specificity
320
During the routine slaughter surveillance side-by-side testing, 1742 tissues were tested using the
321
1081-3 primer-probe set (File S3). Of those, 1736 tested negative by both PCR and
322
histopathology. PCR correctly identified all three positive samples and misidentified three
323
samples as positive for a specificity of 0.998 (95% CI: 0.994, 1.000). (Table 2C) This supported
324
initial thoughts that the cross reactivity with M. fortuitum was not clinically relevant. Because the
325
L3 M. bovis specific probe-primer set was used only to identify if the positive results from the
326
MTBC primer-probe sets were due to M. bovis, diagnostic specificity was not done for this
327
primer-probe set.
328 329
Post validation performance
PeerJ PrePrints | https://doi.org/10.7287/peerj.preprints.1703v1 | CC-BY 4.0 Open Access | rec: 3 Feb 2016, publ: 3 Feb 2016
330
A total of 273 PCR runs were performed during 54 weeks, 251 of which were deemed as valid,
331
and 15 as invalid. The most common reason for determining a failed run was an excessive
332
number of inhibited controls or samples, often complicated with false positive signals in samples
333
and negative controls. Of the 6162 samples tested during this time period, 38 were PCR MTBC
334
positive and confirmed by both histopathology and culture, and 47 were PCR positive but were
335
not confirmed by either histopathology or culture (Table 2D, File S4). While the PCR detected
336
all the mycobacteriosis compatible cases identified by histopathology (that were not caused by
337
atypical mycobacteria) during this time period, there were slightly more false positive samples
338
than expected. Nearly all of the samples with false positive signals were retested the next day
339
while they were prepared for culture and in all but 2 cases, the false positive signals were not
340
repeated. Despite this problem, the PCR did identify 2 cases that were initially missed by the
341
histopathology, and corrected upon review of the slides. Of importance, one of those cases had
342
an initial diagnosis of coccidiomycosis which, under the old system, would not have been
343
cultured. These results reinforced the importance of performing two independent tests during
344
routine diagnostic testing.
345
Because the PCR influenced how histopathology and culture were conducted, a true sensitivity
346
and specificity cannot be calculated from this sample set; however, estimations should be
347
calculated to evaluate post validation performance. The proportion of probable negative samples
348
that tested PCR negative was 0.992 (95% CI: 0.990, 0.994) and the proportion of probable
349
positive samples that tested PCR positive was 1.00 (95% CI: 0.91, 1.00).
350
All three controls used were designed to have C values between 32 - 35, a value that is about as
351
high as possible and yet still consistently test positive during a normal run. The BCG control was
352
developed to consistently be 2-3 C values lower than the H37Ra control because it needed to be
PeerJ PrePrints | https://doi.org/10.7287/peerj.preprints.1703v1 | CC-BY 4.0 Open Access | rec: 3 Feb 2016, publ: 3 Feb 2016
353
reliably positive when testing samples with the less sensitive M. bovis specific primer probe sets.
354
Since most PCR runs had greater than 5 negative and H37Ra controls, within plate and day to
355
day precision can be monitored over time. Table 3 shows the mean C values and their standard
356
deviations during post validation performance for all control samples (File S4). Interestingly, the
357
variability between the controls was fairly consistent, but rather high (1.3 – 1.8). Several
358
unsuccessful attempts were made to improve this variability, such as increasing or decreasing
359
tissue concentrations and volumes. Fig. 3 shows a box-and-whisker plot of the confirmed
360
positive (both 1081-3 and L3), the false positive samples and the spiked controls. Nearly all of
361
the false positive samples had higher C values than the controls, and the controls generally had
362
higher C values than positive samples. This assisted in predicting the false positive samples.
363
The apparent reduction in specificity from the side by side testing (3/1739) to the post validation
364
testing (49/6124), suggests laboratory cross contamination, especially since the vast majority
365
were not confirmed when re-tested.(Borst et al. 2004) This is not unexpected with an open DNA
366
isolation and purification system containing a large number of positive controls that challenge
367
the system. Potential improvements to reduce this risk would depend on the cause of the
368
contamination. If contamination is due to within plate cross contamination, centrifugation of spin
369
plates could be replaced with a vacuum apparatus, and manual pipetting could be replaced by a
370
liquid handling system. If contamination is due to amplicons or carryover from previous runs,
371
strict work flow guidelines and environmental controls must be evaluated and potentially
372
altered.(Aslanzadeh 2004; Lo & Chan 2006) Parallel testing with histopathology has prevented
373
this false positive rate from negatively impacting the program, however, it is critical to keep
374
cross contamination at a minimum.
375
Performance of the PCR on samples from known infected herds
PeerJ PrePrints | https://doi.org/10.7287/peerj.preprints.1703v1 | CC-BY 4.0 Open Access | rec: 3 Feb 2016, publ: 3 Feb 2016
376
While the goal of the PCR was to replace mycobacterial culture screening for routine slaughter
377
surveillance, State and Federal animal health officials also request its use during the surveillance
378
of bTB affected herds to assist with ante mortem test evaluation (File S5). This was an
379
opportunity to conduct a more robust analysis of sensitivity. Of the 341 samples tested in
380
parallel, one was eliminated due to inhibition, 307 were confirmed positive and 33 negative by
381
histopathology or culture. PCR detected 297 of the 307 using the 1081-3 primer-probe set for a
382
sensitivity of 0.97 (95% CI: 0.94, 0.99) (Table 2E). During follow-up testing for M. bovis, the
383
L3 primer-probe set correctly identified 289 of the 303 positive samples tested for a sensitivity
384
of 0.95 (95% CI: 0.92, 0.97) (Table 2F). The 97% sensitivity of the assay in cattle from known
385
infected herds was similar to the initial sensitivity estimate of 0.96 (95% CI: 0.89, 0.99) using
386
archived samples.
387
Interestingly, testing tissue samples from affected herds (both archived and diagnostic cases) had
388
a higher rate of false negatives than routine slaughter-surveillance, of which there were no
389
apparent misses. This most likely was caused by sampling. For routine slaughter surveillance,
390
granulomas must be developed well enough to be identified during the inspection process. In
391
contrast, animals from infected herds go through an enhanced inspection process and often the
392
slightest abnormality is submitted for testing. During culture, up to 50 g of tissue was processed
393
and concentrated verses a 300 mg portion used in the direct PCR. This puts tissues in the early
394
stages of granuloma formation with very few bacteria more susceptible for false negative results.
395
396
Conclusion
PeerJ PrePrints | https://doi.org/10.7287/peerj.preprints.1703v1 | CC-BY 4.0 Open Access | rec: 3 Feb 2016, publ: 3 Feb 2016
397
This paper describes the validation and implementation of direct PCR in the USDA bTB
398
slaughter surveillance program. This assay has allowed the USDA to efficiently test all samples
399
submitted in parallel with histopathology, improving accuracy by reducing laboratory error.
400
Limitations of the PCR assay include the need for highly trained staff, strict workflow
401
procedures, environmental controls to prevent cross contamination, and the small sample volume
402
requiring careful dissections of visible lesions. Despite these limitations, the assay appears to be
403
highly sensitive and specific. During the year of post validation slaughter surveillance testing, no
404
histologic positive samples were missed by the PCR, and 2 additional cases were detected
405
preventing erroneous results from being released.
406 407 408 409 410 411 412 413 414 415 416 417 418 419 420 421 422 423 424 425 426 427
Agresti A. 2002. Categorical data analysis, Exact Small-Sample Inference. Hoboken, NJ: Wiley. Aslanzadeh J. 2004. Preventing PCR amplification carryover contamination in a clinical laboratory. Ann Clin Lab Sci 34:389-396. Borst A, Box AT, and Fluit AC. 2004. False-positive results and contamination in nucleic acid amplification assays: suggestions for a prevent and destroy strategy. Eur J Clin Microbiol Infect Dis 23:289-299. 10.1007/s10096-004-1100-1 Broccolo F, Scarpellini P, Locatelli G, Zingale A, Brambilla AM, Cichero P, Sechi LA, Lazzarin A, Lusso P, and Malnati MS. 2003. Rapid diagnosis of mycobacterial infections and quantitation of Mycobacterium tuberculosis load by two real-time calibrated PCR assays. J Clin Microbiol 41:4565-4572. Bustin SA, Benes V, Garson JA, Hellemans J, Huggett J, Kubista M, Mueller R, Nolan T, Pfaffl MW, Shipley GL, Vandesompele J, and Wittwer CT. 2009. The MIQE guidelines: minimum information for publication of quantitative real-time PCR experiments. Clin Chem 55:611-622. 10.1373/clinchem.2008.112797 Collins DM, and Stephens DM. 1991. Identification of an insertion sequence, IS1081, in Mycobacterium bovis. FEMS microbiology letters 83:11-15. Eisenach KD, Cave MD, Bates JH, and Crawford JT. 1990. Polymerase chain reaction amplification of a repetitive DNA sequence specific for Mycobacterium tuberculosis. Journal of Infectious Diseases 161:977-981.
PeerJ PrePrints | https://doi.org/10.7287/peerj.preprints.1703v1 | CC-BY 4.0 Open Access | rec: 3 Feb 2016, publ: 3 Feb 2016
428 429 430 431 432 433 434 435 436 437 438 439 440 441 442 443 444 445 446 447 448 449 450 451 452 453 454 455 456 457 458 459 460 461 462 463 464 465 466 467 468 469 470 471 472 473 474
Flores LL, Pai M, Colford JM, and Riley LW. 2005. In-house nucleic acid amplification tests for the detection of Mycobacterium tuberculosis in sputum specimens: meta-analysis and metaregression. BMC microbiology 5:55. Garbaccio S, and Cataldi A. 2010. Evaluation of an immunomagnetic capture method followed by PCR to detect Mycobacterium bovis in tissue samples from cattle. Rev Argent Microbiol 42:247-253. Greco S, Rulli M, Girardi E, Piersimoni C, and Saltini C. 2009. Diagnostic accuracy of in-house PCR for pulmonary tuberculosis in smear-positive patients: meta-analysis and metaregression. Journal of Clinical Microbiology 47:569-576. Halse TA, Escuyer VE, and Musser KA. 2011. Evaluation of a single-tube multiplex real-time PCR for differentiation of members of the Mycobacterium tuberculosis complex in clinical specimens. J Clin Microbiol 49:2562-2567. 10.1128/JCM.00467-11 Larsen MH, Biermann K, and Jacobs WR, Jr. 2007. Laboratory maintenance of Mycobacterium tuberculosis. Curr Protoc Microbiol Chapter 10:Unit 10A 11. 10.1002/9780471729259.mc10a01s6 Lo YM, and Chan KC. 2006. Setting up a polymerase chain reaction laboratory. Methods Mol Biol 336:1118. 10.1385/1-59745-074-X:11 Mandal S, Tatti KM, Woods-Stout D, Cassiday PK, Faulkner AE, Griffith MM, Jackson ML, Pawloski LC, Wagner B, Barnes M, Cohn AC, Gershman KA, Messonnier NE, Clark TA, Tondella ML, and Martin SW. 2012. Pertussis Pseudo-outbreak linked to specimens contaminated by Bordetella pertussis DNA From clinic surfaces. Pediatrics 129:e424-430. 10.1542/peds.2011-1710 Miller J, Jenny A, Rhyan J, Saari D, and Suarez D. 1997. Detection of Mycobacterium bovis in formalinfixed, paraffin-embedded tissues of cattle and elk by PCR amplification of an IS6110 sequence specific for Mycobacterium tuberculosis complex organisms. J Vet Diagn Invest 9:244 - 249. Naugle AL, Schoenbaum M, Hench CW, Henderson OL, and Shere J. 2014. Bovine tuberculosis eradication in the United States. Zoonotic Tuberculosis: Mycobacterium bovis and Other Pathogenic Mycobacteria, Third Edition:235-251. Pan S, Gu B, Wang H, Yan Z, Wang P, Pei H, Xie W, Chen D, and Liu G. 2013. Comparison of four DNA extraction methods for detecting Mycobacterium tuberculosis by real-time PCR and its clinical application in pulmonary tuberculosis. J Thorac Dis 5:251-257. 10.3978/j.issn.20721439.2013.05.08 Reddington K, O'Grady J, Dorai-Raj S, Niemann S, van Soolingen D, and Barry T. 2011. A novel multiplex real-time PCR for the identification of mycobacteria associated with zoonotic tuberculosis. PLoS ONE 6:e23481. 10.1371/journal.pone.0023481 Robbe-Austerman S, Bravo DM, and Harris B. 2013. Comparison of the MGIT 960, BACTEC 460 TB and solid media for isolation of Mycobacterium bovis in United States veterinary specimens. BMC Veterinary Research 9:74. Stewart LD, McNair J, McCallan L, Gordon A, and Grant IR. 2013. Improved Detection of Mycobacterium bovis Infection in Bovine Lymph Node Tissue Using Immunomagnetic Separation (IMS)-Based Methods. PLoS ONE 8:e58374. 10.1371/journal.pone.0058374 Taylor G, Worth D, Palmer S, Jahans K, and Hewinson R. 2007. Rapid detection of Mycobacterium bovis DNA in cattle lymph nodes with visible lesions using PCR. BMC Vet Res 3:12. Taylor MJ, Hughes MS, Skuce RA, and Neill SD. 2001. Detection of Mycobacterium bovis in bovine clinical specimens using real-time fluorescence and fluorescence resonance energy transfer probe rapid-cycle PCR. Journal of Clinical Microbiology 39:1272-1278. Thacker T, Harris B, Palmer M, and Waters W. 2011. Improved specificity for detection of Mycobacterium bovis in fresh tissues using IS6110 real-time PCR. BMC Veterinary Research 7:50.
PeerJ PrePrints | https://doi.org/10.7287/peerj.preprints.1703v1 | CC-BY 4.0 Open Access | rec: 3 Feb 2016, publ: 3 Feb 2016
475 476 477 478 479 480 481
Waters WR, Stevens GE, Schoenbaum MA, Orloski KA, Robbe-Austerman S, Harris NB, Hall SM, Thomsen BV, Wilson AJ, Brannian RE, Nelson JT, Schafer S, Esfandiari J, Dutton M, Greenwald R, and Lyashchenko KP. 2011. Bovine tuberculosis in a nebraska herd of farmed elk and fallow deer: a failure of the tuberculin skin test and opportunities for serodiagnosis. Vet Med Int 2011:953985. 10.4061/2011/953985 Wittwer CT, Herrmann MG, Moss AA, and Rasmussen RP. 1997. Continuous fluorescence monitoring of rapid cycle DNA amplification. Biotechniques 22:130-131, 134-138.
482
PeerJ PrePrints | https://doi.org/10.7287/peerj.preprints.1703v1 | CC-BY 4.0 Open Access | rec: 3 Feb 2016, publ: 3 Feb 2016
Table 1(on next page) Analytical specificity of M. tuberculosis complex and M. bovis primer-probe sets A) Cycle threshold results from each primer-probe set against DNA extractions from selected Mycobacterium species. B) Cycle threshold results from the primer-probe sets targeting IS1081 and IS6110 elements against serial dilutions of M. fortuitum genomic DNA as compared to 100 pg BCG genomic DNA.
PeerJ PrePrints | https://doi.org/10.7287/peerj.preprints.1703v1 | CC-BY 4.0 Open Access | rec: 3 Feb 2016, publ: 3 Feb 2016
A
1 2 3 4 5 6 7 8
Isolate M. bovis BCG M. tuberculosis H37Ra M. microti M. africanum M. kansasii M. avium subsp. avium M. avium subsp. paratuberculosis M. fortuitum M. terrae *U = undetermined Cycle threshold
ATCC ID 35734 25177 11152 25420 12478 25291 19698 6841 15755
1081_1 23.59 14.62 15.63 14.996 U* U U 33.68 U
1081_2 23.25 14.3 14.81 14.29 U U U 35.005 U
1081_3 22.24 14.4 15.26 14.65 U U U 33.35 U
B Isolate M. bovis BCG (100pg) M. fortuitum (100ng) M. fortuitum (10ng) M. fortuitum (1ng) M. fortuitum (100pg)
1081-1 19.75 37.6 36.39 36.84 U
Cycle threshold number 6110_1 6110_2 lpqT 26.33 23.97 27.54 12.87 11.97 U 13.87 12.97 U 14.75 13.83 U U U U U U U U U U 33.16 31.41 U U U U Cycle threshold number 1081-3 6110-1 19.52 21.89 34.87 33.6 36.98 34.56 U U U U
6110-2 21.13 32.78 33.95 U U
*U = undetermined Cycle threshold
PeerJ PrePrints | https://doi.org/10.7287/peerj.preprints.1703v1 | CC-BY 4.0 Open Access | rec: 3 Feb 2016, publ: 3 Feb 2016
L2 28.66 U U U U U U U U
L3 28.3 U U U U U U U U
extRD3 25.58 17.65 18.39 17.98 U U U U U
Table 2(on next page) Comparison of direct real-time PCR to histology and / or culture. A) Eighty archived tissues previously tested with histology and culture were compared to PCR using the M. tuberculosis complex 1081-3 primer-probe set and B) the M. bovis L3 primer-probe set of which 5 were inhibited and removed. C) Routine slaughter-surveillance samples compared with the traditional workflow of histology and culture to the IS1081-3 PCR (side by side testing), primarily to evaluate specificity. D) Routine slaughter surveillance, post validation, comparing IS1081-3 PCR to histology (followed with culture when indicated). E) Lesioned tissue from cattle in known bTB affected herds that compared histology and /or culture to the 1081-3 primer-probe set and F) the L3 primer-probe set ( 5 samples not tested).
PeerJ PrePrints | https://doi.org/10.7287/peerj.preprints.1703v1 | CC-BY 4.0 Open Access | rec: 3 Feb 2016, publ: 3 Feb 2016
1 A
IS1081-3 Positive PCR Negative
C
IS1081-3 Positive PCR Negative
E
IS1081-3 Positive PCR Negative
Archived lesioned tissues Histology and culture bTB Positive bTB Negative
B
74
0
74
3 77
3 3
6 80
L3 PCR
Slaughter surveillance, side by side testing Histology and culture bTB Positive bTB Negative 3
3
0 3
1736 1739
6 1736 1742
297
1
298
9 306
32 33
41 339
Positive
65
0
65
Negative
8 73
2 2
10 75
D
IS1081- Positive 3 PCR Negative
Lesioned tissue from bTB affected herds Histology or culture bTB Positive bTB Negative
F
L3 PCR
Archived lesioned tissues Histology and culture bTB Positive bTB Negative
Slaughter surveillance, post validation Histology (confirmed by culture) bTB Positive bTB Negative 38
47
0 38
6077 6124
85 6077 6162
Lesioned tissue from bTB affected herds Histology or culture bTB Positive bTB Negative
Positive
289
0
289
Negative
14 303
31 31
45 334
PeerJ PrePrints | https://doi.org/10.7287/peerj.preprints.1703v1 | CC-BY 4.0 Open Access | rec: 3 Feb 2016, publ: 3 Feb 2016
Table 3(on next page) In-house PCR tissue control performance The real-time PCR performance of in-house PCR tissue controls using a commercial exogenous control and the M. tuberculosis complex primer-probe set 1081-3 during the 54 weeks of post validation slaughter surveillance.
PeerJ PrePrints | https://doi.org/10.7287/peerj.preprints.1703v1 | CC-BY 4.0 Open Access | rec: 3 Feb 2016, publ: 3 Feb 2016
1
PCR Primerprobe DEC670 DEC670 1081-3 DEC670 1081-3
Sample Negative Control H37Ra Control H37Ra Control BCG Control BCG Control
Total # tested 1233 1233 1233 251 251
Mean (C) 34.4 34.5 33.0 34.6 31.5
Standard deviation 1.8 1.6 1.4 1.6 1.5
PeerJ PrePrints | https://doi.org/10.7287/peerj.preprints.1703v1 | CC-BY 4.0 Open Access | rec: 3 Feb 2016, publ: 3 Feb 2016
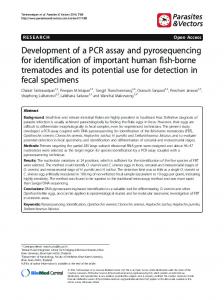
Figure 1(on next page) Diagnostic testing work flow before and after the implementation of direct PCR for bTB slaughter surveillance Prior to the implementation of direct PCR, parallel testing by mycobacterial culture was only able to be conduted on approximately 40% of submitted samples and bTB cases misclassified by histology were detected weeks after the lesion was submitted. After direct PCR implementation, 100 % of cases were tested in parallel with histology and PCR prior to release of histology results and only test positive or discrepant cases were subsequently tested by mycobacterial culture.
PeerJ PrePrints | https://doi.org/10.7287/peerj.preprints.1703v1 | CC-BY 4.0 Open Access | rec: 3 Feb 2016, publ: 3 Feb 2016
60%
Slaughter surveillance granuloma identified
Borate sample not cultured
Collect: Borate sample for Culture
Etiology determined by Histopathology
Formalin sample for Histopathology
Prior to direct PCR After direct PCR Slaughter surveillance granuloma identified
100%
MTBC PCR conducted on borate sample
+
Release report
Results and Report ≤8 wks.