P.O.Boa 652, District Six, Cape Town, 8000. South Africa. Abstract - Information on the material, phase and distribution within industrial mass-transfer systems is.
Development of a Material Phase Detection System using Capacitance Tomography Q . Smit
J. Tapson
B.J.P.Mortimer
Centre for Instrumentation Research School of Electrical Engineering, Cape Technikon P.O.Boa652, District Six, Cape Town, 8000. South Africa
-
Abstract Information on the material, phase and distribution within industrial mass-transfer systems is required for system control. This paper describes the development of a v e r s a t i l e s e l f - t u n i n g capacitancdconductancesensor system tbat can be used as a tomogr;rphic system to image the contents within a pipeline.
Our first applications have been the measurement of the dielectk constant of water in soils, as well as in recycled oil [3]. In both applications, our approach has shown advantages over conventional measuring methods.
1. Introduction.
A functional block diagram of the measurement technique is presented in figure 2. To improve on the AC based “lock-in detection” technique, we have introduced multiple feedback loops based on the measurement technique of Marioli et a1 [151. The operation of the circuit can be summarised as follows: the sensorcapacitorselectedby the multiplexingcircuitryis driven by a sinusoidal signal which is frequency stabilized and frequency controlled. The current through the capacitive sensor consists of an in-phase and quadrature component with amplitudes related to the measured loss conductance G, and capacitanceC,between the sensor electrodes, where G, and C, are the conductance and capacitanceof the sample. The vector sum of these components is converted to a voltage signal by means of a current to voltage amplifier. Each of these output voltages is synchronously demodulated or detected by a quadrature phase sensitive detector. This is now passed through a low-pass filter which rejects the AC components and
Multi-commnent flow measurement has become increasingly impomnt for the resource exploit$ion, energy conservation and process control industries. Conventional flowmeters average a property of the flow over the cross sectionof the pipe, and are unsuitable for accurate measurements in cases where the Component material distribution and phase is varying in space and time in a statistically non-stationary manner. This paper describes the development of a capacitance and m on AC-based lock-in conductance measurement system b detection with multiple feedback, developed by Marioli et al
[W. The block diagram of our system (shown in figure l), consists of an eightelectrode capacitancesensor; a multiplexingcircuit which selects two of the eight electrodes in any possible combination, and a self-tuningAC based “lock-in detection” technique with multiple feedback loops [3] which has the ability to shift internal phases thereby maintaining the phase
2. Self-tuning AC-based “lock-in detection” techniaue with multiple feedback.
1-1 I
I
n
Electrodes
Figure 1: The basic multi-componentflow measurement system.
shifts needed for synchronous detection.
Figure 2: An electronic circuit employing an auto-balancing technique via negative feedback from Marioli et a/ [1,2]
0-7803-55466/99/$10.00 0 1999 IEEE
927
produces resultant DC voltages V , and V , whose amplitudes are proportional to C, and G, respectively. These two signals are integrated and multiplied with carrier signals in opposite phases with currents passing through C,and G,. The outputs of the two multipliersare converted into currents which in turn subtractfrom those passing through the sensor. Effectively, the current due to the mean values of the sensor capacitance and loss conductance is cancelled by these subtracting currents I, and , controlled by means of two separate feedback loops. The stabilityof the carrier frequencies (and phase shifts) are of great importance to the overall accuracy and stability of the “lock-in detection” method. Marioli et a1 [1,2] failed to address this important aspect. With the development of a selftuned circuit [3], the problems experiencedwith instabilityand accuracy were overcome.
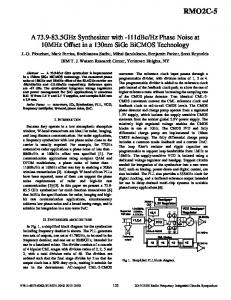
Voltage vs Conductance 10 1
L
Figure 4: Graph of self-tuning conductive sensing element‘s output verses a range of conductance values of conventional resistors in parallel with the sensor electrodes
4. Tomographic implementation. 3. Experimental results
Tests were conducted on the capacitive sensing element of the standard instrument using a range of capacitor values from 1 pF to 100 pF in parallel with a 100 WZ resistor. The output VOu as a function of the sensor capacitance was measured, as shown in figure 3. The results obtained revealed a high degree of linearity throughout the full range; the sensitivity of the capacitive sensing element was found to be 36 mV pF’.
Voltage vs Capacitance 5-
z
b
f
The active electrodes are switched to the self-tuning capacitance sensor by means of digitally controlled switches. In a complete data collection cycle all 28 independent measurement combinations are made. The redundant electrodesare always c o ~ e c t e dto earth forming ‘guard rings’ and enabling the measurement sensitivity to be focused between the selected electrode pair. Image reconstruction algorithms making use of the backprojection as described by Huang et a1 [4] can then be used to obtain the flow image. We will extend this to include conductance measurement information as well as capacitance. 5. Conclusions.
4-
This project has investigated the development of a self-tuning measuring instrument for the use of multicomponent flow measurement. Our self-tuning instrument provided a capacitance measurement independent of the loss conductance of the measurant which is phase-stable and therefore repeatable. This technique can readily be extended to full capacitance and conductance tomography to investigate material content within a pipe.
321-
Figure 3:Graph of self-tuning capacitive sensing element‘s output verses a range of capacitance values using conventionalcomponents in parallel with sensor electrodes
The authors are grateful for financial support fiom the FRD and DebTech (Pty) Ltd. References.
The same range of tests were performed on the self-tuning capacitance sensor with a range of resistor values fiom 1 MG? down to 10 WZ again used in the experiment. The self-tuning instrument’s measured output voltage V,, as a function of the “sensorloss conductance”is shown in Figure 4. The results obtained also revealed a high degree of linearity (for the conductive sensing element) throughout the full range. The sensitivity of the conductive sensing element was found to be 115 mV pS’.
[ll
PI r31
[41
928
D Marioli, E Sardini, A Taroni, “High-accuracy measurement techniques for capacitance transducers”. Meas. Sci. Technol,vol. 4, pp. 337343, 1993. D Marioli E Sardini, A Taroni “Measurement of small capacitance variations”, IEEE Trans. Insfrum. Meas, vol. 40, pp. 426-428, 1991. Q Smit, B P Mortimer and J Tapson, “General Self-Tuning Capacitance Sensor”, MTech Thesis, Cape Technikon, 1998. S M Huang, A Plaskowski, C G Xie, M S Beck, ‘‘ Tomographic imaging of two-phase flow using capacitance sensors”,J.Phys. E: Sci. Instrum, vol 22, pp. 173-177, 1998.
0-7803-5546-6/99/$10.00 0 1999 IEEE