K D Tripati, Essentials of medical pharmacology, 6th edition, Jaypee brothers
medical publishers (p) LTD, 683. 3. W. O. Foye, Principles of Medicinal.
Chemistry ...
International Journal of Pharma and Bio Sciences ANALYTICAL CHEMISTRY
RESEARCH ARTICLE
DEVELOPMENT OF NEW VALIDATED SPECTROPHOTOMETRIC METHOD FOR THE ESTIMATION OF SULPHAMETHOXAZOLE & ITS APPLICATION TO PROTEIN BINDING STUDIES
Corresponding Author
K V HIMAVANI Department of Pharmaceutical Analysis & Quality Assurance Raghavendra Institute of Pharmaceutical Education and Research K.R.Palli cross, Ananthapur-515721.A.P.
Co Authors
M. SUDHEER, G. NARESH, A. PADMA AND P. RAMALINGAM Department of Pharmaceutical Analysis & Quality Assurance Raghavendra Institute of Pharmaceutical Education and Research K.R.Palli cross, Ananthapur-515721.A.P.
ABSTRACT A rapid, reliable and sensitive UV-spectrophotometric method has been developed for the determination of the Sulphamethoxazole and its in- vitro protein binding studies. The developed method has been validated statistically as per USP. The sulphamethoxazole shows λ max at 254.2 nm and the linearity plot yielded a correlation coefficient (R2) of 0.9999 over the Beers range of 1–5µg/ml. The regression equation was found to be Y=0.0676x + 0.0011, The molar absorptivity (mol/lit) was found to be 1.72X10⁴ with Sandells sensitivity ( µg/cm2/0.001 ) of 0.01468, % recovery 100.42, %RSD 0.0041 for precision, LOD & LOQ were found to be 0.283 and 0.857 respectively. The developed method was employed in in- vitro protein binding studies, the drug shows 50-60% binding and it was good agreement with reported pharmacokinetic data and drug release kinetics.
This article can be downloaded from www.ijpbs.net
P - 565
KEYWORDS Sulphamethoxazole, Protein binding, UV spectrophotometer.
INTRODUCTION Sulphamethoxazole is an antimicrobial agent, and comes under sulphonamide group, except for the poorly absorbed sulphonamides, used for the ulcerative colitis, reduction of bowel flora &the topical burn preparations1. These drugs are rapidly and nearly completely absorbed from GIT. Extent of plasma protein binding differs considerably 10 – 95 % among different members2. Depending upon whether the drug is a weak or strong acid or base, or is neutral, it can bind to a single blood protein, to multiple proteins (e.g. serum albumin, acid-glycoprotein (AGP) or lipoproteins). The most significant protein involved in the binding of drugs is albumin, which comprises more than half of all blood proteins. Albumin can interact with acidic or basic drugs in the plasma by van der Waals dispersion forces, hydrophobic bonding, hydrogen bonding, and ionic interactions 3. AGP interacts with mainly with basic entities whereas lipoproteins bind both basic and neutral drugs. The extent to which a drug is bound to plasma proteins can affect the distribution of the drug in several ways. The drug/protein complex does not permeate phospholipid bilayers, including capillary membranes, glomerular membranes in the nephrons, and the blood brain barrier 3. For these reasons, drugs with high protein binding activity values tend to have a greater half-life compared to those with lower values and bound drug is both pharmacodynamically & pharmacokinetically inert 4. The prolonged activity resulting from these factors may be desirable, or may promote the emergence of undesirable side effects.
MATERIALS & METHODS A Systronics UV-Visible Spectrophotometer-117 with 1 cm matched quartz cells were used for all spectral measurements. All chemicals used were obtained from Lobha Chemie and Merck Pvt. Ltd, Mumbai. Sample Standard of sulphamethoxazole was obtained from Natco Pharmaceuticals and was systematically authenticated for its standard and identity. 1. Selection of solvent: 7.0 pH buffer was selected as solvent for the sulphamethoxazole in vitro protein binding studies because at that pH the drug was remain stable at the room temperature. 2. Preparation of standard stock solution: 100mg of accurately weighed sulphamethoxazole was dissolved and made up to 100ml with buffer to get 1mg/ml concentration of standard solution. Various working concentrations were made by further dilutions with same medium. 3. Method validation: Linearity: The method was validated according to ICH Q2B guidelines for validation of analytical procedures in order to determine the linearity, sensitivity, precision and accuracy of the analyte. Five point calibration curves were generated with appropriate volumes of the working standard solutions for UV methods. The linearity and regression equation was shown in Table-1and in Figure – 1.
This article can be downloaded from www.ijpbs.net
P - 566
Table 1 Regression data for the method S.No
Parameter
1 2 3
λmax(nm) Beers range (µg/ml) Regression equation Slope Intercept Correlation co-efficient Molar extinction co-efficient(lit/mol.cm) Sandells sensitivity(µg/cm2/0.001) LOD & LOQ (µg/ml)
4 5 6 7
Optimized for Sulphamethoxazole 254.2 1-5 Y=0.0676x+0.0011 0.0676 0.0011 0.9999 1.72X10⁴ 0.01468 0.283 & 0.857
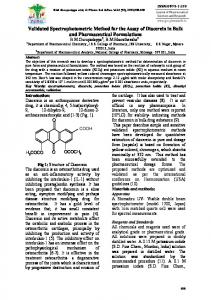
Figure- 1:
abs
Calibration curve of sulphamethoxazole 0.4 0.35 0.3 0.25 0.2 0.15 0.1 0.05 0
y = 0.0677x + 0.001 R2 = 0.9999
0
1
2
3
4
5
6
conc
Precision: Precision is the degree of repeatability of an analytical method under normal operational conditions. Both Inter - day precision and Intra -
day precision were carried out as per the statistical requirement to support reproducibility of the method. The results were shown in Table – 2.
This article can be downloaded from www.ijpbs.net
P - 567
Table 2 Precision S.No 1 2 3 4 5
Concentration of Sulphamethoxazole 5 5 5 5 5
Absorbances
%RSD
0.340 0.343 0.341 0.342 0.340
0.0041
LOD and LOQ: The limit of detection (LOD) is defined as the lowest concentration of an analyte that an analytical process can reliably differentiate from back-ground levels. In this study, LOD and LOQ were based on the standard deviation of the response and the slope of the corresponding curve using the following equations LOD=3s/m; LOQ=10s/m. Where s, the noise of estimate, is the standard deviation of the absorbance of the sample and m is the slope of the related calibration graphs. The limit of quantification (LOQ) is defined as the lowest concentration of the standard
curve that can be measured with an acceptable accuracy, precision, and variability. The values of LOD and LOQ were given in table – 1. Recovery study: Recovery of the analyte of interest from a given matrix can be used as a measure of the accuracy or the bias of the method. The same range of concentrations as employed in the linearity studies was used. Recovery studies was carried out on standard addition of 80%, 100% and 120% of labeled dose and the total amounts were determined by the method and the % recovery reports were shown in Table – 3.
Table 3 Recovery studies Pre determined concentration 9.9 µg/ml
Amount added
%recovery
%RSD
80% 100% 120%
102.44±0.0039 98.97±0.0134 99.86±0.0130
0.212 0.398 0.331
4. In vitro protein binding studies: The protein binding studies was performed on semi permeable membrane using sac content of 5 ml of drug solution (1 mg /ml) using 7.0 pH buffer as solvent acts as control. Another sac content of 5 ml of drug using (1 mg / ml) & 1 % protein solution as solvent acts as
test. The phosphate buffer pH 7.0 100ml was taken as simulated fluid. The samples were collected for every five minutes time interval and suitably diluted with same buffer for the measure of absorbance. The drug release kinetics was studied by plotting % Drug release Vs Time5 shown in Table – 4 and in Figure – 2.
This article can be downloaded from www.ijpbs.net
P - 568
Table 4 Results of protein binding study by the proposed method
S.No
Time(min)
%Drug release for Control
1 2 3 4 5 6 7 8 9
0 5 10 15 20 25 30 40 50
0 30.6 41.98 47.6 51.74 52.9 55.29 60.325 60.325
%Drug release for Test 0 19.20 23.3 25.414 31.6 36.6 39.91 43.16 43.16
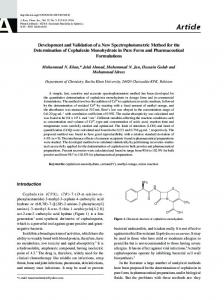
Figure- 2
Drug release kinetics of sulphamethoxazole
% Drug release
70 60 50 Drug
40 30
Drug+protein
20 10 0 0
20
40
60
Time(min)
RESULTS AND DISCUSSION The sulphamethoxazole shows λ max at 254.2 nm and the linearity plot yielded a R2 = 0.9999 over the Beers range of 1-5 µg/ml. The molar absorptivity (mol/lit) was found to be
1.72X10⁴ with Sandells sensitivity (µg/cm2/0.001) of 0.01468 revealed the strong UV absorbing species nature under the experimental condition. The results of protein binding study were shown about 50-60 % protein binding and it was good agreement with
This article can be downloaded from www.ijpbs.net
P - 569
reported pharmacokinetic data and drug release kinetics.
CONCLUSION
The proposed UV method was found to be simple, sensitive, selective, accurate, precise and economical and can be used in the determination of sulphamethoxazole in bulk sample in a routine manner.
REFERENCES 1.
2.
3.
Wilson & Gisvold’s, Text book of Organic Medical & Pharmaceutical chemistry, 11th edition, Lippincott Williams & wilkins publisher, 274. K D Tripati, Essentials of medical pharmacology, 6th edition, Jaypee brothers medical publishers (p) LTD, 683. W. O. Foye, Principles of Medicinal Chemistry, 3rd Edition, Lea and Febiger, Philadelphia (1998) 33.
4.
5.
D.M.Brahmankar, Sunil.B jaiswal, Biopharmaceutics & pharmacokinetics, vallabh prakashan publications, 91-96. A.Karunasree, Invitro protein binding study of Ciprofloxacin by new UVSpectrophotometric method, International journal of pharmaTech research, Vol.2,No.2,pp-1150-1154.
This article can be downloaded from www.ijpbs.net
P - 570