Aug 18, 2010 - Air quality monitoring networks are used in order to obtain objective, reliable ... optimization of the monitoring network a selection of the best ...
Optimization of the design of air quality monitoring networks and its application to NO2 and O3 in Seville, Spain
49
X3 Optimization of the design of air quality monitoring networks and its application to NO2 and O3 in Seville, Spain Antonio Lozanoa, José Userob , Eva Vanderlindenb, Juan Raeza, Juan Contrerasc, Benito Navarreteb and Hicham El Bakourib b Department
a The Environmental Management Company (EGMASA), Seville, Spain of Chemical and Environmental Engineering, University of Seville, Spain c Environmental Council of the Junta de Andalucía, Seville, Spain
1. Introduction Air quality monitoring networks are used in order to obtain objective, reliable and comparable information on the air quality of a specific area. This makes it possible to take the requisite measures to protect the environment, to assess the results of such actions and to ensure that the public is properly informed about the state of the air quality. The approval and publication of Council Directive 1996/62/EC (1996) on ambient air quality assessment and management and its daughter directives, 1999/30/EC (1999), 2000/69/EC (2000), 2002/3/EC (2002) and 2004/107/EC (2005), gave rise to an important change in air quality monitoring systems in Europe. Recently, in the interests of clarity, simplification and administrative efficiency, the above-mentioned European directives were replaced by the single Directive 2008/50/EC (2008) on ambient air quality and cleaner air for Europe with no change to existing air quality objectives for nitrogen dioxide (NO 2) and ozone (O3). With the aim of being as up-to-date as possible, references to the law will be made to Directive 2008/50/EC (2008). The present work describes a new method to design or optimize air quality networks, particularly to monitor nitrogen dioxide and ozone in compliance with the legislation. The proposed method consists of four steps for choosing the best locations for the monitoring stations: (1) preliminary evaluation; (2) sampling campaigns with passive diffusion samplers; (3) spatial interpolation; (4) selection of best locations for the monitoring stations. The first step in the optimization process is the preliminary evaluation of air quality based on historical data. This evaluation makes it possible to establish the minimum number and characteristics of the stations needed in each zone as set forth in Directive 2008/50/EC (2008). The location of the monitoring stations depends on the distribution of the contamination levels of pollutants, as the stations need to record representative levels for the entire zone. The second step of the method consists of sampling campaigns with a large number of diffusive samplers to determine the concentration of nitrogen dioxide and ozone in the
www.intechopen.com
50
Air Quality
studied area. In a diffusion sampler, the gas molecules are transported only by molecular diffusion, which is a function of air temperature and pressure. This independence allows the time-weighted average ambient concentration to be calculated using Fick’s laws of diffusion (UNEP, 2004). Diffusive sampling has been increasingly used for the assessment of environmental exposure to criteria pollutants, such as O3, NO2, SO2, NH3 and COV (Hangartner et al., 1989; Koutrakis et al., 1993; Liu et al., 1995; Krupa & Legge, 2000 and Thöni et al., 2003). The benefits of passive sampling devices include simplicity of sampling, low operating costs, high correlation results as compared to continuous monitors and deployment in areas where there is no electricity. A large number of units can be used simultaneously, gathering information on the spatial distribution of the pollutants. Diffusive sampling can be used if the average, instead of the real-time, and pollutant concentration is adequate for the purpose of monitoring (Krupa & Legge, 2000 and De Santis et al., 2003). To assign a contamination value to every point in the zone, spatial interpolations (step 3) of the information obtained in the sampling campaign are made by use of Geographical Information Systems (GIS), which are becoming increasingly popular to estimate the distribution of environmental phenomena (Spokas et al., 2000 and Duc et al., 2000). Also Directive 2008/50/EC (2008) states that modelling techniques should be applied where possible to enable point data to be interpreted in terms of geographical distribution of concentration. The result map obtained by GIS is used to define the best sites for placing the control stations of the air quality monitoring network. In this last step for the design or optimization of the monitoring network a selection of the best locations for the sampling stations is made, obtaining a spatial distribution that ensures compliance with the microand macroscale location criteria established in the legislation. Every few years, new sampling campaigns are carried out to verify the improvement of the optimized network and to make sure that the chosen locations for the stations are still representative of the air quality in the area. The method proposed in this article for optimization of the design of air quality monitoring networks and its application to NO2 and O3 was carried out in Seville, a city located in Andalucia, southern Spain. The area considered in this study is Seville city and the most densely populated part of its metropolitan area. Seville city has a population of 703 206 inhabitants, and covers a superficies of 140.8 km². Its metropolitan area is composed by 46 municipals and includes a population of About 1 500 000 inhabitants, occupying a superficies of 4900 km². Traffic is the most important source of air pollution in Seville, followed by households. The mining industry of Seville area is the principal source of SO2 pollution. The sunny climate in the study area favours the photochemical reactions that originate smog.
2. Materials and methods The method developed in this study consists of four steps that make it possible to choose the best locations for the stations of the monitoring network, in compliance with the legislation. Additionally, a fifth step is included for verification of the optimized monitoring network. 2.1. Preliminary evaluation This first step for optimising or designing an air monitoring network includes zonification, classification of the zones and determination of the minimum number of control stations needed.
www.intechopen.com
Optimization of the design of air quality monitoring networks and its application to NO2 and O3 in Seville, Spain
51
The zonification of the study area consists in subdividing the territory into different zones with similar air quality. The division is based on studies of topography, population, economic activities, weather, land use, situation of nature parks and emission into the atmosphere. A zone with a population in excess of 250 000 inhabitants is considered an agglomeration. The possible types of zones are city (agglomeration), industrial or rural area (Annex XV of Directive 2008/50/EC, 2008). Each zone is classified in terms of the level of recorded pollutants. The upper and lower assessment thresholds (UAT and LAT) for nitrogen dioxide (NO2) are determined in Annex II of Directive 2008/50/EC (2008) (Table 1). The zones are classified as follows: The level of the pollutant is higher than the UAT; The level is between the LAT and the UAT; The level is lower than the LAT. Hourly limit value for the protection of human health (NO2) Upper assessment threshold
70 % of limit value (140 μg/m3, not to be exceeded more than 18 times in any calendar year)
Lower assessment threshold
50 % of limit value (100 μg/m3, not to be exceeded more than 18 times in any calendar year)
Annual limit value for the protection of human health (NO2)
Annual critical level for the protection of vegetation and natural ecosystems (NOX)
80 % of limit value (32 μg/m3)
80 % of critical level (24 μg/m3)
65 % of limit value (26 μg/m3)
65 % of critical level (19.5 μg/m3)
Table 1. Upper and lower assessment thresholds for nitrogen dioxide and oxides of nitrogen as expressed in Annex II of Directive 2008/50/EC. The classification of each zone or agglomeration in relation to the assessment thresholds must be reviewed at least every five years. Classification must be reviewed earlier in the event of significant changes in activities relevant to ambient concentrations (Directive, 2008). The minimum number of sampling points for the fixed measurement of NO2 concentration in ambient air is given in annex V of Council Directive 2008/50/EC (2008) and depends on the classification of the zone. The minimum number of sampling points for fixed continuous measurements of ozone (O3) concentration to assess air quality for compliance with the target values, long-term objectives and information and alert thresholds where continuous measurement is the sole source of information is indicated in Annex IX of Directive 2008/50/EC (2008). Table 2 resumes the minimum number of sampling points needed for NO2 and O3.
www.intechopen.com
52
Population of agglomeration or zone (thousands)
Air Quality
NO2 Maximum Maximum concentrations concentrations between UAT exceed UAT and LAT
O3 agglomeration
Other zones (urban and suburban)
0-249
1
1
--
1
250-499
2
1
1
2
500-749
2
1
2
2
750-999
3
1
2
2
1000-1499
4
2
3
3
1500-1999
5
2
3
4
2000-2749
6
3
4
5
2750-3749
7
3
5
6
3750-4749
8
4
4750-5999
9
4
>6000
10
5
1 additional station per 2 million inhabitants
Table 2. Minimum number of sampling points (for fixed measurement) needed for NO2 and O3 depending on the classification of the zone 2.2. Sampling campaigns with passive diffusion samplers Once the evaluation requirements are known, the most appropriate sites for placement must be determined. Areas with high pollution levels but representative of the zone must be ascertained. In the proposed method, sampling campaigns with passive diffusion samplers are planned in order to determine the spatial distribution of the concentrations and to find the locations within each zone that have the best characteristics for continuous monitoring of air quality. For purposes of taking into account the influence of weather conditions on the contamination levels of nitrogen oxide, two sampling campaigns are carried out, one in winter and one in summer. As the formation of ozone is a photochemical reaction, a large difference in ozone concentrations could be expected between winter and summer, with higher ozone values in summer. Therefore, this pollutant is only measured during a summer campaign (Guicherit & Van Dop, 1977 and Beck et al., 1998). Each sampling campaign consisted of a series of biweekly sampling periods. The average of the periods determines the campaign value. The annual behaviour of the pollutants is estimated from the values of the winter and summer campaigns. In accordance with Annex I of Directive 2008/50/EC (2008), the indicative measurement of nitrogen dioxide needs a minimum time coverage of 14% which means one measurement a week at random, evenly distributed over the year, or eight weeks evenly distributed over the year. For ozone, the minimum time coverage for indicative measurements should be more than 10% during summer. To determine the best siting for the air quality monitoring stations in Seville, two NO2 campaigns were carried out, one in winter (December 1999-April 2000) and one in summer
www.intechopen.com
Optimization of the design of air quality monitoring networks and its application to NO2 and O3 in Seville, Spain
53
(June 2000-October 2000). Both campaigns included eight biweekly sampling periods. For O3, a summer campaign of 7 biweekly periods was carried out from June 2000 until September 2000. Different kind of passive samplers can be used to determine the studied pollutants. In this study, Ogawa badges were used. They consist of a cylindrical Teflon surface, whose approximate dimensions are 19 mm in external diameter and 30 mm in length. The cylinder is comprised of two chambers separated by a solid segment. The following components are placed in each chamber of the Ogawa tub, beginning at the innermost part: a solid pad, a pad-retaining ring, a stainless steel grid, a fibre-glass filter impregnated with the absorbent reagent, another grid of stainless steel and the diffuser cap at the outer end (Ogawa, 1998 and Ogawa, 2001). The diffusive sampling technique is based on the principle that the pollutant is absorbed into a specific sorbent at a rate controlled by molecular diffusion of the gaseous pollutant in the air. The theoretical rate at which the diffusive sampler collects the pollutant from the atmosphere is described by Fick’s first law of diffusion (Perkauskas & Mikelinskiene, 1998). The concentration C of the pollutant is given by C=m/(U·t), where m is the collected mass of pollutant, t is the averaging time and U is the uptake rate. For the adsorption of NO2, the filters are impregnated with triethanolamine (TEA) (Palmes et al., 1976 and Atkins et al., 1986). Many chemicals can be used in diffusive sampling badges for the determination of O3 concentrations, although studies have shown that sodium nitrite is a better one (Zhou & Smith, 1997). Nitrite impregnated filters were used in this work. Research has shown that when using passive samplers to determine ozone concentrations, measurements are not affected by temperature and humidity and, under ambient conditions, co-pollutant interference is negligible (Koutrakis et al., 1993). The passive diffusion samplers are placed in such a manner that the measurements represent the concentrations of their environment. Geographic Information Systems (GIS) are used to select the sampling sites. The siting criteria established in the legislation are implied in these systems to obtain those sites susceptible to get a diffusion sampler. Annexes III and VIII of Directive 2008/50/EC (2008) list the macroscale and microscale siting criteria to consider for sampling of NO2 and O3 respectively. To minimize the effect of wind, rain and direct solar radiation, the tubes were protected by rain shields. Different models are available, ceramic rain shields giving the best results in this study. This protection was attached to wooden blocks (5 cm), fastened to posts and placed between 1.5 and 2.5 m from the ground, using urban furniture. Duplicates (10% of the exposed tubes) were used to determine reproducibility, and field blanks (10% of the exposed tubes) were placed to determine the background reagent contamination and interference during the analytical process. Samplers were sent to and from the field in sealed plastic recipients. A large number of diffusive samplers were used in this study, taking advantage of low operating costs and ease of use. They were located at 139 sites, representing a total area of 1109.3 km², which makes the average radius of representativeness per sampler 1.59 km.
www.intechopen.com
54
Air Quality
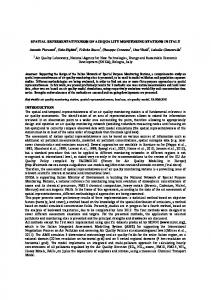
The municipals included in the study area are: Seville (53 sites), Alcalá de Guadaira, Dos Hermanas, La Rinconada, Coria del Río, Bormujos, Santiponce, La Algaba, Gelves, Mairena del Alcor, Mairena del Aljarafe, Camas, Carmona, Castilleja de Guzmán, Espartinas, Gines, Palomares del Río, La Puebla del Río, Salteras, Tomares, Utrera and Valencina de la Concepción. Figure 1 shows how the urban nucleus and the most populated part of the metropolitan area was covered by a large number of samplers.
Fig. 1. Location of the diffusive samplers in the Seville sampling campaign 2000 During the sampling period, the nitrogen dioxide was adsorbed and accumulated in the diffusion sampler as nitrite ion after reaction with triethanolamine (TEA), the adsorbent reagent (Palmes et al., 1976). After the sampling period, the captures were sent to the Andalusian Reference Laboratory for Air Quality Monitoring (LARCA), where the analyses were carried out. The analysis of this ion was performed with UV-spectrophotometry at 545 nm, using the Griess-Saltzmann method (UNEP/WHO, 1994). A Shimadzu spectrophotometer model UV-1203 with double beam and 1 cm cuvettes was used. The accuracy of the obtained results was confirmed using a t test. Experimental values of t were less than the critical value at 5% level which means that there were no significant differences between the obtained values. The technique used for the determination of ozone concentrations was based on the oxidation reaction of nitrite (NO2) with ozone O3 producing nitrate (NO3) (Koutrakis et al., 1993), followed by ion chromatography of the produced nitrate (Palmes et al., 1976). The analyses were also done at the Andalusian Reference Laboratory for Air Quality Monitoring
www.intechopen.com
Optimization of the design of air quality monitoring networks and its application to NO2 and O3 in Seville, Spain
55
(LARCA), using a Dionex DX 120 chromatograph with a conductivity detector, Ion-Pack AS9-HC anion separation column (4 x 250 mm), CS12A suppressor column and a graphic recorder connected by a PC to the chromatograph. The effluent used was Na2CO3 12 mM, loop: 100 μL. The accuracy of the obtained results was also less than 5%. 2.3. Spatial interpolations The concentration values obtained were spatially interpolated to assign a contamination value to every point of the studied area. The campaigns used for the determination of urban and suburban pollution were characterized by a large number of significantly concentrated sampling points, and therefore the Inverse Distance Weighted (IDW) method for spatial interpolation was used (Watson & Philip, 1985). This method is based on the assumption that the interpolating surface will be influenced most by the nearby points and less by the more distant points. The interpolating surface is a weighted average of the scatter points and the weight assigned to each scatter point diminishes as the distance from the interpolation point to the scatter point increases. The IDW interpolation does not need any kind of assumption about the distribution and behaviour of the measurements. The result of this method is exact at the sampling points and behaves smoothly without abrupt changes between the points of measurement (Burrough & McDonell, 1998). 2.4. Selection of the best locations The sampling points directed at the protection of human health shall be sited in such a way as to provide data on the areas within zones and agglomerations where the highest concentrations occur to which the population is likely to be directly or indirectly exposed for a period which is significant in relation to the averaging period of the limit value(s).The sampling points should also provide data on levels in other areas within the zones and agglomerations which are representative of the exposure of the general population. The control stations must be chosen according to the macro- and microscale siting requirements in Annexes III and VIII of Directive 2008/50/EC (2008) for the measurement of nitrogen dioxide and ozone, respectively. By macroscale siting requirements is meant that areas within a zone or agglomeration with the highest concentrations to which the population is likely to be exposed need to be covered by a monitoring station, thus avoiding measuring very small micro-environments. Urban background locations should be sited so that their pollution level is influenced by all sources upwind of the station. Insofar as practicable, some of the microscale siting criteria that should apply are following: the flow around the inlet sampling probe should be unrestricted without any obstructions affecting the airflow in the vicinity of the sampler; the inlet sampling point should be between 1.5 m and 4 m above the ground and away from the immediate vicinity of sources in order to avoid the direct intake of emissions unmixed with ambient air, etc. First, areas meeting the macrositing criteria are selected, using Geographical Information Systems (GIS). Then, microscale criteria are applied. 2.5. Validation of the relocation of the monitoring stations To verify the improvement of the optimized network, a new sampling campaign was carried out from May 2005 until May 2006 to make sure that the chosen locations for the
www.intechopen.com
56
Air Quality
stations were still representative of the air quality in the area. The method used was the same as the one described in sections 2.1 to 2.3. If it seems necessary to relocate some stations, the method described in section 2.4 should be used.
3. Results and discussion 3.1. Preliminary evaluation Before the optimization of the air quality assessment network, Seville city had six stations in the urban area and two in the suburban area to assess NO2 pollution. A comparison was made between the recorded historical values of NO2 between 1988 and 2000 and the assessment thresholds established in the applicable legislation, Directive 2008/50/EC (2008), which establishes 40 µg/m³ as annual limit value for NO2. 200 μg/m³, not to be exceeded more than 18 times a calendar year, is set as hourly limit value for NO2. The historical data were obtained from the eight fixed monitoring stations and three campaigns with mobile units. At seven locations the annual concentration value for NO2 exceeded the upper assessment threshold (80% of the limit value) and at one location the lower assessment threshold was exceeded (65% of the limit value). The upper assessment threshold for the hourly limit value (70% of limit value) was exceeded at six locations, and the lower assessment threshold (50% of limit value) at two locations. This, together with the number of inhabitants, makes a minimum of two monitoring station for NO2 necessary, as established in Annex V of Directive 2008/50/EC (2008), overtaken in Table 2. One station should be urban background and the other one traffic-orientated. Two stations for fixed measurement of ozone concentrations are necessary, as the population of the studied agglomeration is between 500 000 and 1 000 000 inhabitants (Table 2) (Annex IX of Directive 2008/50/EC, 2008). The same exercise was done for Alcalá de Guadaira, Dos Hermanas and Aljarafe region, the most populated areas of the metropolitan area (Table 3). nº of stations necessary
area
Superficies (km²)
NO2
O3
Existing stations before
Seville
141
703 206
2
2
8
7
Alcalá de Guadaira
285
70 155
1
1
2
1
Dos Hermanas
159
122 943
1
1
0
1
Aljarafe
1136
338 532
1
1
0
1
inhabitants
Existing stations after
Table 3. Number of assessment stations necessary and present before and after optimization of the quality network. Before the optimization of its air quality assessment network, Seville city had eight assessment stations, but it only needs two NO2 orientated and two O3 orientated assessment stations to comply legislation. In the target metropolitan area, Alcalá de Guadaira, Dos Hermanas and Aljarafe need each a NO2 and an O3 assessment station. Before adaptation of the assessment network, only Alcalá de Guadaira counted with air quality assessment stations. After optimization, one stations is located in each area, assessing both NO2 and O3.
www.intechopen.com
Optimization of the design of air quality monitoring networks and its application to NO2 and O3 in Seville, Spain
57
3.2. Sampling campaigns with passive diffusion samplers To determine the best siting for the stations of the air quality monitoring network in Seville, two sampling campaigns were carried out using passive diffusion samplers located at 139 sites, as indicated in Figure 1. The average NO2 concentration for Seville area in 2000 was 23.7 μg/m3, and 7.6 and 52.1 μg/m3 were the minimum and maximum values, respectively. This agrees with the measurement of NO2 in 363 cities of the United Kingdom (Campbell et al., 1994), which shows average concentration levels varying from 17.5 until 87.5 μg/m3. Moreover the obtained values for nitrogen dioxide in Seville vary considerably between summer and winter, with average values of 18.1 μg/m3 and 29.4 μg/m3 respectively. In winter they are higher because of the greater stability of the atmosphere in that season and because of NO2 involvement in the formation of ozone in summer. The same is observed in other cities in Europe (Perkauskas & Mikelinskiene, 1998 and Karppinen et al., 2000). The average ozone concentration for the summer campaign in 2000 was 71.6 μg/m3. The lowest average concentration recorded was 42.0 μg/m3, while the highest was 93.2 μg/m3. These concentrations are comparable with those measured by Klumpp et al. (2006) during summer 2001 at many sites in studies conducted in 11 European cities. 3.3. Spatial interpolations To get a better view of the distribution of pollutant concentrations, the obtained values were spatially interpolated using the Inverse Distance Weighted (IDW) method. Figure 2 shows the annual average for NO2 in Seville.
Fig. 2. The annual average concentrations for NO2 in Seville (2000)
www.intechopen.com
58
Air Quality
The city centre is characterized by concentration between 26 and 35 μg/m3. The maximum NO2 values were found in the new city centre, where they reached concentrations of more than 36 μg/m3. This is due to intense traffic circulation, which is the principal responsible for nitrogen dioxide emissions. Lowest values were found in the outskirts of the city, with the lowest concentrations in the northwest and southeast. A study in Vilnius (Perkauskas & Mikelinskiene, 1998) and another in Antwerp (Stranger et al., 2008) commented the same phenomenon; NO2 average rates depend strongly on traffic and are highest in crossroads and lowest at the background suburban layer. The dense populated municipals in the Aljarafe region present NO2 values between 21 and 30 μg/m3. Dos Hermanas is characterized by values between 21 and 25 μg/m3 while Alcalá de Guadaira presents values between 16 and 20 μg/m3 and some higher values in the western part of the community. The distribution of the ozone concentrations measured in the summer campaign can be seen in Figure 3.
Fig. 3. The average concentrations for O3 in the summer campaigns in Seville (2000) The highest levels are found in the suburban regions, situated at a certain distance from the area of maximum pollutant emissions. During the transport of NO2, principally emitted in the centre of the studied zone, reactions that generate ozone take place, obtaining the highest concentrations in the suburban regions. The samplers situated in the eastern and western part of the studied area recorded the highest concentrations (>61 μg/m3, locally >71
www.intechopen.com
Optimization of the design of air quality monitoring networks and its application to NO2 and O3 in Seville, Spain
59
μg/m3), while the city centre of Seville showed lower ozone concentrations (