Dimensioning of Packet Networks based on Data-Driven Traffic Profile Modeling Mateusz Szukowski
Henryk Maciejewski
Michael Koonert
Bartlomiej Chowanski
Nokia Siemens Networks Institute of Computer Engineering, Nokia Siemens Networks Nokia Siemens Networks Network Engineering Control and Robotics, Network Engineering Network Engineering Wroclaw, Poland Wroclaw University of Technology, Wroclaw, Poland Wroclaw, Poland
[email protected] Wybrzeze Wyspianskiego 27,
[email protected] [email protected] 50-370 Wroclaw, Poland
[email protected]
Abstract—This work addresses the problem of infrastructure dimensioning for packet switched (PS) services in mobile access networks. We propose a novel approach to more realistic estimation of offered traffic for the PS services based on models of traffic profiles developed based on real network measurements, i.e. performance monitoring data. The traffic profiles are discovered using clustering methods and then described with mathematical models. We demonstrate how accurately the offered traffic can be approximated using the profiles discovered the numerical examples are based on typical European, African, and Asian telecom operators. The approach proposed can be used not only in more accurate dimensioning of the PS infrastructure but also for optimization of power saving policies. Index Terms—busy hour, HSDPA, network dimensioning, mobile access network, performance monitoring, traffic modeling, Iub
I. I NTRODUCTION Rapid market growth of mobile packet services caused new challenges for dimensioning of mobile access networks. The challenge analyzed in this work is related to possible over dimensioning of the aggregated offered traffic in the radio network controller (RNC) for high-speed downlink packet access (HSDPA) service. Offered traffic usually defined as the mean throughput during busy hour (BH) is the key part of the traffic model used in dimensioning methods like M/G/RPS [1] to estimate the final traffic demand. Inaccuracy in the model can cause significant under or over dimensioning of the offered traffic [2]. Evolution of HSDPA service especially with regard to increasing offered air interface data rates opened doors for new markets for mobile networks, previously reserved for fixed broadband operators. Currently, the share of the HSDPA service (general PS) in total traffic in mobile networks ranges even up to 99% as shown in table I for exemplary operators from typical Asian, African and European regions: This growing trend is visible in all investigated operators. It means that in future the importance of proper circuit switched (CS) dimensioning decreases and dominantly PS should be taken into account especially for interface dimensioning. Additionally, comparing current offered traffic per subscriber from
TABLE I D ISTRIBUTION OF TRAFFIC SHARE BETWEEN MOBILE SERVICES ON I UB
Operator 1 2 3 4
Voice (AMR 12.2) 0.05% 0.20% 0.004% 0.05%
PS (rel.99) 0.18% 0.48% 0.02% 0.01%
HSDPA 99.77% 99.32% 99.98% 99.95%
Total Volume [GB] 2.68E+13 1.61E+14 2.49E+14 5.95E+14
sample operators (2-10kbps) with fixed broadband operators (50-100kbps) leads to the conclusion that currently available resources in mobile networks will be challenged to handle the growth in data rate demand. This leads operators to introduce upper limitations for subscribers such as 2GB per month. The dimensioning perspective starts to have its reflection in traffic models definition. Previously, offered traffic was defined as volume or throughput per subscriber in BH, now more and more often the traffic model is defined as transferred volume per subscriber per week or month. The difference may seem irrelevant, as under the standard assumption that during BH 1/10 of daily traffic is to be transferred, the same traffic model is obtained. However, the change in traffic model definition is caused by two main issues. First, the source of the data changes: previously data was derived from performance monitoring (PM) data during BH (e.g., from RNC), and now data is derived from accounting systems (e.g., volume over one month). The second point is that in this new traffic model there is no information when the BH happens for a particular type of subscribers. This change in the traffic model definition adopted more and more often by operators calls for a new approach to estimation of the offered traffic for various subscriber types or areas at the RNC level. This work concentrates on dimensioning of mobile access networks, and specifically on dimensioning of the RNC and IuB interface. The same problem can be expected for other network parts as well as for other network technologies e.g. LTE. In this paper, we propose a new approach to estimating aggregated traffic on RNC level based on the new traffic model
definition recently also getting into use at operators. We start with an analysis of HSDPA traffic in the context of offered traffic parameters; we concentrate on dispersion of the BH between different cells on the IuB interface. By comparing BH dispersion between CS and HSDPA for exemplary real projects data, the scale of potential over dimensioning will be estimated. Next, a measure of the BH dispersion denoted Load Distribution Factor (LDF) is defined. The measure can be used as an indicator whether for a particular project the new approach to interface dimensioning is necessary, or the standard approach is satisfactory. In chapter II we present the new approach in detail. We discuss the two elements required: first is to derive appropriate traffic profiles pertaining to particular groups of cells, and second is to identify the groups of cells discovered. Finally, we analyze the quality of the approach and the accuracy of the model. II. A NALYSIS
OF
BH
DISTRIBUTION ON I U B INTERFACE
The LDF is defined as: LDF =
Pn
max{CellV oli (h0), .., CellV oli (h23)} 1P Pn n 1 CellV oli (h23)} 1 CellV oli (h0), ..,
max{
(1) LDF approaches value 1 only if BHs of all cells are approximately equal, e.g., all cells have BH at 8pm. Otherwise, LDF will exceed 1. Additionally, assuming constant BH dispersion LDF can differ. Its value depends also on the characteristic of 24 hour-long load distributions. If the distribution is close to constant then even of significant BH dispersion, LDF will be close to 1. This property can be directly interpreted in the context of network dimensioning. If interfaces are loaded approximately constantly within 24 hours then BH dispersion between these interfaces would not introduce significant inaccuracy in estimation of summarized load in an aggregation point.
Due to the recent market change, it can be observed that in traffic model provided by operators, the offered traffic parameters more and more often are not correlated any more with a BH. In this chapter we are going to present an analysis of the BH distribution for HSDPA service and highlight the impact of this distribution on network dimensioning. Data source used for this analysis is based on performance monitoring (PM) data for HSDPA service as well as for CS service (voice only, based on AMR 12.2 codec). The PM data include measures for a period of at least two weeks gathered in year 2010 from several real-live projects. The counter selected for the analysis indicates the transferred volume on IuB interface in hourly manner. Each measurement is labeled with the RNC, NodeB and Cell identifiers which allows for analysis on the cell level.
B. LDF for PS and CS services
A. Definition of BH Dispersion Factor in load distribution (LDF)
Based on these results calculated on the project level, the following conclusions can be drawn: • The dispersion of BHs on IuB inteface for CS services is generally much lower than in case of PS services. • The scale of potential over-dimensioning for CS services is rather too small to call for optimization, hence, single BH approach for CS services is justified and confirmed for all projects. • The scale of potential over-dimensioning for PS services is generally higher and the single BH approach should not be applied
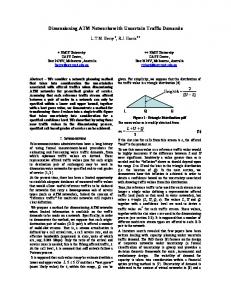
The LDF measure has been introduced to mathematically describe the impact of BH dispersion between different cells on potential over-dimensioning of the network. In case of the analyzed counter (volume transferred in one hour per cell), it can be interpreted as possible overestimation of the offered traffic parameter. Physical interpretation is presented in Fig. 1 where B represents real load on an RNC and A presents the value of load if single BH approach is assumed for the HSDPA service. In Fig. 1 LDF equals A/B.
The goal of the LDF is to indicate a potential overestimation problem if a single BH is assumed per service. Based on several analyzed projects, in the following tables we present LDF calculated on the project level (table II) and on the RNC level (table III and IV). TABLE II LDF FOR PS AND CS CALCULATED ON THE PROJECT LEVEL FOR VARIOUS NETWORK OPERATORS
Operator 1 2 3 4
LDF for CS 1.268 1.432 1.444 1.406
LDF for PS 4.939 3.035 2.465 2.520
TABLE III LDF FOR PS CS CALCULATED ON THE RNC LEVEL
RNC 1 2 3 4 5 Fig. 1.
Graphical representation of LDF
LDF for PS PR1 PR2 PR3 5.439 2.968 2.335 2.424 2.102 2.268 3.738 2.462 2.145 2.650 2.198 1.488 4.273 1.971 1.709
PR4 2.376 1.599 1.287 1.294 1.188
TABLE IV LDF FOR CS
RNC 1 2 3 4 5
CALCULATED ON THE
•
RNC LEVEL
LDF for CS PR1 PR2 PR3 1.152 1.462 1.556 1.113 1.499 1.170 1.093 1.399 1.361 1.121 1.354 1.147 1.126 1.091 1.178
PR4 1.582 1.439 1.584 1.351 1.220
•
•
The LDF results calculated on the RNC level and presented in tables III - IV justify the following conclusions: • LDF for the CS services is approximately constant on all RNCs, and this behavior can be observed in all projects. • LDF for PS services calculated on RNC level seems to be subject to substantial variation comparing to LDF calculated on the project level. Summarizing, based on the LDF results for CS services we can observe that the value of LDF is rather low and almost constant for all RNCs in all projects. This leads to the conclusion that the single BH approach for CS services on IuB interface is justified. LDF results presented for PS services are different. The first observation is that LDF is generally higher and it varies significantly among different RNCs. It means that any improvement aimed to avoid overestimation of the offered traffic should consider the scale and its variation among RNCs. Additional research meanwhile performed on a wider spectrum of projects confirms this conclusion about high value of LDF for PS traffic, with very few cases where LDF for PS is low. These low LDF cases for PS traffic are currently under further analysis. C. Basic statistical analysis of PS and CS traffic The LDF describes dispersion of highest load among cells in 24 hours. We observe that load in a fixed hour varies significantly among cells. Here we provide hourly summaries of the load with the main goal to detect outliers. The heuristic simply bases on comparison of the mean and standard deviation (Diff=mean-std). First results demonstrated that in case of PS this outlying definition would remove all observations indicating very non-homogenous load distribution across the network. Table V presents the statistics per single IuB during BH for PS and CS in analyzed projects: TABLE V BASIC STATISTICS OF TRAFFIC ON CELL LEVEL FOR ANALYZED PROJECTS
Operator 1 2 3 4
mean 52096 57563 56111 65552
PS [kB] std 72235 86202 74070 96381
diff -1387 -6393 -79595 -8284
mean 3359 7605 1047 1193
CS [kB] std 5175 7137 7914 8358
diff 242 333 401 403
From statistical analysis of traffic shown in this section, we get the following conclusions:
for CS traffic we observed (table V) for all projects relatively small dispersion of hourly load between cells (the Diff parameter is always positive), for PS traffic dispersion of load during BH between cell is high (the Diff parameter is always negative), the simple analysis indicates significant differences between load distribution across the network in BH, even that PS traffic share is higher than for CS, the load distribution across the network is much more non-homogenous (Fig. 2).
D. Summary of analysis of BH distribution on IUB summary The key conclusion from the analysis of load characteristics of PS cells is that dispersion of BH for these cells is high. Also diversity of hourly load for these cells is significant. The high dispersion of BH leads to overestimation of offered traffic if a single BH for PS is assumed. The diversity of load indicates very non-homogeneous PS traffic across the network. From the dimensioning perspective this means that minimizing the BH dispersion should be the main goal of the new approach. The non-homogeneous load across the network is yet another characteristic, which to address is however out of scope of this work. III. N EW
APPROACH TO ESTIMATION OF THE OFFERED TRAFFIC
A. Summary to the need for improvement of the estimation of the offered traffic for HSDPA service Investigating the problem of appropriate estimation of the offered traffic for HSDPA service, two main points should be raised. The first point is the change in the traffic model definition explained in the introduction. It results in a certain information loss about the BHs for parameters of the offered traffic (e.g., per particular subscriber type) provided in the traffic model. Previously, offered traffic was always provided per BH. The second point is triggered by the analysis on performance monitoring data done to measure potential effects of this change in traffic model definition. Based on analysis of sample real-live projects, it has been presented that dispersion in distribution of BH among HSDPA cells as compared to CS service cells (Voice AMR 12.2) can be very high. The dispersion can lead to potential over-dimensioning of IuB interface if single BH for HSDPA service is assumed (which can be safely assumed for CS traffic). The conclusion is that, taking into account the change in traffic model definition and large dispersion of BH between cells, a single BH approach for HSDPA service brings a high risk of significant over-dimensioning on IuB interface. B. The main idea of the new approach The proposed new approach is based on the idea to split the overall cells within an RNC into smaller groups meeting two requirements. The first requirement is that traffic profiles of individual cells within one group should be similar, and the second requirement is that these traffic profiles can be interpreted i.e., mapped onto known user groups. Then the
offered traffic can be provided indirectly by specifying these user groups and their profiles rather than directly by volume in the traffic model. A traffic profile has been defined as daily 24 hour load distribution of offered traffic e.g., per group of cells. These known traffic profiles can be summarized to get the complete load from all the groups and get the final traffic profile on the RNC level. Based on the final traffic profile it will be possible to estimate the BH and the corresponding final offered traffic parameter. The similarity requirement between traffic profiles of cells in the same group will result in minimizing the dispersion of BHs inside the group. Hence, it will decrease the risk related to overestimation of offered traffic provided for such group. In most cases, for HSDPA service (or for PS in general) it is impossible to use directly the groups defined in the traffic model and avoid the risk of over-dimensioning. The reason is that BHs as well as traffic profiles for these groups are not known and there is no way to summarize total offered traffic in the BH. Additionally, there is no direct relation between performance monitoring data and accounting data. PM data, providing detailed information about load characteristics for the interface was previously used to derive traffic model parameters during BH. Accounting data (which is the base for new traffic model definition) provides information about service usage per subscriber or group of subscribers. This means that deriving required information for such groups is extremely difficult and in many cases impossible.n most cases, for HSDPA service (or for PS in general) it is impossible to use directly the groups defined in the traffic model and avoid the risk of over-dimensioning. The reason is that BHs as well as traffic profiles for these groups are not known and there is no way to summarize total offered traffic in the BH. Additionally, there is no direct relation between performance monitoring data and accounting data. PM data, providing detailed information about load characteristics for the interface was previously used to derive traffic model parameters during BH, Accounting data (which is the base for new traffic model definition) provides information about service usage per subscriber or group of subscribers. This means that deriving required information for such groups is extremely difficult and in many cases impossible. To realize requirements of the new approach, two implementation steps have been proposed. The first step is to derive from HSDPA performance monitoring data 24 hour traffic profiles binding similar cells into groups. The second step is the identification process of the derived traffic profiles i.e., mapping them onto traffic model parameters. C. Step 1: Analysis of traffic profiles in PM data The goal of the first step is to identify cells with similar traffic profiles what would minimize dispersion of BH. This step can be realized with clustering techniques used to analyze a database with 24 hour load characteristics of cells. The proper application of clustering algorithms comes with several difficulties. The first is verification of the quality of
clusters obtained. As opposed to predictive modeling, clustering methods lack any direct steps to give robust verification of quality of the results. For this reason, as a measure of quality of clustering, an independent measure has been defined based on dispersion of BH within a cluster. The LDF measure defined in the second chapter will be used as the measure of quality of clustering results. LDF will be analyzed on various levels, such as the project level, or RNC level. We will favor the clustering results which bring highest improvement of LDF on the project level, defined as: (LDF − LDFCLUS ) ∗ 100% LDF The LDFCLUS has been defined as: X LDFCLUS = wi ∗ LDFCi LDFIMP =
(2)
(3)
i=l..m
where is the LDFCi is measured between cells inside the cluster Ci and weight wi represents the share of volume comprised in cluster Ci with respect to total traffic. The other key element in clustering is the definition of distance between points (vectors) clustered. In this definition we include the proper interpretation of similarity between cells. The Euclidan distance will not work properly, as cells would be grouped by the level of load rather than by characteristic load profiles. For this reason, correlation distance has been proposed and defined as: 1 − corr(v1, v2) (4) 2 The step #1 has been verified on a couple of projects and presented in [3]. As a result, it has been observed that the final dispersion of BH between cells can be significantly lowered. The results have been analyzed on various levels, starting from the project level, later on RNC level and finally on the level of clusters within particular RNCs. In all these cases improvement (2) was visible. Based on the results, the conclusion is that the proposed implementation realizes the goal of step #1 and creates proper foundation for further analysis, i.e., for step #2 identification of the clusters and traffic profiles. dist =
D. Step 2: Identification of traffic profiles The goal of this step is to define a process that will identify discovered traffic profiles. The identification shall result in a mapping algorithm connecting information from the traffic model based on operator data with 24 hour load characteristics discovered from performance monitoring data. The concept to implement this is based on application of predictive modeling / feature selection methods to identify the most important features that account for the membership of given cells in a particular cluster. Next these features will be mapped onto feature characteristics of groups of users defined in the traffic model. Currently this step is partly still under investigation. First results based on sample features such as mean holding time,
number of connection or area type result in a prediction with around 75% quality. Final results of this step will be published separately as continuation of this work. E. Summary of the new approach Based on results from the first step, the concept seems to be a proper way to significantly improve estimation of the offered traffic. With the second step still partly under research, the results from this preliminary analysis provide already very useful information for dimensioning of mobile access network. Most important elements are the differences between load characteristic of CS vs. PS services (presented in second chapter) and the method to decrease dispersion in BH distribution (presented as step #1 and introduced in detail in [3]). Additionally, the LDF measure can be a quantitative indication of the scale of potential over-dimensioning of the interfaces. This can be used to identify projects where standard single BH approach is still justified. Thus our work also offers a decision support tool for the planner of mobile networks to help him/her assess the risk of overdimensioning. Based on results from the first step, the concept seems to be a proper way to significantly improve estimation of the offered traffic. With the second step still partly under research, the results from this preliminary analysis provide already very useful information for dimensioning of mobile access network. Most important elements are the differences between load characteristic of CS vs. PS services (presented in second chapter) and the method to decrease dispersion in BH distribution (presented as step #1 and introduced in detail in [3]). Additionally, the LDF measure can be a quantitative indication of the scale of potential over-dimensioning of the interfaces. This can be used to identify projects where standard single BH approach is still justified. Thus our work also offers a decision support tool for the planner of mobile networks to help him/her assess the the risk of overdimensioning. IV. ACCURACY
OF NEW APPROACH
As pointed out before, our new approach to network dimensioning consists of two stages: traffic profiling (step #1) and mapping of the traffic profiles onto traffic model parameters as gathered from network operators (step #2, referred to as the identification step). Obviously in order to get the final estimate of accuracy of the new method in terms of improvement potential in dimensioning, both stages will have to be realized. In this section we provide first results on the accuracy of the traffic profile models. We show how accurately we can approximate the traffic observed with the traffic profiles developed in step #1. In [3] we presented sample preliminary results on this but we focused on a single day analysis. In this work we always calculated the traffic profiles based on longer time periods (min. two weeks) to avoid short term load specific artifacts, but we then checked the models against a fixed single day. Here we present how accuracy varies between single days and longer time perspective. The goal is to verify whether the error is
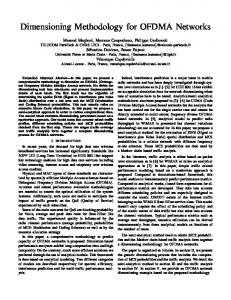
unchanged or maybe some additional significant fluctuations should be considered in time perspective. The accuracy of the model is measured on RNC level and defined as difference between modeled [Fig. 3] and real traffic.[Fig. 2]
Fig. 2.
Fig. 3.
Real traffic load of RNCs over 24 hours
Modeled traffic load of RNCs over 24 hours
The following measure has been introduced to calculate accuracy of the profile based model of traffic, P |RTh − M Th | Error = Phour=0..23 (5) hour=0..23 RTh ∗ 100% where RTh is the real load and M Th is the model-based load at hour h. It can be calculated either over 24 hours or over i.e. 8 hours (16-23) where highest load is to be expected as observed on RNC load characteristic [Fig. 2] The following table presents results on the RNC level as to how accuracy changes in time perspective for a sample week. The model has been calculated over 2 weeks according to the algorithm presented in [3] taking into account only working days and next it was applied for subsequent days. Based on the analyzed projects following conclusions can be drawn according to the time perspective: • high variation of the LDF only leads to approximately constant error even in time perspective • inaccuracy per RNC is quite low, about 10% - good base for further evaluation in step #2
TABLE VI A NALYSIS OF ACCURACY OF MODEL CALCULATED OVER 24 HOURS
Weekday FRI SAT SUN MON TUE THU
RNC1 9.07 18.72 13.36 9.17 9.77 11.97
RNC2 23.01 25.66 18.3 6.97 6.76 7.18
RNC3 10.28 25.65 20.11 9.95 7.99 17.58
RNC4 6.4 24.91 20.35 9.76 11.93 8.41
RNC5 16.4 19.39 15.92 17.11 11.57 13.33
TABLE VII A NALYSIS OF ACCURACY OF MODEL CALCULATED OVER HIGH LOAD HOURS
Weekday FRI SAT SUN MON WEN THU
RNC1 9.98 13.13 11.9 9.16 8.26 5.88
RNC2 13.67 15.17 9.61 4.8 3.24 6.24
RNC3 7.69 15.28 13.09 6.87 7.19 4.87
RNC4 5.17 15.17 10.02 4.35 8.2 8.05
RNC5 11.12 12.47 6.57 7.99 7.26 7.77
higher error observed mainly in weekend days, but to be expected because model based on working days. Finally, it can be expected that if the step #2 research (i.e., mapping the traffic profiles onto parameters derived from operators traffic models) does not contribute additional error to the model, then the level of accuracy demonstrated in this section gives a fair estimate of how accurately we will estimate expected traffic for network dimensioning. Hence our new approach is supposed to significantly reduce the risk of network over-dimensioning. •
V. C ONCLUSIONS In this work we have addressed the problem of proper infrastructure dimensioning for packet switched services in mobile access networks. We proposed a novel approach to realistic traffic estimation with profile models based on real network measurements, i.e. performance monitoring data. The traffic profiles have been derived using clustering methods resulting in mathematical models. A quantitative methodology for risk assessment of miss-dimensioning has been presented. We investigated the accuracy of the derived models and showed that the approach can be used for appropriate dimensioning of the PS infrastructure. Further research might look also into the potential of this approach in terms of optimization of total network power consumption. R EFERENCES [1] A. Riedl, T. Bauschert, M. Perske, A. Probst. Investigation of the M/G/R Processor Sharing Model for Dimensioning of IP Access Networks with Elastic Traffic. First Polish-German Teletraffic Symposium PGTS 2000. [2] Kin K. Leung, William A. Massey, Ward Whitt, Traffic models for wireless communication networks, IEEE Journal on Selected Areas in Communications, vol.12, no.8, October 1994. [3] H. Maciejewski, M.Sztukowski, B.Chowanski, Traffic Profiling in Mobile Networks Using Machine Learning Techniques, The 6th International Conference on Hybrid Artificial Intelligence Systems, Wroclaw, Poland, May 2011.
[4] X. Li, W. Bigos, C. Goerg, A. Timm-Giel and A. Klug. Dimensioning of the IP-based UMTS Radio Access Network with DiffServ QoS Support, in Proc. the 19th ITC Specialist Seminar on Network Usage and Traffic (ITC SS 19), at Technische Universitt Berlin, October, 2008 [5] J. Han, M. Kamber, Data Mining: Concepts and Techniques, Second Edition [6] A. McGregor et al.: Flow Clustering Using Machine Learning Techniques. Lecture Notes in Computer Science, 2004, Volume 3015/2004, 205-214 [7] 3GPP TS 25.401, Technical Specification Group Radio Access Network: UTRAN Overall Description