International Journal of Machine Tools & Manufacture 39 (1999) 1935–1944
Discrete wavelet transform for tool breakage monitoring Xiaoli Li*, Shen Dong, Zhejun Yuan Department of Mechanical Engineering, Harbin Institute of Technology, Harbin 150001, PR China Received 1 September 1998; received in revised form 1 February 1999
Abstract Detection of tool breakage is of vital importance in automated manufacturing. Various methods have been attempted, and it is considered that the use of discrete wavelet transform (DWT), which is much more efficient and just as accurate wavelet analysis, may provide a realistic solution to the detection of tool breakage in operation. The DWT uses an analyzing wavelet function which is localized in both time and frequency to detect a small change in the input signals. In addition, it requires less computation than Fast Fourier Transformation (FFT). This paper discusses a tool breakage monitoring system based on DWT of an acoustic emission (AE) and an electric feed current signal using an effective algorithm. The experiment results show overall 98.5% reliability and the good real-time monitoring capability of the proposed methodology for detecting tool breakage during drilling. 1999 Elsevier Science Ltd. All rights reserved. Keywords: Discrete wavelet transform; Tool breakage; AE; Electric feed current; Drilling
1. Introduction In recent years, one of the most important developments has been the trend towards cost savings in an automated manufacturing environment, this can be achieved through product quality improvement and production time reduction. The reliability and applicability of tool breakage detection to assist in advancing high availability levels of sophisticated manufacturing systems, in conjunction with high quality levels of manufactured components, are considered in this paper. From an automation point of view, it is necessary to design a sensing system to detect the progress of tool breakage during the cutting operation so that the tool failure can be identified
* Corresponding author. Present address: Department of Manufacturing Engineering, City University of Hong Kong, Hong Kong. E-mail:
[email protected] 0890-6955/99/$ - see front matter 1999 Elsevier Science Ltd. All rights reserved. PII: S 0 8 9 0 - 6 9 5 5 ( 9 9 ) 0 0 0 2 1 - 8
1936
X. Li et al. / International Journal of Machine Tools & Manufacture 39 (1999) 1935–1944
and tools can be replaced in time. A fair amount of research has been devoted to the detection of tool failure which includes the use of optical, force, torque, power, electric current, etc. [1]. The most common signals used in the industrial machining environment are force, AE and electric current [2]. Force-measurement is a good method for detecting tool breakage. However, the main disadvantage is that each tool needs to be fitted with a sensor system, which makes this method very expensive. In addition, the installation of a force-measuring sensor system is difficult or impossible for some tools. In recent years, AE sensors designed for detecting tool breakage have been successful. The major advantage of using AE to monitor tool condition is that the frequency range of the AE signal is much higher than machine vibrations and environmental noises [3–6]. Sensors used to measure electric feed current represent the simplest method and are also very simple to retrofit. In order to improve robustness of tool breakage monitoring system, this paper presents realtime tool breakage detection by the fusion of the outputs on an AE sensor and the electric feed current sensors. The spectral analysis method is the most commonly used signal processing technique in tool breakage detection. But spectral analysis has a good resolution only in the frequency domain but a very bad resolution in the time domain. Also some signal information in time domain is lost in the spectral analysis process. DWT method proposed is a significant new tool in signal analysis and processing [7,8]. It has been used to analyze tool breakage monitoring signals [9,10]. DWT has a good solution simultaneously in both frequency and time domains so that it can extract more information in the time domain at different frequency bands [11]. This paper presents a DWT application for real-time tool breakage monitoring in drilling. The AE signal and electric feed current signal are analyzed using DWT. A simple algorithm used for signal processing can be used to determine the tool conditions from the DWT coefficient of the AE signal and electric feed current signal. The paper is structured as follows: the DWT survey is reviewed in Section 2; the tool breakage monitoring algorithm is presented in Section 3; the experimental set up, signal processing and results are described in Section 4; and a conclusion is given in Section 5.
2. Discrete wavelet transform We define a square integral function (t) (namely (t) 苸 L2(t)) as a family of functions, which satisfies the following equation:
冕 ⬁
|ˆ (w)|2 dw ⬍ ⬁ |w|
(1)
⫺⬁
Assuming:
a,b(t) ⫽
冉 冊
1 t⫺b , a,b 苸 R,a⫽0 √|a| a
(2)
a,b(t) is defined as a continuous wavelet, which is derived from a family function (t), a and b
X. Li et al. / International Journal of Machine Tools & Manufacture 39 (1999) 1935–1944
1937
are the dilation and translation parameters, respectively. a, b represent the family of wavelets obtained from the single function by dilations and translations. The change of parameter a would not only influence the frequency spectrum structure of the continuous wavelet but also the window size and the form. Define a continuous wavelet transform as follows:
冕 冉 冊 ⬁
wf(a,b) ⫽ ⬍ f,a,b
1 >⫽ √|a|
f(t)
t⫺b dt a
(3)
⫺⬁
Define discrete wavelet transform as follows:
冕 ⬁
cj,k ⫽
f(t)j,k(t)dt, j,k 苸 Z
(4)
⫺⬁
where
j,k(t) ⫽
冉
冊
1 t ⫺ 2j k √2j 2j
(5)
The wavelet coefficient cj,k is taken as the time-frequency map of the original signal f(t). In terms of the relationship between the wavelet function (t) and the scaling function (t), namely:
冘 ⬁
|ˆ (w)|2 ⫽
|ˆ (2j w)|
(6)
j⫽⫺⬁
the discrete scaling function with corresponds to the discrete wavelet function is as follows:
j,k(t) ⫽
冉
冊
1 t ⫺ 2j k √2j 2j
(7)
It is used to discrete the signal, the sampled values are called scaling coefficients dj,k
冕 ⬁
dj,k ⫽
f(t)j,k(t)dt
(8)
⫺⬁
When j > 1, the scaling coefficients and the wavelet coefficients are written as follows:
冘 冘 ⬁
dj ⫹ 1,k ⫽
h(i ⫺ 2k)dj,k
(9)
g(i ⫺ 2k)dj,k
(10)
⫺⬁ ⬁
cj ⫹ 1,k ⫽
⫺⬁
1938
X. Li et al. / International Journal of Machine Tools & Manufacture 39 (1999) 1935–1944
where the terms g and h are high-pass and low-pass filters derived from the (t) and (t), the coefficients dj+1,k and cj+1,k represent a decomposition of the (j ⫺ 1)st scaling coefficient into high and low frequency terms. This paper employs the simple orthogonal Harr wavelet basic: h [] ⫽ [0.125, 0.375, 0.375, 0.125]; g [] ⫽ [ ⫺ 2.0, 2.0]
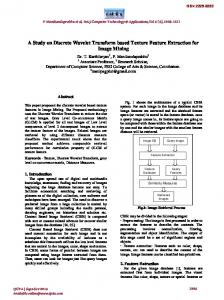
3. Tool breakage detection algorithm Acoustic emission (AE) is generated during metal cutting processes. However, there is a distinct difference between the amplitudes of AE signals at tool breakage and during normal machining. Therefore AE signals can be used to detect tool breakage by experimentally setting the AE signal threshold. At the same time the electric feed current changes are generated at tool breakage. AE and electric feed current signals are used to detect tool breakage using the wavelet transform. Fig. 1 shows the structure of tool breakage detection algorithm. 3.1. DWT of the signal W1[i], W2[i] and W3[i] are AE[i] signal wavelet coefficients for j ⫽ 2, j ⫽ 3 and j ⫽ 4, respectively. Those can be considered as the components of the frequency bands [500 苲 250], [250 苲
Fig. 1.
Tool breakage detection algorithm.
X. Li et al. / International Journal of Machine Tools & Manufacture 39 (1999) 1935–1944
1939
125] and [125 苲 62.5] KHz, respectively. W4[i] and W5[i] are I[i] signal wavelet coefficients for j ⫽ 1 and j ⫽ 2, respectively. Those can also be considered as the components of the frequency bands [1000 苲 500], and [500 苲 250] Hz, respectively. 3.2. Envelop detection and second difference The envelope detection method was used to deal with the W1[i], W2[i] and W3[i] series. W1— max[i], W2—max[i] and W3—max[i] envelope detection values were found to determine if AE[i] was from tool breakage or other unexpected noise. The algorithm calculates the second difference of W4[i] and W5[i], W4—max[i] is calculated as follows: dp[i] ⫽ (W4[i]W4[i ⫺ 1])2 W4
max
[i] ⫽ (dp[i]dp[i ⫺ 1])2
(11)
The same method is used for calculating W5—max[i]. 3.3. Tool breakage detection In order to sense the sudden change of Wj—max[i], the tolerance band of Wj—max[i] must be established. Upper Hj[i] and lower Lj[i] limits of the tolerance are calculated as follows: hj [i] ⫽ Wj
max
[i1](1 ⫹ 1/2n)
Lj [i] ⫽ Wj
max
[i1](1 ⫹ 1/2n)
(12)
where n is defined as 3 苲 8 determined through experiments. If the value of Wj—max[i] remained outside the limits, the tool is detected as breakage condition. 4. Experiment and results 4.1. Experimental set-up The schematic diagram of the experimental set-up is shown in Fig. 2. Cutting tests were performed on a Machining Center Makino-FNC74-A20. In the experiments, a commercial piezoelectric
Fig. 2.
Schematic diagram of the experimental set-up.
1940
X. Li et al. / International Journal of Machine Tools & Manufacture 39 (1999) 1935–1944
AE transducer was mounted on the spindle. AE signals were transferred by magnetic fluid between the spindle and the tool. During the experiments, the AE signal and the three electric feed current signals corresponding to the x, y and z axis feed electric current (Ix, Iy, Iz) were monitored, the monitored AE signals were amplified. The electric feed current signals were first passed though low-pass filters (cut off frequency: 100 Hz), and were then sent via an A/D converter to a personal computer. A successful tool breakage detecting method must be sensitive to tool change in tool condition, and insensitive to variations of cutting conditions. Hence, the cutting tests were conducted at Table 1 Experimental conditions Tool
Cutting conditions
Workpiece
HSS-drill Diameter 1, 2, 3, 4.6, 5.6, 9 (mm) Tool material high-speed steel Spindle speed 300, 450 (r/mim) Feed rate 25, 30, 45 (mm/min) Without coolant 45# quench steel
Fig. 3. Tool breakage AE and feed electric current signals in drilling. (a) AE signal; (b) feed electric current signal.
X. Li et al. / International Journal of Machine Tools & Manufacture 39 (1999) 1935–1944
1941
different conditions to evaluate the performance of the proposed method. Table 1 shows the tool parameters and the cutting conditions in the experiments. 4.2. Signal processing Fig. 3(a) and (b) shows the AE signal and electric feed current signal, respectively. Clearly, the tool breakage presented by the electric feed current signal lags 23 ms than that presented by AE signals. But it does not influence using property of the system. Fig. 4(a)–(c) shows the results of the AE signal DWT at resolutions j ⫽ 2, j ⫽ 3 and j ⫽ 4, respectively. The vertical axis
Fig. 4. DWT of AE signal. (a) resolution j ⫽ 2; (b) resolution j ⫽ 3; (c) resolution j ⫽ 4.
1942
X. Li et al. / International Journal of Machine Tools & Manufacture 39 (1999) 1935–1944
represents coefficient magnitude and the horizontal axis represents time over an interval corresponding to a signal insert. Fig. 5(a) and (b) showed the DWT results of the electric feed current signals at resolutions j ⫽ 1 and j ⫽ 2, respectively. Fig. 6(a) and (b) showed the results of W4— max[i] envelope detection and W1—max[i], respectively. Clearly, the small differences between the tool normal and breakage can be observed. 4.3. Experimental results Firstly, the discrete wavelet transformation coefficient of the AE and feed electric current signal were calculated and the distinctive patterns were observed. Secondly, the envelope detection of the discrete wavelet transformation coefficient of the AE and the second difference of the discrete wavelet transformation coefficient of the electric feed current signal were calculated. Finally, the accuracy of the classification between the normal tool condition and the tool breakage condition was evaluated. The test results are shown in Table 2. 5. Conclusions In the manufacturing system, the machining efficiency is influenced by the tool conditions in cutting process. One of the most complex problems for tool condition monitoring is to extract the signal features for a given cutting condition as accurately as possible.
Fig. 5. DWT of feed electric current signal. (a) resolution j ⫽ 1; (b) resolution j ⫽ 2.
X. Li et al. / International Journal of Machine Tools & Manufacture 39 (1999) 1935–1944
1943
Fig. 6. Signal processing results. (a) W1—max[i] envelop detection; (b) W4—max[i] second difference.
Table 2 Cutting condition and experimental results Drill diameter (mm) 1.0 2.0 3.0 4.6 5.6 9.0
Rotational speed (rpm) 300 300 300 450 450 450
Feed speed (mm/min) 30 30 45 30 25 25
Factual tool breakage Tool monitoring times system report times 50 50 100 50 50 20
48 49 98 50 50 20
In this paper, a real-time tool breakage detection system using the sensor fusion concept of an AE sensor and electric feed current sensor was employed to monitor tool breakage in drilling. A new signal analysis tool, the discrete wavelet transform, was used to analyze AE and feed electric current signals. It has been confirmed the DWT can clearly diagnose tool breakage, and detection algorithm can meet the requirement of the real-time monitoring system.
1944
X. Li et al. / International Journal of Machine Tools & Manufacture 39 (1999) 1935–1944
References [1] D. Li, J. Mathew, Tool wear and failure monitoring techniques for turning—A review, Int. J. Mach. Tools Manufact. 30 (4) (1990) 579–598. [2] G. Byrne, D. Dornfeld, et al. Tool condition monitoring (TCM) the status of research and industrial application, Annals of the CIRP 44 (2) (1995) 541–567. [3] P. Souquet, N. Gsib, M. Deschamps, J. Roget, J.C. Tanguy, Tool monitoring with acoustic emission-industrial results and future prospects, Annals of the CIRP 36 (1) (1987) 57–60. [4] S. Liang, D.A. Dornfeld, Tool wear detection using time series analysis of acoustic emission, Trans. ASME, J. Eng. Ind. 111 (2) (1989) 199–204. [5] D.A. Dornfeld, Neural network sensor fusion for tool condition monitoring, Annals of the CIRP 39 (1) (1989) 101–105. [6] L.I. Burke, S. Rangwala, Tool condition monitoring in metal cutting: a neural network approach, J. Intelligent Mfg. 2 (1990) 269–280. [7] I. Daubechies, The wavelet transform, time-frequency localization and signal analysis, IEEE Transactions on information theory 36 (5) (1990) 961–1005. [8] I. Daubechies, Orthogonal bases of compactly supported wavelets, Communications on Pur and Applied Mathematics XLI (1988) 909–996. [9] I. Nur Tansel, Detection of tool failure in end milling with wavelet trans formations and neural networks (WTNN), Int. J. Mach. Tools Manufact 35 (4) (1995) 1137–1147. [10] I.N. Tansel, C. Mekdeci, O. Rodriguez, B. Uragun, Monitoring drill conditions with wavelet based encoding and neural network, Int. J. Mach. Tools Manufact 33 (4) (1995) 559–575. [11] N. Kasashima, On-line failure detection in face milling using discrete wavelet transform, Annals of the CIRP 44 (1) (1995) 483–487.