J. Biomedical Science and Engineering, 2013, 6, 165-174 doi:10.4236/jbise.2013.62020 Published Online February 2013 (http://www.scirp.org/journal/jbise/)
JBiSE
Novel algorithms for accurate DNA base-calling Omniyah G. Mohammed1, Khaled T. Assaleh1, Ghaleb A. Husseini2, Amin F. Majdalawieh3, Scott R. Woodward4 1
Department of Electrical Engineering, American University of Sharjah, Sharjah, UAE Department of Chemical Engineering, American University of Sharjah, Sharjah, UAE 3 Department of Biology, Chemistry and Environmental Sciences, American University of Sharjah, Sharjah, UAE 4 Sorenson Molecular Genealogy Foundation, Salt Lake City, USA Email:
[email protected] 2
Received 5 October 2012; revised 6 November 2012; accepted 17 November 2012
ABSTRACT
1. INTRODUCTION
The ability to decipher the genetic code of different species would lead to significant future scientific achievements in important areas, including medicine and agriculture. The importance of DNA sequencing necessitated a need for efficient automation of identification of base sequences from traces generated by existing sequencing machines, a process referred to as DNA base-calling. In this paper, a pattern recognition technique was adopted to minimize the inaccuracy in DNA base-calling. Two new frameworks using Artificial Neural Networks and Polynomial Classifiers are proposed to model electropherogram traces belonging to Homo sapiens, Saccharomyces mikatae and Drosophila melanogaster. De-correlation, de-convolution and normalization were implemented as part of the pre-processing stage employed to minimize data imperfections attributed to the nature of the chemical reactions involved in DNA sequencing. Discriminative features that characterize each chromatogram trace were subsequently extracted and subjected to the chosen classifiers to categorize the events to their respective base classes. The models are trained such that they are not restricted to a specific species or to a specific chemical procedure of sequencing. The basecalling accuracy achieved is compared with the existing standards, PHRED (Phil’s Read Editor) and ABI (Applied Biosystems, version 2.1.1) KB base-callers in terms of deletion, insertion and substitution errors. Experimental evidence indicates that the proposed models achieve a higher base-calling accuracy when compared to PHRED and a comparable performance when compared to ABI. The results obtained demonstrate the potential of the proposed models for efficient and accurate DNA base-calling.
Until the last decade, the complete human genome sequence was not identified. However, a massive research effort resulted in deciphering nearly three billion constituents of the human genome. The human genome refers to the heredity information encoded in the DNA of Homo sapiens stored in 23 pairs of chromosomes located in the cell nucleus. A DNA, or deoxyribonucleic acid, strand consists of four nucleotide bases: Adenine (A), Cytosine (C), Thymine (T) and Guanine (G). A DNA molecule has a double helical structure consisting of two intertwined chains made up of complementary nucleotide strands in which A bonds with T and C pairs up with G [1]. The process of determining the ordered sequence of these nucleotide bases in a DNA molecule is referred to as DNA sequencing. Information derived from the genomic sequence is likely to contribute enormously to medical advances such as more accurate diagnosis of genetic diseases, improved drug design to target specific genes causing certain diseases and gene therapy by replacement of defective genes. The ability to decode the genetic material is also very important to researchers trying to improve the resistance of crops to parasites, detect bacteria that may pollute air or water, determine pedigree for seed or livestock breeds, explore species origin and ancestry, and determine the cause of migration of different populations and various other evolutionary studies. DNA sequencing also has potential benefits in applied fields such as DNA forensics in which crime suspects can be identified by matching their DNA with evidence left at crime scenes, establishing paternity and identifying crime and catastrophe victims. One of the first DNA sequencing techniques was developed in 1976 by Maxam and Gilbert based on chemical modification of the DNA molecule which breaks a terminally labeled DNA template partially at each base. The reaction of dimethyl sulphate, piperidine, formic acid, hydrazine and sodium chloride, individually or in combinations, causes the cleavage of the four bases. The
Keywords: Artificial Neural Network (ANN); Base-Calling; Electropherogram; Polynomial Classifier (PC); Sequencing
Published Online February 2013 in SciRes. http://www.scirp.org/journal/jbise
166
O. G. Mohammed et al. / J. Biomedical Science and Engineering 6 (2013) 165-174
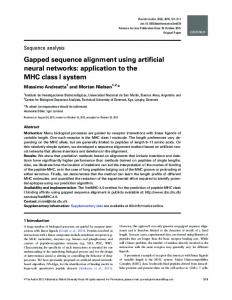
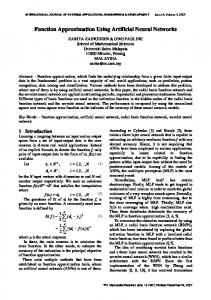
lengths of the labeled fragments then identify the positions of each base. This method allowed the sequencing of at least 100 bases [2]. Chain Termination Method, also referred to as the Sanger Method, is currently the most widely used technique for DNA sequencing [3]. The Sanger Method involves the decomposition of a DNA strand into smaller fragments using restriction enzymes followed by fragment amplification using the Polymerase Chain Reaction (PCR) technique generating many copies of the DNA template. PCR involves denaturation; breaking of the hydrogen bonds between the complementary DNA strands, annealing; attachment of the DNA strands with primers, and primer extension; binding of the polymerase with the primers resulting in the elongation of the DNA template. The DNA template to be sequenced is then divided into four sequencing reactions, each containing a primer to act as a starting point for DNA replication, deoxynucleotides (dATP, dGTP, dCTP and dTTP) and a DNA polymerase. To each sequencing reaction, only one of the four dideoxynucleotides (ddATP, ddGTP, ddCTP and ddTTP) is added to serve as a radioactive fluorescent chain terminator resulting in various DNA fragments of different lengths. Electrophoresis is then performed on the synthesized DNA fragments to separate the DNA fragments based on their length resulting in an electropherogram trace [3]. Figure 1 shows a small portion of a human DNA electropherogram. The electropherogram produced as a result of the Sanger Method undergoes base-calling, a process by which the ordered sequence of nucleotides in a DNA strand is identified. DNA base-calling involves translating Figure 1 to a string of A, T, C and G sequence—e.g. GGAGCGTTAGCAATGTC. Several systems were designed in the past couple of decades to facilitate and automate DNA base-calling. Giddings et al. [4] proposed an object oriented modular algorithm for the determination of a DNA sequence. The system undergoes noise filtering, manual mobility shift correction, normalization and baseline correction as pre-
Figure 1. Segment of an electropherogram trace. Copyright © 2013 SciRes.
processing. Identification of peaks in the chromatogram trace is then performed. A confidence value is assigned to each peak based on the following features: height, spacing and width. Post processing is then carried out by inserting bases in appropriate locations where no bases were called. In 1996, a graph theoretic approach was introduced by Berno for base-calling [5]. The approach involved low pass-filtering of the data to reduce the noise, followed by channel separation to eliminate cross-talk between the four channels. Mobility shift correction, baseline removal and de-convolution were also carried out prior to assigning a scoring function to assess the confidence of each peak occurrence. Berno’s method proved to generate less insertion and mismatch errors compared to the ABI basecaller. However, it produced double the deletion errors when compared to ABI. In 2000, Brady et al. [6] proposed an automated basecalling algorithm known as the Maximum Likelihood Base-Caller. Pre-processing involved a soft-caller and a hard-caller. The soft caller was used to compute a set of tentative call amplitudes and their locations for each base producing a set of soft calls. The hard caller combines the tentative calls for all four bases and produces the final sequence estimate using a computationally expensive dynamic programming approach. On testing the method, the base-caller resulted in 40% fewer errors than ABI and its performance was comparable to that of PHRED base-caller. In 2006, Eltoukhy et al. [7] proposed to perform DNA base-calling by using Sequencing-by-Synthesis methods such as pyrosequencing. Given a test sequence and the expected noisy output DNA sequence, system parameters were proposed to be determined by finding the DNA sequence that minimizes the probability of decoding errors. The pre-processing stage consisted of baseline correction and normalization. Iterative partial maximum likelihood sequence detection was applied to five pyrosequencing datasets. Of the two longest datasets, a total of 170 out of 208 bases, and 205 out of 224 bases were observed to be correctly decoded while the other shorter datasets resulted in no errors in base-calling. Another approach to perform DNA base-calling was proposed by Thornley et al. [8] using Neuro-Fuzzy classifiers. A Self Adaptive Neuro-Fuzzy Inference System (SANFIS) classifier was chosen as a Neuro-Fuzzy network due to its immunity to the problem of dimensionality. Using four SANFIS classifiers, bases were attempted to be recognized. In case of failure to call a base, a Neural Network was used as a classifier. On testing the model, an average accuracy rate of approximately 69% was obtained. Heuristic base-callers [4,5] are not built on a strong theoretical basis. They depend on a large number of paJBiSE
O. G. Mohammed et al. / J. Biomedical Science and Engineering 6 (2013) 165-174
rameters that needs to be optimized to a specific type of chemistry or to a certain type of sequencing technology. Statistical base-callers [6] are either poorly tested or slow, due to the high computational complexity of the implemented algorithms. In this paper, a well-established pattern recognition framework is used to build our basecaller. Artificial Neural Networks (ANN) and Polynomial Classifiers (PC) are proposed as base-calling classifiers such that the base-caller designed is not restricted to a specific chemistry or sequencing machine. Success achieved in our approach indicates the potential of our models. The rest of the paper is organized as follows. In section II, we briefly describe the method adopted for data acquisition, pre-processing and feature extraction. In section III, we describe the proposed system models: Artificial Neural Network (ANN) and Polynomial Classifier (PC), followed by a brief description of the testing results obtained using the trained models in Section 4. Finally, Section 5 summarizes our conclusions.
2. DATA ACQUISITION, PREPROCESSING AND FEATURE EXTRACTION The approach adopted in this paper to solve the problem of base-calling is based on designing a pattern recognition classifier. The data to be classified are acquired from sequencing machines; hence a pre-processing stage is needed to achieve noise removal prior to feature extraction. The success in the implementation of any approach depends on the effectiveness of the features extracted to represent a DNA pattern. In this section, the main components of any pattern recognition model are: data acquisition (or sensing), pre-processing and feature extraction, are discussed.
2.1. Data Acquisition/Sensing One of the main considerations in designing a pattern recognition classifier is the presence of an adequate size of data to train and test the model. Performance of the classifier model increases as the amount of data used increases. The training data are chosen such that every possible case scenario is seen and learnt by the model. However, over-fitting needs to be prevented so that the generalization of the classifier model to novel data is not
167
affected. The needed chromatogram traces for training and testing the classifier models were obtained from the Sorenson Molecular Genealogy Foundation (SMGF) along with their respective consensus sequences, i.e. DNA sequences obtained from the sequencing of overlapping fragments of a gene several times. Moreover, data obtained from the National Center for Biotechnology Information (NCBI) trace archive [9] were labeled using commercially available PHRED base-calling software, CodonCode Aligner. PHRED is used since it demonstrates high accuracy when tested over a wide variety of sequencing methods and has proven to have a higher system performance compared to other existing base-callers [10]. The NCBI Basic Local Alignment Search Tool (BLAST) is then run on each PHRED generated sequence to locate the corresponding consensus sequence for each DNA fragment being tested. The determined consensus sequences were used to label the chromatogram traces for accurate training of the classifier. To evaluate the performance of the designed classifier models based on noise contamination, chromatogram source and read length of the electropherograms, the traces obtained from the SMGF and from the NCBI trace archive were categorized into three main data sets as shown in Table 1. For the analysis of classifier performance, the DNA sequence obtained using PHRED and ABI base-callers on the above three data sets are needed. CodonCode Aligner and Bioedit were used to obtain the DNA sequence called by PHRED and ABI base-callers.
2.2. Pre-Processing Electropherograms obtained after the implementation of electrophoresis may be contaminated by noise introduced at various stages of DNA sequencing. Noise contamination occurs as a result of the imperfections in the chemistry involved and the electronics of electrophoresis. Noise superimposed on a DNA trace may appear in the form of overlapping spectra, presence of one or more large peaks at the beginning of the trace, a drift in the DC value of the signal, variations in the dynamic range, or low peak resolution. The data chosen for both training and testing the designed models are hence subjected to several stages
Table 1. Distribution of data acquired into three data sets. Data Set No.
Data Source
No. of Traces
Specie
Characteristics Noisy trace, belongs to one species, consists of 600 - 700 bases.
1
NCBI
6
Homo sapiens chromosome: 5, 6, 11, 12, 13.
2
NCBI & SMGF
11
Homo sapiens mitochondrian D-loop, Noisy trace, belongs to three species, Saccharomyces mikatae, Drosophila melanogaster. consists of 675 - 775 bases.
3
SMGF
5
Homo sapiens mitochondrian D-loop.
Copyright © 2013 SciRes.
Lower noise level, trace belongs to only one species, consists of 800 - 900 bases.
JBiSE
168
O. G. Mohammed et al. / J. Biomedical Science and Engineering 6 (2013) 165-174
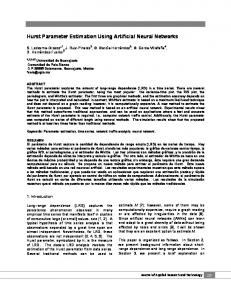
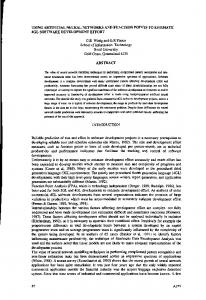
of pre-processing to condition the signals without losing useful information. Therefore, this stage involves three main processing functions: color correction, peak sharpening, and windowed normalization. 2.2.1. Color Correction During DNA sequencing, the four-base traces in their respective channels undergo interference resulting in the detection of false peaks or peaks with erroneous excitation wavelengths, a process known as cross-talk. This process causes signal distortion which affects the performance of any base-caller. Hence, de-correlation, also referred to as color correction, is implemented to reduce such interference. Using the noisy raw chromatogram traces (Figure 2 (a)), a 4 × 4 correlation matrix, M, is needed to remove the cross-talk between the four lanes. Each column of the cross correlation matrix also referred to as the mixing matrix, represents the relative signal intensity of each dye compared to the other three dyes. However, M is not known initially and needs to be determined. One common practice uses the manufacturer’s provided mixing matrix to implement the linear transformation. If the manufacturer is not known, the components of M can be determined by identifying a clear known peak in each lane of the raw data. For each of the identified peaks, the corresponding relative signal intensities are obtained and are placed as a single row in the matrix [4,11]. Since the data were acquired mainly from public databases, the matrix M provided by the respective manufacturers could not be found. Instead, the matrix M was initially estimated by the identification of four clear peaks in the chromatogram trace and the relative signal intensities were obtained. However, it was observed that the data did not achieve sufficient de-correlation. Hence, M was re-estimated by taking into consideration the entire trace, not only four clear peaks. The correlation coefficients were calculated from a raw input trace, XR, of size n × 4, whose rows represent the observation samples and the columns represent the bases (the variables). A linear transformation, using the matrix M, is then implemented to obtain the desired color corrected signal, XCC, as follows: X CC MX R . (1) where:
X R xR , A xR ,C xR ,T xR ,G and X R xcc , A xcc ,C xcc ,T xcc ,G
Figure 2(b) shows the trace data obtained after the implementation of the above de-correlation routine. On comparing Figures 2(a) and (b), it can be clearly observed how the noisy interference represented in the form of background ripples or overlapping peaks have Copyright © 2013 SciRes.
(a)
(b)
Figure 2. Part of an electropherogram trace (a) before and (b) after color correction.
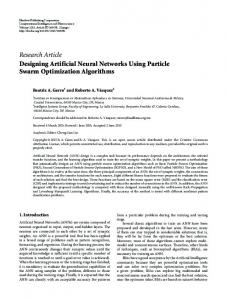
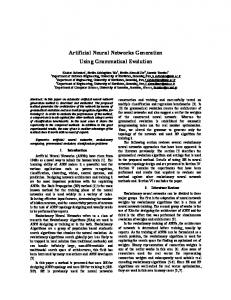
been either removed or highly reduced as a result of color correction. 2.2.2. Peak Sharpening In an ideal electropherogram trace, each peak is represented by a single clear peak. However, this does not happen in a real trace. During electrophoresis, based on the length of the DNA fragments, the time needed for a fragment to reach the photo-detector depends on its length. Short DNA fragments travel faster than longer ones and hence, are located in the early segments of a chromatogram trace. Typically, a certain range of short fragments arrive at the photo detector at approximately the same time resulting in sharp and easy-to-distinguish peaks. But as time passes and the slower “longer” DNA fragments reach the detector, the resolution of successive peaks is observed to deteriorate gradually as a result of electrophoretic diffusion. This occurs due to the variation in the arrival time of various similar long DNA fragments resulting in wider, flatter and more distorted peaks [12]. Figure 3 illustrates the initial and final segments of a DNA trace obtained after the process of electrophoresis. It is clearly shown in Figure 3(a) that peaks in the first part of the trace are sharp and of a higher resolution compared to peaks in the last segments of the chromatogram trace (Figure 3(b)) which are of a much lower resolution and are not easily identifiable. Low resolution peaks result in inaccurate peak detection and hence, need to be resolved. A non-linear iterative de-convolution algorithm [13] is employed to recover the high resolution base peaks. Chromatogram traces obtained from electrophoresis ideally represent a JBiSE
O. G. Mohammed et al. / J. Biomedical Science and Engineering 6 (2013) 165-174
169
- The initial assumption is convoluted with the point spread function and xD ,i is updated as follows,
xD ,i y1 FxD ,i y xD ,i y xCN ,i h xD ,i y
(7)
where, F is an operator and λ is the relaxation constant. - When y is sufficiently large, xD ,i y1 converges to the underlying pulse train, (8) lim xD ,iy xD ,i
(a)
y
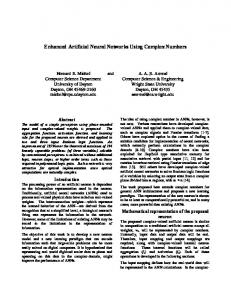
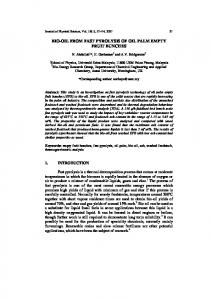
By performing iterative de-convolution, peak sharpening and enhancement of signal quality are achieved. Figure 4(a) shows part of a chromatogram trace prior to de-convolution, while Figure 4(b) shows the same trace after de-convolution. By comparing the two figures, the low resolution peaks sharpened to a higher resolution as a result of de-convolution can be observed. (b)
Figure 3. (a) High resolution peaks at the initial parts of a trace; (b) Low resolution peaks at the last part of a trace.
linear system. A high resolution trace, xD ,i , is assumed to be a sparse pulse train corresponding to the occurrence of each base. xD ,i a k p n k .
(2)
k
where, k represents the position of each base peak, p(n) is a pulse of a narrow width, and a(k) corresponds to the pulse amplitude. The observed low resolution trace, xcc ,i , can be obtained, mathematically, by the convolution of the high resolution trace, xD ,i , with a point spread function, h. That is, xcc ,i xD ,i h.
(3)
Thus, to reconstruct the high resolution trace, iterative de-convolution is adopted. The following outlines the general procedure to obtain the de-convolved DNA trace: - Color corrected data, xcc ,i , of size n × 1 is treated as the observed signal. Note that i represents the four bases: A, C, T and G. - xcc ,i is initially normalized by its maximum observation to obtain xCN ,i , xCN ,i
xcc ,i max( xcc ,i )
For i A, C , T and G
2.2.3. Normalization Peak amplitudes in a chromatogram trace are observed to decay with time due to several factors including electropherogram source imperfections and variations in detector sensitivity. Due to the difference in the dynamic range of a trace, it is vital to normalize the signals before base-calling is initiated. Normalization can be achieved using many different techniques. Giddings et al. [11] proposed segmentation of the observation points into consecutive windows. A scaling factor was then determined such that the amplitudes of the segmented data are normalized to the [0, 1] range. Another method adopted [12] involves also the segmentation of the observation points into windows. However, for each window the average peak height is calculated and the segmented data are normalized according to it.
(a)
(4)
- A normalized point spread Gaussian function, h, is chosen and de-convoluted data, xD ,i , of size n × 1 is used to represent the desired signal. - The first iteration, y = 0, is initialized as follows to obtain xD ,i y ,
Copyright © 2013 SciRes.
x0 xCN ,i .
(5)
(b)
xD ,i0 x0 .
(6)
Figure 4. Chromatogram trace (a) before and (b) after deconvolution. JBiSE
O. G. Mohammed et al. / J. Biomedical Science and Engineering 6 (2013) 165-174
170
In this paper, a simple windowed normalization technique is adopted to obtain a normalized chromatogram trace. The pre-processed trace obtained from the previous stage is initially divided into non-overlapping consecutive windows. Each segment is then normalized by its maximum amplitude. Figure 5(a) illustrates the trace signal prior to normalization while Figure 5(b) illustrates the same trace after normalization. The decay in the amplitude is evident in Figure 5(a) while the uniformity of the signal height after normalization is seen in Figure 5(b).
Feature extraction is the main stage which has a direct effect on the performance of a pattern recognition model. Feature extraction can be thought of as a form of dimensionality reduction. It is the process in which the preprocessed input data is transformed into a set of representative,discriminative and unique set of features to characterize each chromatogram trace. These features are then used to train and test the proposed classifier model in a much more efficient way. In our approach, the features chosen to represent each observation point in a chromatogram trace are as follows: F FA FC FT FG
(9)
where x
x x1 , x2 , , xn
(11)
- g is a vector of size n × 1. It consists of the gradient values for each observation point calculated using the signal strength of the prior three sample points for each observation. g g1 , g 2 , , g n
(12)
where
2.3. Feature Extraction
Fi g
points in the chromatogram trace. - x is a vector of size n × 1. It represents the signal strength of base i at each observation point,
g for i A, C , T and G
(10)
and, - F1 represents the set of feature vectors of base i. It is a matrix of size n × 3 where, n is the number of sample
g z
xz xz 3 for z 4, 5 n 3 3
(13)
- g is a vector of size n × 1. It consists of the gradient values for each observation point calculated using the signal strength of the subsequent three sample points for each observation. g g1 , g 2 , , g n
(14)
where g z
xz 3 xz for z 4, 5 n 3 3
(15)
From the chromatogram trace, it is observed that the positive ascent of a peak to the apex and the negative descent of a peak to the subsequent valley are defined by using a minimum of three sample points respectively. Hence, for the calculation of positive (Eq. 15) and negative (Eq. 13) gradient values, three samples are adopted.
3. SYSTEM MODELS Using features extracted in the previous section, the DNA base-calling problem can now be tackled. In this paper, two pattern recognition models are used to solve the problem of base-calling: Artificial Neural Networks (ANNs) and Polynomial Classifiers (PCs).
3.1. Artificial Neural Network (a)
(b)
Figure 5. Part of an electropherogram trace (a) before and (b) after normalization. Copyright © 2013 SciRes.
Artificial Neural Network (ANN) is a computational approach conceived as an imitation of the human’s brain neural network. Based on the training data, ANNs are capable of adapting its structure accordingly. The basic building block of an ANN is an information processing unit, referred to as neuron, consisting mainly of weights equal to the size of the data set, an adder to sum up the weighted inputs, and an activation function for limiting the output of the neuron [14]. ANN’s quality as universal function estimators renders them attractive as pattern classifiers. ANN’s ability to model both linear and nonlinear data is another advantage. However, this property JBiSE
O. G. Mohammed et al. / J. Biomedical Science and Engineering 6 (2013) 165-174
makes an ANN prone to over-fitting, the tendency of a model to adapt itself to the minute details of a training data set. Figure 6 illustrates a single hidden layer feed forward neural network consisting of an input layer, a hidden layer, and an output layer. Multiple neurons group together to form a layer and are connected to the neurons in the preceding and subsequent layers through biases and weights. The features extracted from the acquired data, represented as the input layer, constitute the input signals applied to the neurons comprised in the first hidden layer. Hence, the number of neurons in the input layer is equal to the dimensionality of the input feature vector, i.e. 12 (three features for each of the four bases). As a rule of thumb, a neural network with one hidden layer has the same expressive power as a network built from several hidden layers. Moreover, as a practice, the number of neurons in a hidden layer is twice that of the input layer [15]. The outputs of the hidden layer are then used as inputs to the output layer. The number of neurons in the output layer represents the number of classes the input data can be classified into [16]. For the proposed base-calling problem, classification involves recognition of the four bases, A, C, T and G, referred to as classes. Hence, five neurons are used to form the output layer: four of which represent the presence of each of the four nucleotides, while the fifth neuron represents the absence of all the four bases, represented as N. In the learning stage, a target matrix, T, is needed for labeling the ANN input data classes. t1, A t1 t t2, A T 2 t n t n, A Input Layer d features
t1,C
t1,T
t2,C
t2,T
tn ,C
tn ,T
t1,G t1, N t2,G t2, N tn ,G tn , N
Hidden Layer
(16)
Output Layer M classes
X(1)
X(2)
Z1
The values assigned to the elements of T are as follows: - t z ,i B 1 while t z ,i B , t z , N 0 for sample point z and B A, C , T , G , if base i has a positive feature g z , indicating a positive slope for the three sample points prior to z, and a negative feature g z , indicating a negative slope for the three sample points subsequent to z. - t z , N 0.05 while t z ,i 0 for sample point z and B A, C , T , G if the above condition is not satisfied. The prior probabilities indicating presence and absence of a base are imbalanced due to the large availability of class N in a chromatogram trace compared to the other bases. Since it is difficult to balance the amount of data belonging to each class, the weight given for class N is reduced by assigning it a target value of 0.05 [17]. Using the MATLAB R2009b Neural Network toolbox, the neural network model was trained and tested using a single hidden layer, an output layer consisting of five neurons to represent each of the five previously mentioned classes, and hyperbolic tangent sigmoid transfer functions. To avoid the problem of over-fitting, a validation data set is used in addition to the training and testing data sets. The validation data ensures that the training process is terminated prior to over-fitting the training data to the model.
3.2. Polynomial Classifier Polynomial Classifiers (PCs) [18] represent non-linear system identifications providing an efficient method to describe non-linear input/output relationships. PCs are a single layer neural network that adopts the polynomial terms of the pattern features as inputs. A PC uses k:d-dimensional feature vectors, X, which can be categorized into non-linearly separable classes. A mapping function between each input and its respective class then needs to be determined. A Kth order polynomial classifier uses a Kth order polynomial expansion function to map a d-dimensional feature vector, x, to a higher dimensional vector space, p(x) For example, if x is a 2-dimensional feature vector represented as x x1 x2 , the mapping of x to a higher dimensional space of K = 2 produces, p x 1 x1
x2
x12 x22
x1 x2
(17)
Similarly, the sequence of N:d-dimensional feature vectors, X x1 , x2 , , xn is expanded into their Kth order polynomial expansion, M, where,
X(d) Zm
Bias
Figure 6. A single hidden layer feedforward neural network. Copyright © 2013 SciRes.
171
M p x1 p x2 p xN
(18)
Using the expanded feature vectors, M, the polynomial classifier is trained to determine the optimum set of weights, wopt , that minimizes the difference between the JBiSE
O. G. Mohammed et al. / J. Biomedical Science and Engineering 6 (2013) 165-174
172
model output and the desired targets, tx such that, wopt arg min MW t x w
itself k times. The trained models were tested by comparing the results obtained in terms of bases called to the consensus sequence of each chromatogram trace and to the DNA sequences obtained from ABI and PHRED base-callers. The performance of the neural network model and the polynomial classifier model in terms of correct bases obtained was measured based upon three types of errors that can occur in DNA base-calling: deletion errors, insertion errors, and substitution errors. A deletion error represents the loss of one or more bases by the basecaller. For example, when the base sequence of a DNA template is TACGGT and the base-caller calls TCGGT, a deletion error has occurred. An insertion error, on the other hand, involves the addition of one or more bases by the base-caller. For example, when the base sequence of a DNA template is TACGGT and the base-caller calls TATCGGT, an insertion error has occurred. A substitution error occurs when the base-called replaces the actual base. For example, when the base sequence of a DNA template is TACGGT and the base-caller calls TACCGT, a substitution error has occurred. The performance of the trained model is shown in Tables 2-4 for the three data sets. In the three cases shown, an overall base-calling average of 98.4% and 98.64% are achieved by ANN and PC, respectively, indicating the flexibility of the designed topologies [19,20]. Moreover, in comparison to ABI and PHRED, the currently most widely used base-calling software, in terms of deletion, insertion and substitution errors, both proposed models achieved a higher accuracy than PHRED and a comparable performance to that of ABI. However, ABI and PHRED base-callers were designed using thousands of chromatogram traces while the models designed in this paper used a discrete number of traces for its training and testing. This indicates the high potential of the proposed classifiers as more efficient alternative base-callers.
(19)
2
M T Mwoptm M T t X
(20)
Using the parameters obtained from the training stage, an unknown feature vector, z, is expanded to its polynomial terms, p(z), to test the trained model. The target vector, tz, is obtained as follows, t z wopt p z
(21)
On employing a 2nd order polynomial expansion on the features extracted from the data acquired, the data are still observed to be non-linearly separable. Hence, a 3rd order polynomial classifier using a 3rd order polynomial expansion function is implemented in this work to train the PC. The trained model is then tested using novel data from the three data sets and a set of scores are obtained, followed by post-processing to attain the final DNA sequence.
4. MODEL TESTING AND RESULTS Data acquired were divided into three sets based on the extent of noise contamination, source of the data, the organism the trace belongs to, and the read length. In light of the limitation in the number of bases, round robin strategy is used in training and testing the proposed models to increase the statistical significance of the results. The available traces are divided into k disjoint sets, such that k models are trained using the data in the (k − 1) sets and tested on the remaining non-trained data set. In the case where k is equal to the number of traces in the data set, i.e. k = 6, leave-one-out method is implemented, i.e. out of the six available traces, traces 2 to 6 are used for training while the first trace is used for testing. The next round uses traces 1, 3 to 6 for training and the second trace is spared for testing, and the cycle repeats
Table 2. Performance measure of trained ANN and PC compared to PHRED and ABI for data set 1. Correct Recognition (%)
Chromatogram Traces
Deletion Errors (%)
Insertion Errors (%)
ANN
PC
PHRED
ABI
ANN
PC
PHRED
ABI
ANN
PC
PHRED
Trace 1—639 Bases 97.65
98.6
61.19
99.21
1.56
0.63
18.47
0.16
0.16
0
Trace 2—623 Bases 96.15
95.83
71.43
97.75
1.12
0.64
4.01
0.16
1.61
Trace 3—632 Bases 97.63
98.1
97.63
99.68
0.79
0.79
0.16
0
Trace 4—632 Bases 97.47
98.26
98.73
99.37
1.11
0.47
0
Trace 5—722 Bases 97.23
98.06
97.51
98.75
0.83
0.83
Trace 6—722 Bases 98.20
98.34
88.92
99.45
0.28
0.28
Copyright © 2013 SciRes.
Substitution Errors (%) ABI ANN
PC PHRED ABI
0.78
0.63
0.63
0.78
19.56
0
1.12
0.32
0.16
1.12
2.41
24.24
1.93
0.95
0.32
0.16
0
0.63
0.79
2.06
0.32
0.16
0.16
0.32
0
0.32
1.27
0.95
1.27
0.16
0.14
0.55
0.83
0.42
0.69
0.14
1.11
0.69
1.66
0.55
8.73
0.14
0.83
0.55
0.69
0.28
0.69
0.83
1.66
0.14
JBiSE
O. G. Mohammed et al. / J. Biomedical Science and Engineering 6 (2013) 165-174
173
Table 3. Performance measure of trained ANN and PC compared to PHRED and ABI for data set 2. Chromatogram Traces
Correct Recognition (%) ANN
Deletion Errors (%)
PC PHRED ABI ANN
Insertion Errors (%)
PC PHRED ABI
ANN
PC
Substitution Errors (%)
PHRED ABI
ANN
PC
PHRED ABI
Homo sapiens—639 Bases
97.81 98.12 61.19 99.21 0.47
0.63
18.47
0.16
0.94
0.94
0.78
0.63
0.78
0.31
19.56
0
Saccharomyces mikatae—674 Bases
99.41 98.81 99.41 99.41 0.59
0.59
0.15
0.15
0
0.59
0.15
0.15
0
0
0.30
0.30
Drosophila 97.58 98.66 99.33 97.45 2.15 melanogaster—744 Bases
0.81
0.67
1.75
0
0.27
0
0.27
0.27
0.27
0
0.54
Table 4. Performance measure of trained ANN and PC compared to PHRED and ABI for data set 3. Chromatogram Traces
Correct Recognition (%) ANN
PC
Trace 1—759 Bases
99.87
99.74
100
Trace 2—882 Bases
99.66
99.55
Trace 3—866 Bases
99.31
Trace 4—740 Bases Trace 5—710 Bases
Deletion Errors (%)
PHRED ABI
ANN
PC
100
0.13
0.13
0
99.89
100
0.23
0.23
99.53
99.53
100
0.46
99.19
98.78
99.73
99.86
99.72
99.86
100
100
PHRED ABI
ANN
PC
0
0
0.13
0
0
0
0
0.11
0.35
0.12
0
0.23
0.68
0.68
0.27
0.14
0.14
0.14
0
0
5. CONCLUSIONS Efficiently deciphering the human genome through DNA sequencing has been anticipated widely for the contribution it is bound to make in a range of applications such as understanding the causation of genetic diseases and human evolution. However, the relatively high cost of the chemistry involved in DNA sequencing results in high operational cost in genome research centers. This fact has triggered research initiatives to improve the accuracy of base reads in noisy electropherograms so that re-sequencing of the required DNA fragment is not needed, thereby, reducing sequencing expenses. A simple neural network and a polynomial classifier model that matches the performance of existing basecallers was proposed in this paper. An average accuracy of 98.4% and 98.64% is achieved by ANN and PC, respectively, and the ability of the classifiers to result in negligible substitution errors compared to ABI and PHRED was proven. PHRED is currently the most widely used base-caller software due to its high base-calling accuracy which exceeds that of ABI [21]. The ABI base-calling software was improved by developing the KB base-caller which incorporates base-specific quality scores similar to PHRED. ABI KB was calibrated using more than 20 million base-calls and tested on more than 10 million bases [22]. Hence, justifying the high accuracy of ABI compared to the proposed models and PHRED. However, Copyright © 2013 SciRes.
Insertion Errors (%)
Substitution Errors (%)
PHRED ABI
ANN
PC
PHRED ABI
0
0
0
0
0
0
0
0.11
0.11
0.11
0
0.12
0
0
0
0
0.35
0
0.14
0.27
0
0
0
0.27
0
0
0
0
0
0
0.14
0
0
0
it should be noted that PHRED results in high error rates in some traces which already have their quality scores assigned. In such cases, PHRED makes obvious errors in perfectly clear sequences. The proposed models do not depend on the spacing between adjacent peaks that varies dynamically as we progress through the trace. In addition, the models were designed not to assign an “N” to a peak. The base with the highest score is assigned to a peak irrespective of the noise. Moreover, the ANN and PC models have not been trained and tested in this paper using thousands of chromatogram traces. In fact, discrete number of traces were utilized and a performance that exceeds the accuracy of PHRED and comparable to ABI was obtained. Therefore, the potential and suitability of a neural network and polynomial classifier model as a base-calling tool were demonstrated. Yet, further research is needed to improve the recognition rate.
REFERENCES [1]
Griffiths, A.J.F., Wessler, S.R., Lewontin, R.C., Gelbart, W.M., Suzuki, D.T. and Miller, J.H. (2005) An introduction to genetic analysis. 8th Edition, W.H. Freeman, New York, 2-5.
[2]
Maxam, M. and Gilbert, W. (1977) A new method for sequencing DNA. Proceedings of the National Academy of Sciences of the United States of America, 74, 560-564. JBiSE
174
O. G. Mohammed et al. / J. Biomedical Science and Engineering 6 (2013) 165-174 doi:10.1073/pnas.74.2.560
[3]
[4]
Sanger, F., Nicklen, S. and Coulson, A. (1977) DNA sequencing with chain terminating inhibitors. Proceedings of the National Academy of Science, 74, 5463-5467. doi:10.1073/pnas.74.12.5463 Giddings, M., Brumley, R., Haker, M. and Smith, L. (1993) An adaptive, object oriented strategy for base-calling in DNA sequence analysis. Nucleic Acids Research, 21, 45304540. doi:10.1093/nar/21.19.4530
[5]
Berno, A. (1996) A graph theoretic approach to the analysis of DNA sequencing data. Genome Research, 6, 80-91. doi:10.1101/gr.6.2.80
[6]
Brady, D., Kocic, M., Miller, A. and Karger, B. (2000) Maximum likelihood base-calling for DNA sequencing. IEEE Journal of Biomedical Engineering, 47, 1271-1280. doi:10.1109/10.867962
[7]
Eltoukhy, H. and Gamal, A. (2006) Modeling and basecalling for DNA sequencing-by-synthesis. IEEE International Conference on Acoustics, Speech and Signal Processing, 2, 2.
[8]
Thornley, D. and Petridis, S. (2007) Decoding trace peak behavior—A neuro-fuzzy approach. IEEE International Fuzzy Systems Conference, London, July 2007, 1-6.
[9]
Trace Archive. National center for biotechnology information. http://www.ncbi.nlm.nih.gov/Traces/trace.cgi#
[10] Richterich, P. (1998) Estimation of errors in raw DNA sequences: A validation study. Letter in Genome Research, 8, 251-259. [11] Berno, A. (1996) A graph theoretic approach to the analysis of DNA sequencing data. Genome Research, 6, 8091. doi:10.1101/gr.6.2.80 [12] El-Difrawy, S.A. (2003) A soft computing system for accurate DNA base-calling. Ph.D. Dissertation, Northeastern University, Boston. [13] Zhang, X.-P. and Allison D. (2002) Iterative deconvolution for automatic base-calling of the DNA electrophore-
Copyright © 2013 SciRes.
sis time series. Workshop on Genomic Signal Processing and Statistics, Raleigh. [14] Priddy, K.L. and Keller, P.E. (2005) Artificial neural networks: An introduction. The International Society for Optical Engineering, Washington, 11. doi:10.1117/3.633187 [15] Duda, R.O., Hart, P.E. and Stork, D.G. (2000) Pattern classification. 2nd Edition, John Wiley and Sons, New York. [16] Haykin, S.S. (2009) Neural networks and learning machines. 3rd Edition, Prentice Hall, New Jersey, 10-22. [17] Farrell, K.R., Mammone, R.J. and Assaleh, K.T. (1994) Speaker recognition using neural networks and conventional classifiers. IEEE Transactions on Speech and Audio Processing, 2, 194-205. doi:10.1109/89.260362 [18] Campbell, W.M., Assaleh, K. and Broun, C.C. (2004) Speaker recognition with polynomial classifiers. IEEE Transactions in Speech and Audio Processing, 10, 205212. doi:10.1109/TSA.2002.1011533 [19] Mohammed, O.G., Assaleh, K.T., Husseini, G.A., Majdalawieh, A.F. and Woodward, S.R. (2010) DNA basecalling using polynomial classifiers. Proceedings of International Joint Conference on Neural Networks, 18-23 July 2010, Barcelona, 1-5. [20] Khan, O.G.M., Assaleh, K.T., Husseini, G.A., Majdalawieh, A.F. and Woodward, S.R. (2011) DNA base-calling using artificial neural networks. Middle East Conference on Biomedical Engineering, Sharjah, February 2011, 96-99. [21] Ewing, B., Hillier, L., Wendle, M.C. and Green, P. (1998) Base-calling of automated sequencer traces using phred. I. Accuracy assessment. Genome Research, 8, 175-185. [22] Brockman, W., Alvarez, P., Young, S., Garber, M., Giannoukos, G., Lee, W.L., Russ, C., Lander, E.S., Nusbaum, C. and Jaffe, D.B. (2008) Quality scores and SNP detection in sequencing-by-synthesis systems. Genome Research, 18, 763-770. doi:10.1101/gr.070227.107
JBiSE