low-viscosity liquid. For the liquid, we typically used high-performance liquid chromatography grade toluene with various concentrations of ethanol (98% w=w ...
VOLUME 90, N UMBER 11
PHYSICA L R EVIEW LET T ERS
week ending 21 MARCH 2003
Dynamic Self-Assembly and Patterns in Electrostatically Driven Granular Media M.V. Sapozhnikov,1,2 Y.V. Tolmachev,1 I. S. Aranson,1 and W.-K. Kwok1 1
2
Materials Science Division, Argonne National Laboratory, 9700 South Cass Avenue, Argonne, Illinois 60439 Institute for Physics of Microstructures, Russian Academy of Sciences, GSP-105, Nizhny Novgorod 603000, Russia (Received 14 October 2002; revised manuscript received 30 January 2003; published 19 March 2003) We show that granular media, consisting of metallic microparticles immersed in a poorly conducting liquid in a strong dc electric field, self-assemble into a rich variety of novel phases. These phases include static precipitates: honeycombs and Wigner crystals; and novel dynamic condensates: toroidal vortices and pulsating rings. The observed structures are explained by the interplay between charged granular gas and electrohydrodynamic convective flows in the liquid. DOI: 10.1103/PhysRevLett.90.114301
Large ensembles of small particles display fascinating collective behavior when they acquire an electric charge and respond to competing long-range electromagnetic and short-range contact forces. Many industrial technologies face the challenge of assembling and separating such single- or multicomponent micro- and nanosize ensembles. The dynamics of conducting microparticles in an electric field in the air was studied in [1,2]. Phase transitions and clustering instability of the electrostatically driven granular gas were found. The studies of self-assembly of colloidal particles in aqueous solutions revealed the importance of self-induced electrohydrodynamic (EHD) convective flows on the formation of various precipitate states [3–7]. Ordered clusters of particles vibrated in liquid were studied in Ref. [8]. In this Letter, we report new dynamic phenomena occurring in granular gas in a poorly conducting liquid subject to a strong electric field (up to 20 kV=cm). We show that metallic particles (120 �m diameter bronze spheres) immersed in a toluene-ethanol mixture in dc electric field self-assemble into a rich variety of novel phases. These phases include static precipitates: honeycombs and two-dimensional (Wigner) crystals; and novel dynamic condensates: toroidal vortices and pulsating rings (Figs. 1 and 2). The observed phenomena are attributed to interaction between particles and EHD flows produced by the action of the electric field on ionic charges in the bulk of the liquid. This provides a new mechanism for self-assembly of microparticles in nonaqueous solutions. To form the electrocell, granular media consisting of 3 g (about 0:5 � 106 ) monodispersed 120 �m bronze spheres was placed into a 1.5 mm gap between two horizontal 12:5 cm � 12:5 cm glass plates covered by a transparent conducting layer of doped indium tin dioxide (the particles constitute less than a monolayer coverage on the bottom plate). An electric field perpendicular to the plates was created by a dc high voltage source (0 – 3 kV) connected to the inner surface of each plate [1,2]. The liquid was introduced into the cell through two Teflon microcapillaries. Real time images were acquired using a 114301-1
0031-9007=03=90(11)=114301(4)$20.00
PACS numbers: 45.70.Qj, 05.65.+b, 47.15.Cb, 47.55.Kf
high speed, up to 1000 frames per second, digital camera suspended over the transparent glass plates of the cell. Experiments were repeated with smaller particles (40 �m Cu spheres) and similar results were obtained. The principle of the electrocell is as follows: A particle acquires an electric charge when it is in contact with the bottom conducting plate. It then experiences a force from the electric field between the plates. If the upward force induced by the electric field exceeds gravity, the particle travels to the upper plate, reverses charge upon contact, and is repelled down to the bottom plate. This process repeats in a cyclical fashion. In an air-filled cell, the particle remains immobile at the bottom plate if the electric field E is smaller than a first critical field E1 . If the field is larger than a second critical field value, E2 > E1 , the system of particles transforms into a uniform gaslike phase. When the field is decreased below E2 (E1 < E < E2 ), localized clusters of immobile particles spontaneously nucleate to form a static precipitate on the bottom plate. The clusters exhibit the Ostwald-type
FIG. 1 (color online). Snapshots of (a) static clusters, (b) honeycomb precipitate, (c) ‘‘down’’ toroidal vortices, and (d) pulsating rings.
2003 The American Physical Society
114301-1
VOLUME 90, N UMBER 11
PHYSICA L R EVIEW LET T ERS
FIG. 2 (color online). Close-up view of (a) Wigner crystal precipitate and (b) honeycomb precipitate. See Movies 1 and 2 in [9] for dynamics of precipitate formation.
ripening [10]. The phase diagram for the air-filled cell is symmetric with respect to the reversal of the electric field direction. In this work, we discovered that the situation is remarkably different when the cell is filled with a nonpolar low-viscosity liquid. For the liquid, we typically used high-performance liquid chromatography grade toluene with various concentrations of ethanol (98% w=w anhydrous ethanol � 2% w=w water). The conductivity of the liquid changes from 5 � 10�11 ohm�1 m�1 (pure toluene) to 5 � 10�9 ohm�1 m�1 (9% ethanol solute). The phase diagram delineating the different particle behavior as a function of the applied voltage and concentration of ethanol is shown in Fig. 3. For relatively low concentrations of ethanol solute (below 3%), the qualitative behavior of the liquid-filled cell is not very different from that of the airfilled cell: Clustering of immobile particles and coarsening are observed between two critical field values E1;2 with the clusters being qualitatively similar to that of the air cell. A typical low-concentration pattern is shown in Fig. 1(a). When the ethanol concentration is increased, the behavior of the liquid-filled cell is remarkably different from that of the air-filled cell. The phase boundaries are no longer symmetric with respect to reversal of the applied voltage. Initially, an increase in ethanol concentration leads to asymmetric behavior with respect to the
FIG. 3. Phase diagram: U is applied voltage (positive values correspond to plus on top plate), C is concentration of ethanol. Domain sc denotes static clusters; w: Wigner crystals; hc: honeycombs; utv and dtv up/down toroidal vortices.
114301-2
week ending 21 MARCH 2003
direction of the electric field. Critical field values, E1;2 , are larger when the electric field is directed downward (’’+’’ on upper plate) and smaller when the field is directed upward (’’2’’ on upper plate). This difference grows with increasing ethanol concentration. The observed asymmetry of the critical fields is apparently due to an excess negative charge in the bulk of the liquid. This charge increases the effective electric field acting on the positively charged particles sitting on the bottom plate when a positive voltage is applied to that plate and correspondingly decreases the effective electric field in the case of an applied negative voltage. From the shift in the critical field values, one estimates the excess negative charge concentration in the bulk. Assuming uniform charge distribution in the bulk, one derives the estimate for the excess charge concentration n � ""0 �U=ed2 , where the dielectric permeability of the toluene/ethanol mixture " � 3, d is the gap between the plates, and e is ionic charge. For the solute concentration C � 3% and the observed critical voltage shift �U � 150 V, one finds n� � n� � 1016 m�3 . The carrier concentration can be independently estimated from transport measurement (total current through the cell is I � 1 �A at U � 300 V, its surface is S � 1:5 � 10�2 m2 ). Neglecting concentration gradients, the migration current can be evaluated as e2 DS�n� � n� �U=dkB T, where D � 10�9 m2 =s is the representative value for ion diffusion, and T is temperature. That estimate also yields n� � n� � 1016 m�3 . Both estimates indicate that the liquid contains almost exclusively ions of the same (negative) sign (albeit in a very small concentration). These ions (possibly OH� ) are distributed throughout the cell by the current, while positive ions (H� ) are absorbed by the electrodes [11]. The situation changes dramatically for higher ethanol concentrations: Increasing the applied voltage leads to the formation of two new immobile phases: honeycomb and Wigner crystal precipitates. The Wigner crystal precipitate [Fig. 2(a)] is induced for upward direction of the applied electric field, whereas a honeycomb precipitate is induced upon electric field reversal [Figs. 1(b) and 2(b)]. A return to the original applied voltage transforms the honeycomb structure back into the Wigner crystal phase and vice versa. The representative time scale for these transitions is 0.5 sec. For high enough voltage, these patterns coexist with granular gas. However, due to the bombardment by the gas-phase particles, the honeycomb structure becomes more diffuse. The typical size of the elementary honeycomb cell is determined by the gap between the plates. Increasing the gap from 1.5 mm to 3 mm results in doubling of the honeycomb cell size. A further increase of ethanol concentration leads to the appearance of a novel dynamic phase condensate [Fig. 1 and 1(d)]. The dynamic condensate is very different from the static precipitate observed for low ethanol concentrations and voltages: Almost all particles in the condensate 114301-2
VOLUME 90, N UMBER 11
PHYSICA L R EVIEW LET T ERS
week ending 21 MARCH 2003
FIG. 5 (color online). Time evolution of a pulsating ring. Movie 4 in [9] illustrates dynamics of pulsating ring.
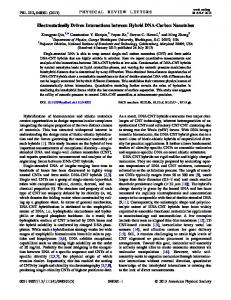
FIG. 4. Upper panel: Two horizontally rotating down t-vortices. Arrows indicate direction of horizontal rotation of binary t-vortices. Small arrows show particle trajectories at top plate for single vortex. Inset: Vertical cross section of vortex flow for down t-vortex. Lower panel: Time evolution of one rotating asymmetric down t-vortex. Movie 3 in [9] illustrates rotation of dtv conglomerates.
are engaged in a circular vortex motion in the vertical plane, resembling that of Rayleigh-Be´nard convection (see Fig. 4 [12]). The condensate coexists with the dilute granular gas. The direction of rotation is determined by the polarity of the applied voltage: Particles stream towards the center of the condensate near the top plate for upward field direction and vice versa. The direction of rotation is visible using particle-image velocimetry. In other words, for upward field direction, the particles stream down at the center of the condensate domain forming downward toroidal vortices [Fig. 1(c)]. Conversely, the particles form upward toroidal vortices for downward field direction. The toroidal vortices (t-vortices) attract each other and coalesce, resulting in large-scale dynamic condensates. The evolution of the condensates depends on the electric field direction. For downward field, large up t-vortices become unstable due to the spontaneous formation of voids in the condensate [Fig. 1(d)]. These voids exhibit complex intermittent dynamics. Medium-size clusters typically form only a single void and fascinating pulsating rings appear (see Fig. 5). In contrast, for upward field, large down t-vortices remain stable. In some cases, two or more down t-vortices merge into one, forming an asymmetric condensate which performs composite rotation in the horizontal plane (see Fig. 4). 114301-3
The honeycombs, Wigner crystals, and t-vortices are likely caused by the same mechanism. It is known that the electric field generates local EHD convective flow in charged liquid in the vicinity of microparticles [4 –6]. We observed that for the downward field direction the negatively charged liquid flows upwards around a stationary lying particle, creating an axially symmetric toroidal flow field. The upward flow induces a sweeping horizontal flow on the bottom plate toward the center of the precipitate. Such EHD-induced flow can assemble particles into a honeycomb structure. The proportionality of the honeycombs scale to the gap between plates supports the EHD convective mechanism for honeycomb formation (compared to Rayleigh-Be´nard convection). In the case of upward field direction, each particle induces a downward flow of the fluid and, consequently, a sweeping horizontal flow away from the center of a precipitate, leading to mutual repulsion and the formation of a Wigner crystal. For elevated concentrations of ethanol and higher voltages, particles begin to bounce between upper and lower plates. The bouncing particles attract each other near the positive electrode and repel each other near the negative electrode due to the EHD flows. Since the liquid in the bulk has negative charge, the electric field is larger near a positive electrode. Consequently, the particles tend to stay longer in the vicinity of the positive electrode, and a resulting mutual attraction dominates repulsion. Thus, the self-induced EHD flows are able to drag bouncing particles from the gas phase and assemble them into t-vortex condensates irrespectively of the field direction. This mechanism is consistent with the observation that particles stream outwards from the center of a down t-vortex on the bottom plate (as in the Wigner crystal) and inward towards the center, of an up t-vortex (as in honeycombs). Spontaneously formed voids in large, up t-vortices are inflated by EHD flow (similar to voids in a honeycomb structure), leading to persistent modification of the shape of the pulsating rings. The horizontal rotation of down t-vortices is likely due to the following effect. The axisymmetric t-vortex does not create vertical vorticity. Combining two (or more) t-vortices results in an 114301-3
PHYSICA L R EVIEW LET T ERS
VOLUME 90, N UMBER 11 15
down t−vortices
R (mm)
10
up t−vortices 5
0
6
10
8
12
t (sec) FIG. 6. Separation between two t-vortices R vs time t. Symbols show experimental data, dashed lines are fits R � �t0 � t�1=3 , for U � �800 V, C � 8% w=w (dtv), and U � 1900 V, C � 8% w=w (utv).
asymmetric S-shaped conglomerate (see Fig. 4) leading to nonzero projection of vorticity on the vertical axis, and, therefore, horizontal rotation. The selected results illustrating attraction between t-vortices are shown in Fig. 6. The separation between two t-vortices R is consistent with the following power law R � �t0 � t�1=3 , where t0 � const (error bars, however, are relatively large, about 5%–10%). This behavior yields the following expression for the attraction velocity V � dR=dt � ��=R2 , � � const, which strongly indicates the hydrodynamic character of the vortex interaction. An order-of-magnitude estimate of EHD velocity can be obtained from the balance of viscous (�r2 v) and electric (enE) forces acting on the charged liquid. Here, � � 5:6 � 10�4 Pa s is the viscosity of toluene and n is the ion concentration. Since the velocity varies on a characteristic scale of the order of the particle radius a, one can replace r2 with a�2 , and thus v � enEa2 =�. Taking n � 1016 m�3 gives an EHD velocity of �5 mm= sec at an applied voltage U � 500 V. This estimate is in qualitative agreement with the measured times of pattern formation and vortex attraction. We also carried out experiments with solutions of tetrabutylamonium tetraphenilborate (TBATPB) in toluene. This system shows the same phases but with opposite polarity of the applied voltage. The critical lines in the phase diagram of the TBATPB/toluene mixture have slopes opposite to that of the ethanol/toluene based phase diagram (see Fig. 3). This observation depicting reversal of behavior under opposite polarity indicates the presence of positive ions in the bulk of the solution. There is a significant body of research on the behavior of dielectric colloidal particles in aqueous solutions [see,
114301-4
week ending 21 MARCH 2003
e.g., Refs. [3–6]]. However, dynamic patterns were not observed. The main difference here is the presence of a thick spatially charged layer in the dielectric liquid. The fixed sign excess charge in the bulk results in a different kind of interaction between particles and the EHD flows. In conclusion, we report the discovery of a series of remarkably rich novel vortex phases and the dynamic assembly of electric field-driven conductive particles in poorly conductive fluids. Our results exemplify the importance of interactions between the particles and uncompensated ionic charges in the bulk of the liquid. Extension of our experiments toward self-assembly of submicron particles may have intriguing practical applications, such as lithographic patterning and assembly [3,5,13] etc. We are grateful to A. A. Abrikosov and V. M. Vinokur for fruitful discussions. This research was supported by the U.S. DOE, Grant No. W-31-109-ENG-38.
[1] I. S. Aranson, D. Blair, V. A. Kalatsky, G.W. Crabtree, W.-K. Kwok, V. M. Vinokur, and U. Welp, Phys. Rev. Lett. 84, 3306 (2000). [2] I. S. Aranson, B. Meerson, P.V. Sasorov, and V. M. Vinokur, Phys. Rev. Lett. 88, 204301 (2002). [3] R. C. Hayward, D. A. Saville, and I. A. Aksay, Nature (London) 404, 56 (2000). [4] M. Trau, S. Sankaran, D. A. Saville, and I. A. Aksay, Nature (London) 374, 437 (1995). [5] S.-R. Yeh, M. Seul, and B. I. Shraiman, Nature (London) 386, 57 (1997). [6] Y. Solomentsev, M. Bo¨hmer, and J. L. Anderson, Langmuir 13, 6058 (1997). [7] F. Nadal, F. Argoul, P. Hanusse, B. Pouligny, and A. Ajdari, Phys. Rev. E 65, 061409 (2002). [8] G. A. Voth, B. Bigger, M. R. Buckley, W. Losert, M. P. Brenner, H. A. Stone, and J. P. Gollub, Phys. Rev. Lett. 88, 234301 (2002). [9] See EPAPS Document No. E-PRLTAO-90-074311 for movies showing patterns and dynamics of granular media discussed in the text. A direct link to this document may be found in the online article’s HTML reference section. The document may also be reached via the EPAPS homepage (http://www. aip.org/pubservs/ epaps.html) or from ftp.aip.org in the directory /epaps/. See the EPAPS homepage for more information. [10] B. Meerson, Rev. Mod. Phys. 68, 215 (1996). [11] A. Kitahara, in Electric Phenomena at Interfaces. Fundamentals, Measurements and Applications, edited by A. Kitahara and A. Watanabe (Dekker, New York, 1984), p. 119. [12] E. Bodenschatz, W. Pesch, and G. Ahlers, Annu. Rev. Fluid Mech. 32, 709 (2000). [13] T. Deng, Y. H. Ha, J. Y. Cheng, C. A. Ross, and E. L. Thomas, Langmuir 18, 6719 (2002).
114301-4