Edge Detection Techniques For Extracting Linear Information In An Urban / Peri-Urban Environment Ourania D. MAVRANTZA and Demetre P. ARGIALAS
Key words: Remote Sensing, Algorithms, Feature, IKONOS, KVR-1000, Greece SUMMARY Photointerpretation of linear information is a subjective process and therefore there is a substantial need for automation of extracting linear information using automated techniques. Certain efforts were made in this direction including the application of edge enhancement and detection operators, wavelets, Hough Transform etc. However it is difficult to choose among optimal algorithms since the complex scenes portrayed on satellite images are strongly dependent on the radiometric and physical properties of the sensors and on the illumination properties and topographic relief of each scene. Therefore, the category of information to be extracted (scale and context) determines the “suitability” of the method applied for linear feature extraction. In this context, the objective of this work was the implementation, evaluation and comparison of selected optimal edge detection algorithms combined with complementary remote sensing methods towards automated linear feature extraction (roads, land use boundaries, buildings, etc) in an urban / peri-urban environment. The test areas used were located in the extended area Attica Prefecture. A multispectral IKONOS image and panchromatic KVR-1000 imagery of two different dates were acquired for the case studies of Aghios Stefanos and Penteli, Attica, Greece respectively and processed by the following edge detectors: (a) The Canny edge detection algorithm, (b) The Rothwell algorithm, (c) The LOG-LIN algorithm, (d) The SUSAN operator, (e) The anisotropic diffusion algorithm of Black, (f) The Bezdek algorithm and (g) The EDISON algorithm. The resulted edge maps were then compared to thematic maps resulted by applied remote sensing methods and techniques and assessed using statistical methodology. Finally, the performance and behavior of each algorithm for urban feature extraction was assessed as well as the sufficiency of the edge detection methodology for environmental change detection purposes.
Ourania Mavrantza and Demetre Argialas Edge Detection Techniques For Extracting Linear Information In An Urban / Peri-Urban Environment Spatial Information Management toward Legalizing Informal Urban Development FIG Commission 3 Workshop Athens, Greece, March 28-31, 2007
1/15
Edge Detection Techniques For Extracting Linear Information In An Urban / Peri-Urban Environment Ourania D. MAVRANTZA and Demetre P. ARGIALAS, Greece
1. INTRODUCTION The urban and peri-urban environment is a widely investigated research topic among geoscientists, as well as a very crucial subject for enforcing administrative and legal policies. Nowadays, new geo-data resources from high spatial resolution remote sensing sensors (e.g. IKONOS, Quickbird, KVR, etc) have the potential to improve mapping and analysis of urban land cover / land use structures and to monitor related dynamics. Remote Sensing methodology can provide very powerful tools and means for monitoring the change dynamics of the urban environment by exploiting the spectral and spatial information and context of these geo-data and for further decision-making. For many years, edge detection has been proved a very valuable tool for automating the extraction of information at a low level. The aim of edge detection is to extract features, as meaningful as possible depending on the physical illumination properties of an image. Edge detection techniques have been successfully applied in the domains of Computer Vision (Haralick, 1984, Canny, 1986, etc), Biomedicine (Bezdek, et.al., 1998), Geomorphology (Argialas and Mavrantza, 2004), etc. In this work, the application and performance of sophisticated and automated edge detection techniques is assessed using spectral and spatial information from high resolution images in an urban / peri-urban environment, as a stand-alone methodology and as a combined methodology with other remote sensing methods and techniques for extracting urban features of interest (building boundaries, road segments, etc). 1.1 Edge detection algorithms: An overview In image processing and computer vision, edge detection treats the localization of significant variations of a gray level image and the identification of the physical and geometrical properties of objects of the scene. The variations in the gray level image, commonly include discontinuities (step edges), local extrema (line edges) and junctions. Most recent edge detectors are autonomous and multi-scale and include three main processing steps: smoothing, differentiation and labeling. The edge detection algorithms vary according to these processing steps, to their goals, and to their mathematical and computational complexity (Ziou and Tabbone, 1997). Furthermore, contextual detectors have also been designed and implemented for the extraction of edges. Nevertheless, they are based on knowledge used to perform edge extraction and are considered as task-dependent. Similarly edge detection approaches are also based on snakes (Agouris et.al., 2001), statistical tools, and neural networks, but these approaches are not presented here.
Ourania Mavrantza and Demetre Argialas Edge Detection Techniques For Extracting Linear Information In An Urban / Peri-Urban Environment Spatial Information Management toward Legalizing Informal Urban Development FIG Commission 3 Workshop Athens, Greece, March 28-31, 2007
2/15
1.2 Motivation and aim From the thorough examination of the literature it is inferred that optimal edge detectors (e.g. the Canny algorithm) have already been successfully applied on natural scenes with quite satisfactory results (binary images with one-pixel thickness, efficient length and pixel connectivity), but have not been investigated on the context of an urban / peri-urban environment. Many remote sensing methods have been proposed in the literature for processing singleband and multi-band images, such as vector analysis, ICA mixture models, Support Vector Machines (SVMs), Markov Random Field (MRF) Models, band differencing, crosscorrelation analysis, object-oriented analysis, etc (Civco, 2002). Nevertheless, for change detection purposes the implementation and assessment of novel edge detection algorithms has never been combined to the results of remote sensing methods and techniques for change detection purposes, something that characterizes the present study. 2. METHODOLOGY 2.1 Study area and data used In the present study, different high resolution images were used, namely an IKONOS very high resolution (VHR) image of the extended area of Attica Prefecture (Aghios Stefanos area), with a spatial resolution of 1m-resampled and acquired in year 2000 (Figures 1 and 2) and a panchromatic KVR-1000, very high resolution imagery (spatial resolution of 1.5m) of the Penteli area for two dates of 1998 and 1992.
Figure 1: Pseudocolor composite RGB-421 of the IKONOS VHR multispectral image with spatial resolution of 1m-resampled and size 421x497 pixels.
Figure 2: Thematic overlay of photointerpreted and ground-verified building boundaries and road segments on the image of Figure 1.
Ourania Mavrantza and Demetre Argialas Edge Detection Techniques For Extracting Linear Information In An Urban / Peri-Urban Environment Spatial Information Management toward Legalizing Informal Urban Development FIG Commission 3 Workshop Athens, Greece, March 28-31, 2007
3/15
The main purpose for using the IKONOS image was the evaluation and comparison of selected optimal edge detection algorithms in a ”pure” urban / peri-urban environment, whereas the use of KVR-1000 images intended to accentuate the suitability of optimal edge detection methodology for environmental change detection purposes in a mixed (urban / periurban and forested) environment. Additionally, for the processing of KVR-1000 imagery, a supplementary vector layer containing forested areas and forests was used, which was derived from the interpretation of aerial ortho-rectified images of 1937 and the compilation with the information included in the maps of the Approved City Plan of Athens, valid since 1985 (APERTURE 2000, Karathanassi et.al. 2003). 2.2 Image pre-processing In the pre-processing stage, an IKONOS and two KVR-1000 images were geodetically transformed into the Transverse Mercator Projection and the Hellenic Geodetic Datum (HGRS87). The positional accuracy of the images was approximately from 1.5-3.0 meters for both images. For the implementation of the Pratt evaluation metric (which is in detail described in a following section), an ancillary ground truth (reference) file was required as input. This ground truth file was developed containing all the visually interpreted linear segments related to building boundaries as well as road segments, from the IKONOS image (and verified on the ground), represented with their X, Y coordinates and the total number of the actual edge points (in an ASCII format file). 2.3 Edge detection algorithms: Implementation and evaluation 2.3.1
Case study: IKONOS multispectral image – Aghios Stefanos area, Attica
On the band 4 of the IKONOS very high resolution image for the study area of Aghios Stefanos, Attica, the following edge detectors were selected, applied and assessed: (a) The Canny edge detection algorithm (Canny, 1986) (b) The Rothwell algorithm (Rothwell et.al., 1994) (c) The LOG-LIN algorithm (Iverson and Zucker, 1995) (d) The SUSAN operator (Smith and Brady, 1997) (e) The anisotropic diffusion algorithm of Black (Black, et.al., 1998) (f) The Bezdek algorithm (Bezdek, et.al., 1998), and (g) The EDISON algorithm (Meer and Georgescu, 2001) For each algorithm, the combinations of input parameter sets were selected based on trialand-error experiments and assessed (a) using mostly the performance evaluation measures of Pratt and Rosenfeld (Abdou and Pratt, 1979; Kitchen and Rosenfeld, 1981) (which will be explained below), and (b) by evaluating the optical correspondence to the ground map (Figure 2) for ensuring the “interpretability” of the output edge image. In this paper, the best results (qualitatively and quantitatively) of each edge detection algorithm are presented. Concerning the selection of the input parameters to the edge detection algorithms, the theoretical range of input parameter values were formed based on the initial values given by Ourania Mavrantza and Demetre Argialas Edge Detection Techniques For Extracting Linear Information In An Urban / Peri-Urban Environment Spatial Information Management toward Legalizing Informal Urban Development FIG Commission 3 Workshop Athens, Greece, March 28-31, 2007
4/15
the authors (algorithm designers), and were indicative for cases of edge detection on aerial images. The range of values used in this work is presented in Table 1 (Sarkar, et.al., 2001).
ALGORITHM
METHOD DESCRIPTION
VALUE RANGE OF INPUT PARAMETERS
I
II
III
Canny
First derivative of Gaussian function, non-maxima suppression, hysteresis thresholding
σ =0.2 - 2.0
Τlow = 0.2 - 0.6
Thigh = 0.5 – 0.9
Rothwell
Canny with topology added
σ =0.5 - 2.0
Τlow = 3.0 – 11.0
alpha = 0.8 - 0.9
LOG-LIN (IversonZucker)
Combination of Logical / Linear operators
T = 0.010 – 0.025
16 directions
64 degrees of freedom
EDISON (MeerGeorgescu)
Modified Canny with added measure of confidence and use of templates
a) gradient=2.0 – 3.0, b) minimum length=3.0 - 6.0 c) – e) Non-maxima suppression: Type = line / arc, Rank=0.5 – 0.6, Confidence=0.5 0.8 f) – h) Thigh for hysteresis: Type = box / arc, Rank =0.93-0.96, Confidence =0.94 - 0.98 i) – k) Tlow for hysteresis: Type = box / arc, Rank =0.92 – 0.95, Confidence =0.92 -0.99
Black
Robust anisotropic diffusion
σ =0.4 - 3.0
SUSAN (SmithBrady)
Isotropic (circular) detection filter (Univalue Segment Assimilating Nucleus USAN)
Τ = 20.0 - 45.0
Kernel size3x3
----
Bezdek
Sobel with TakagiSugeno geometric fuzzy model
Τau = 1.0 – 4.0
Binary Threshold [0,..,256] = 10- 100
----
----
----
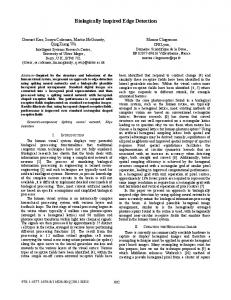
Table 1: Experimental value range of input parameters for the implementation and assessment of the selected edge detection algorithms. In the following figures, the output edge images are presented as derived from the application of the selected edge detection algorithms of Canny (Figure 3), of Rothwell (Figure 4) and of the LOG-LIN algorithm (Figure 5). The algorithm of Canny was applied on band 4 (nearinfrared) with input parameters σ=0.6 (standard deviation for the Gaussian function), Tlow=0.50 και Thigh=0.90 (these are the low and the high threshold values for the performance Ourania Mavrantza and Demetre Argialas Edge Detection Techniques For Extracting Linear Information In An Urban / Peri-Urban Environment Spatial Information Management toward Legalizing Informal Urban Development FIG Commission 3 Workshop Athens, Greece, March 28-31, 2007
5/15
of hysteresis thresholding). For the same region, the algorithm of Rothwell was applied using the following parameter values: σ=2.00, Tlow=8.00 και a=0.90. The input parameter values for the LOG-LIN algorithm by Iverson and Zucker were T=0.040 (threshold) , 16 directions and 64 degrees of freedom for the ”edge (E)” mode. In Figure 3, areas containing building boundaries are illustrated with green ellipses. The application of the algorithm of Canny extracted edges with edges visually compatible to the ”true” building boundaries, as presented in Figure 2. Indeed, the Canny algorithm did not detect junction edges (such as ”L”, ”Y” and ”T” edges), but it performed sufficiently in terms of ”high amount of extracted edges of interest”, especially for edges at areas of high contrast. In Figure 4, the output edge map of the Rothwell algorithm is presented. With a red ellipse an extracted juction edge is depicted, which was not apparent in the Canny output image. The Rothwell output image (Figure 4) provides poor ”interpretability” (as far as the identification of the semantic content is concerned, but on the other hand, edges with high connectivity, coherence and sufficient edge length were extracted. In Figure 5 the output image from the Iverson-Zucker is presented. The performance of the algorithm was sufficient in terms of ”image interpretability”, because the concept of the algorithm is based on the topological and structural features of the image.
Figure 3: Output edge map from the application of the Canny algorithm – study area of Aghios Stefanos (IKONOS – band 4).
Figure 4: Output edge map from the application of the Rothwell algorithm – study area of Aghios Stefanos (IKONOS – band 4).
Figure 5: Output edge map from the application of the LOG-LIN algorithm – study area of Aghios Stefanos (IKONOS – band 4).
Concerning the performance of the anisotropic diffusion algorithm by Black et.al. (Figure 6), the combination of anisotropic diffusion with the procedures of non-maxima suppression and hysteresis thresholding allowes the satisfaction of Canny’s criteria for single edge response, Ourania Mavrantza and Demetre Argialas Edge Detection Techniques For Extracting Linear Information In An Urban / Peri-Urban Environment Spatial Information Management toward Legalizing Informal Urban Development FIG Commission 3 Workshop Athens, Greece, March 28-31, 2007
6/15
edge coherence. Furthermore, Black’s algorithm proposes a new “edge-stopping” function based on Tukey’s biweight robust error norm, which improves the automatic stopping of the diffusion and therefore, preserves sharper boundaries, as also noted in Figure 6. In Figure 7, the output edge image from the application of the SUSAN algorithm on IKONOS – band 4 for T=50 is presented. In Figure 8 the output edge image from the application of the EDISON algorithm is presented using the following input parameters: (a) Gradient = 4.00, (b) Minimum edge length=7.00, (c)–(e) Non-maxima suppression: Type = line, Rank=0.5 and Confidence=0.5, (f)–(h) Thigh Hysteresis: Type = line, Rank==0.95 and Confidence =0.97, and (i)-(k) Tlow Hysteresis: Type = line, Rank =0.99 and Confidence =0.95. Finally, in Figure 9, the output edge image from the application of the Bezdek algorithm for the same study area is presented using Tau=2.00 and Binary_Threshold=60.00 as input parameter values. As noted in Figure 8 from the performance of the EDISON algorithm, additional junction edges (as presented in Figure 3 with a red ellipse) were extracted due to the embedding of the confidence measure into this modified version of the Canny algorithm, which controls the procedures of non-maxima suppression and hysteresis thresholding during the edge extraction.
Figure 6: Output edge map from the application of the Black algorithm – study area of Aghios Stefanos (IKONOS – band 4) for σ=2.5.
Figure 7: Output edge map from the application of the SUSAN algorithm στην – study area of Aghios Stefanos (IKONOS – band 4) for Τ=50.
Finally, the Bezdek algorithm (Figure 9) performed quite sufficiently for the extraction of meaningful edges. Since, it was based on a modification of the Sobel operator, it means that the algorithm does not ensure the extraction of single-pixel thick edges, which leads to the necessity of following thresholding procedures. Ourania Mavrantza and Demetre Argialas Edge Detection Techniques For Extracting Linear Information In An Urban / Peri-Urban Environment Spatial Information Management toward Legalizing Informal Urban Development FIG Commission 3 Workshop Athens, Greece, March 28-31, 2007
7/15
After the qualitative (visual) assessment of the edge detection output images, followed quantitative evaluation and assessment of the employed edge detection algorithms with two evaluation metrics, namely: (1) The Rosenfeld evaluation metric (E1), which is based on the local edge coherence and measures how well an edge fits to the local neighborhood of edge pixels but it does not concern itself with the actual position of the edge, therefore it is a supplement to Pratt’s evaluation metric (Parker, 1997), and (2) The Pratt evaluation metric (E2), which is a formulated function of the distance between correct and measured edge positions, but it is also indirectly related to the false positive and false negative edges. Pratt’s metric is considered to be a performance evaluation measure that requires ground-truth files. Therefore, it is directly related to the actual position of the edge pixels and serves as a more objective quantitative evaluation measure (Parker, 1997). In the following table (Table 2), the resulted values from the performance evaluation metrics are presented using the selected edge detection algorithms on the band 4 of the IKONOS VHR image.
Figure 8: Output edge map from the application of the EDISON algorithm – study area of Aghios Stefanos (IKONOS – band 4) for (a) Gradient = 4.00, (b) Minimum edge length=7.00, (c)–(e) Non-maxima suppression: Type = line, Rank=0.5 and Confidence=0.5, (f)–(h) Thigh Hysteresis: Type = line, Rank==0.95 and Confidence =0.97, and (i)-(k) Tlow Hysteresis: Type = line, Rank =0.99 and Confidence =0.95.
Figure 9: Output edge map from the application of the Bezdek algorithm – study area of Aghios Stefanos (IKONOS – band 4) for Τau=2.00 and Bin_Thres=60 (DN value between 0-255).
Ourania Mavrantza and Demetre Argialas Edge Detection Techniques For Extracting Linear Information In An Urban / Peri-Urban Environment Spatial Information Management toward Legalizing Informal Urban Development FIG Commission 3 Workshop Athens, Greece, March 28-31, 2007
8/15
RESULTED VALUES OF PERFORMANCE EVALUATION METRICS Rosenfeld METRIC
Rosenfeld METRIC
Rosenfeld METRIC
CANNY
ROTHWELL BLACK
0,6697
0,6915
Pratt METRIC
Pratt METRIC
CANNY
ROTHWELL BLACK
0,5290
0,4811
Rosenfeld METRIC
Rosenfeld METRIC
SUSAN
LOG-LIN BEZDEK
EDISON
0,6470
0,7536
0,6372
Pratt METRIC
Pratt Pratt METRIC METRIC
0,4530
Rosenfeld Rosenfeld METRIC METRIC
0,7708
0,6695
Pratt METRIC
Pratt METRIC
SUSAN
LOG-LIN BEZDEK
EDISON
0,5785
0,5984
0,4989
0,5340
Table 2: Resulted values of performance evaluation metrics (Metrics of Pratt and Rosenfeld) from the application of the selected edge detection algorithms. 2.3.2
Case study: KVR-1000 panchromatic imagery – Penteli area, Attica
In addition to the assessment of edge detection procedure to the single-date IKONOS VHR image, the same edge detection algorithms were applied and assessed to a subset of a multitemporal KVR-1000 imagery (for years 1988 and 1992), which covers the area contained in the maps of the Approved City Plan of Athens. For better visualization purposes, the KVR1000 images were magnified to give a better aspect of the area of interest. Due to limitation of the paper length, the output images from the application of the Canny algorithm for both dates are presented, in order to prove the sufficient performance of the edge detection methodology and its contribution to change detection. The remote sensing methodology used for the processing of the KVR-1000 imagery included the following techniques: (1) Calculation of the Band Difference Image between both dates, (2) Convolution of texture filters (calculation of skewness and variance) with a 3x3 and 5x5 kernel size and (3) Production of the “Highlight image” classification map based on the difference image between 1988 and 1992. In this paper, the output images from processing steps (1) and (3) are presented. More specifically, in Figure 10, is presented the coverage containing the polygons of the forested areas and forests (red colored) according to the Approved City Plan of Athens overlaid on the Band Difference output image of the KVR-1000 imagery. Regions with a high degree of land cover change between 1988 and 1992 appear very bright. In Figure 11 the same polygon coverage (blue outline) is overlaid on the “Highlight Changes” output image of the initial KVR-1000 images, which depicts land cover changes between 1988 and 1992. The “Highlight Change” Image is a five-class thematic image, typically divided into the five categories of “Background” (black), “Decreased” (red), “Some Decrease” (turquoise), “Unchanged” (light green), “Some Increase” (orange), and “Increased” (dark green).
Ourania Mavrantza and Demetre Argialas Edge Detection Techniques For Extracting Linear Information In An Urban / Peri-Urban Environment Spatial Information Management toward Legalizing Informal Urban Development FIG Commission 3 Workshop Athens, Greece, March 28-31, 2007
9/15
Figure 10: Overlay of the forest and urban plan coverage (red polygons) on the Band Difference output image of the KVR-1000 images, which depicts land cover changes between 1988 and 1992 (magnified).
Figure 11: Overlay of the forest and urban plan coverage (blue polygons) on the “highlight changes” output image of the initial KVR-1000 images, which depicts land cover changes between 1988 and 1992.
In Figures 12 and 13, on the left are presented the output images derived from the application of the Canny algorithm with input parameters σ=1.5, Τlow=0.5 and Thigh=0.9 for the dates 1988 and 1992 respectively, whereas on the right are presented the original KVR-1000 images for both dates. In Figure 12, areas of change appeared with high reflectance values were extracted as connected regions. In Figure 13, areas with high reflectance values (high contrast) are extracted as connected regions, while dark areas (forested) are not extracted. The appearance of urban extension in the period 1998-1992 (red ellipse- delineated area) should also be noticed from the comparison of the output edge maps and the corresponding original KVR-1000 images, for the same time period.
Ourania Mavrantza and Demetre Argialas Edge Detection Techniques For Extracting Linear Information In An Urban / Peri-Urban Environment Spatial Information Management toward Legalizing Informal Urban Development FIG Commission 3 Workshop Athens, Greece, March 28-31, 2007
10/15
Figure 12: Left: Output image derived from the application of the Canny algorithm with input parameters σ=1.5, Τlow=0.5 and Thigh=0.9. Right: The original KVR-1000 image acquired in year 1988. Note that areas with high reflectance values are extracted as connected regions.
Figure 13: Left: Output image derived from the application of the Canny algorithm with the same input parameters as in Figure 12. Right: The corresponding original KVR-1000 image acquired in year 1992. Note that areas with high reflectance values (high contrast) are extracted as connected regions, while dark areas (forested) are not extracted. Also note the appearance of urban extension in the period 1998-1992 (red ellipse- delineated area). Ourania Mavrantza and Demetre Argialas Edge Detection Techniques For Extracting Linear Information In An Urban / Peri-Urban Environment Spatial Information Management toward Legalizing Informal Urban Development FIG Commission 3 Workshop Athens, Greece, March 28-31, 2007
11/15
3. RESULTS AND DISCUSSION From the analysis of the implementation and assessment of all edge detection algorithms it is inferred that, all algorithms (excluding the EDISON and Canny algorithm), poorly extracted those edges of low-contrast features. On the contrary, all edge detection algorithms performed quite sufficient the extraction of edges of high-contrast features (Figures 3-9, 1213). From the analysis of the results of edge detection performance evaluation it was observed that all edge detection algorithms provided a sufficiently high value range of the Rosenfeld metric (0.63-0.77), which implies that these algorithms extracted edges with good connectivity and edge coherence. Furthermore, resulted values from the Pratt metric ranged between 0.48 0.57. This implies that a relatively high number of meaningful edges was extracted. On the other hand, for algorithms that did not embedd any thresholding and thinning process (e.g. the Bezdek algorithm), the high value of the Pratt metric could be affected, because the extracted edges of the particular algorithm have edge pixel thickness greater that 1 pixel and the Pratt metric does not ”penalize” the extraction of redundant edges as in the case of omitted edges. CONCLUSIONS One main aspect from applying the edge detection algorithms is their good performance in terms of coherence, edge localization and high edge response, and therefore they provide useful tools towards automated urban / peri-urban mapping. Furthermore, the application of sophisticated edge detection algorithms could successfully perform as a stand-alone methodology where edges can be extracted with high positional accuracy, as well as combined with supplementary remote sensing and GIS methods in order to provide powerful tools for environmental change detection and decision-making based on environmental legislation enforcement. REFERENCES Abdou, I. E. and W. K. Pratt, 1979. Quantitative Design and Evaluation of Enhancement / Thresholding Edge Detectors. Proceedings of IEEE, 67(5), pp. 753-763. Agouris, P., A. Stefanidis and S. Gyftakis, 2001. Differential snakes for change detection in road segments. Photogrammetric Engineering and Remote Sensing, 67(12), pp. 1391-1399. APERTURE, 2000, Data Processing – Analysis Document – Greek case study, Laboratory of Remote Sensing, NTUA, Athens, Greece. Bezdek, J. C., R. Chandrasekhan and Y. Attikiouzel, 1998. A geometric approach to edge detection. IEEE Transactions. on Fuzzy Systems, 6, pp. 52-75. Black, M., G. Sapiro, D. Marimont and D. Heeger, 1998. Robust Anisotropic Diffusion. IEEE Transactions on Image Processing, 7, pp. 421-432. Ourania Mavrantza and Demetre Argialas Edge Detection Techniques For Extracting Linear Information In An Urban / Peri-Urban Environment Spatial Information Management toward Legalizing Informal Urban Development FIG Commission 3 Workshop Athens, Greece, March 28-31, 2007
12/15
Canny, J. F., 1986. A computational approach to edge detection. IEEE Transactions. on Pattern Analysis and Machine Intelligence, 8, pp. 679-714. Haralick, R. M, 1984. Digital step edges from zero crossing of second directional filters. IEEE Transactions on Pattern Analysis and Machine Intelligence, Vol. PAMI-6, pp. 58–68. Civco, D. L., J. D. Hurd, E. H. Wilson, M. Song and Z. Zhang, 2002. A comparison of land use and land cover change detection methods, http://resac.uconn.edu/publications/tech_papers/Land_Cover_Change_ASPRS2002.pdf. Iverson, L. A. and S. W. Zucker, 1995. Logical / linear operators for image curves. IEEE Transactions on Pattern Analysis and Machine Intelligence, 17(10), pp. 982-996. Karathanassi, V, Ch. Iossifidis and D. Rokos, 2003. Remote Sensing methods and techniques as a tool for the implementation of environmental legislation. The Greek Forest Law case study. International Journal of Remote Sensing, 24(1), pp. 39-51, Taylor and Francis. Kitchen, L. and A. Rosenfeld, 1981. Edge Evaluation using Local Edge Coherence. IEEE Transactions on Systems, Man and Cybernetics, 11(9), pp. 597-605. Argialas, D. P. and O. D. Mavrantza, 2004. Comparison Of Edge Detection And Hough Transform Techniques In Extraction Of Geologic Features. In Proceedings of the XXth ISPRS Congress of the International Society of Photogrammetry and Remote Sensing, 12-23 July 2004, Istanbul, Turkey, pp. 790-795, Vol. IAPRS-XXXV, ISSN 1682-1750. Meer, P. and B. Georgescu, 2001. Edge detection with embedded confidence. IEEE Transactions on Pattern Analysis and Machine Intelligence., PAMI-23, pp. 1351-1365. Parker, J. R., 1997. Algorithms for Image Processing and Computer Vision, Chapter 1: Advanced Edge-Detection Techniques: The Canny and the Shen-Castan methods, pp. 1-67, John Wiley and Sons, New York. Rothwell, Ch., J. Mundy, B. Hoffman and V. Nguyen, 1994. Driving Vision by Topology. TR-2444 – Programme 4, pp. 1-29, INRIA, France. Sarkar, S. and K. L. Boyer, 1991. On Optimal Infinite Impulse Response Edge Detection Filters. IEEE Transactions on Pattern Analysis and Machine Intelligence, Vol. PAMI – 13, No. 11, pp. 1154-1171. Smith, S. M. and J. M. Brady, 1997. SUSAN-A New Approach to Low Level Image Processing. International Journal of Computer Vision, 23(1), pp. 45-78. Ziou, D. and S. Tabbone, 1997. Edge Detection Techniques – An Overview. TR-195, Département de Math et Informatique, Université de Sherbrooke, pp. 1-41, Québec, Canada. ACKNOWLEDGEMENTS Ourania Mavrantza and Demetre Argialas Edge Detection Techniques For Extracting Linear Information In An Urban / Peri-Urban Environment Spatial Information Management toward Legalizing Informal Urban Development FIG Commission 3 Workshop Athens, Greece, March 28-31, 2007
13/15
This work was based on data (IKONOS image) and methodology fully conducted under the “EPEAEK- PYTHAGORAS-II” Research Program - National Technical University of Athens, Greece. The ”PYTHAGORAS-II” Project is a part of the Operational Program for Educational and Vocational Training II (EPEAEK-II) , which is co-funded by the European Social Fund (75%) and National Resources (25%). We would also like to thank the Robotics and Image Analysis Laboratory at the University of West Florida (UWF) for their TS4 code (Bezdek algorithm), and the Remote Sensing Laboratory of the School of Rural and Surveying Engineering (NTUA, Athens) for the kind provision of the KVR-1000 imagery and the GIS layer of digitized polygons of legal forest and urban areas. BIOGRAPHICAL NOTES Ourania MAVRANTZA received her Diploma from the Aristotle University of Thessaloniki (School of Rural and Surveying Engineering) in 1997 and her PhD in Remote Sensing from the National Technical University of Athens (School of Rural and Surveying Engineering) in 2005. She is working as a Quality Control Executive at the Department of Program Support in KTIMATOLOGIO S.A. since 2006. Since 2005 she is serving on the following professional Committees: (a) Special Scientific Committee of Photogrammetry, Cartography and Remote Sensing for Surveying Engineers - Hellenic Technical Chamber and (b) Working Group for the NSRF 2007-2013. Her scientific interest is focused in (1) remote sensing and GIS methods and techniques for processing multispectral and high-resolution data and (2) cadastral geo-data profiles. Dr. Mavrantza has participated in 7 Research Programs (as a fullor part-time researcher) at the School of Rural and Surveying Engineering (Remote Sensing Laboratory), the School of Electrical and Computer Engineering (Multimedia Laboratory), the National Observatory of Athens (Institute of Space Applications) and the NCSR “Demokritos” (Computational Intelligence Laboratory), since 1999 up to date. She has published over 16 papers. Demetre P. ARGIALAS received his Diploma, MS, and PhD degrees from The National Technical University of Athens (Rural and Surveying Engineering), The University of Tennessee (Engineering Science), and The Ohio State University (Civil Engineering), correspondingly. He was an Assistant Professor of the Civil Engineering Department at The Louisiana State University, Baton Rouge, Louisiana, from l985 to 1991, and then an Assistant, Associate and now Professor in the School of Rural and Surveying Engineering at the National Technical University of Athens. He has taught courses in photo-interpretation, remote sensing, digital image analysis, terrain analysis, knowledge-based expert systems, numerical analysis, and engineering surveying. His research interests are in computer vision for remote sensing, knowledge representation techniques for terrain analysis, image interpretation, GIS and digital mapping. Dr. Argialas has participated in a more than eighteen projects. He has published more than ninety papers. Dr. Argialas is a registered surveyor (Greece) and member of a number of professional organizations. He has served on the following professional committees: Knowledge-Based Expert Systems (ASPRS), Engineering Applications of Remote Sensing (ASCE), the TRB A5008-Committee on Expert Systems and the TRB Committee on Photogrammetry and Aerial Surveys (A2A0l). He has Ourania Mavrantza and Demetre Argialas Edge Detection Techniques For Extracting Linear Information In An Urban / Peri-Urban Environment Spatial Information Management toward Legalizing Informal Urban Development FIG Commission 3 Workshop Athens, Greece, March 28-31, 2007
14/15
been a reviewer for ASCE, ASPRS, IEEE, TRB, WARM, session chairman for ASPRS and Guest Editor for PE&RS (ASPRS). CONTACTS Edge Detection Techniques For Extracting Linear Information In An Urban / Peri-Urban Environment, Ourania Mavrantzaa and Demetre Argialasb a
KTIMATOLOGIO S.A. (Hellenic Cadastral Agency) Messogion Ave 339, 152 31 Halandri Athens GREECE +30-210 6505848 +30-210 6537723
[email protected] http://www.ktimatologio.gr
b
Laboratory of Remote Sensing, School of Rural and Surveying Engineering, National Technical University of Athens Heroon Polytechneiou 9, 157 80 Zografos Athens GREECE +30-210 7722595
[email protected] http://www.survey.ntua.gr/main/labs/rsens/rsens-e.html
Ourania Mavrantza and Demetre Argialas Edge Detection Techniques For Extracting Linear Information In An Urban / Peri-Urban Environment Spatial Information Management toward Legalizing Informal Urban Development FIG Commission 3 Workshop Athens, Greece, March 28-31, 2007
15/15