under study is that of the Survey of Cattle Slaughter in Mexico's Munici- ..... retariat of Agriculture (SAGARPA, 2005, www.sagarpa.gob.mx/ganaderito) and.
Journal of Data Science 8(2010), 555-577
Edition and Imputation of Multiple Time Series Data Generated by Repetitive Surveys
1 Instituto
Victor M. Guerrero1,2 and Blanca I. Gaspar2,3 Tecnol´ ogico Aut´ onomo de M´exico, 2 Instituto Nacional de Estad´ıstica y Geograf´ıa and 3 Banco de M´exico
Abstract: This paper considers the statistical problems of editing and imputing data of multiple time series generated by repetitive surveys. The case under study is that of the Survey of Cattle Slaughter in Mexico’s Municipal Abattoirs. The proposed procedure consists of two phases; firstly the data of each abattoir are edited to correct them for gross inconsistencies. Secondly, the missing data are imputed by means of restricted forecasting. This method uses all the historical and current information available for the abattoir, as well as multiple time series models from which efficient estimates of the missing data are obtained. Some empirical examples are shown to illustrate the usefulness of the method in practice. Key words: Compatibility tests, mean square error, missing data, restricted forecasts, VAR models.
1. Introduction The National Institute of Statistics and Geography (INEGI) carries out the Survey of Cattle Slaughter in Mexico’s Municipal Abattoirs (ESGRM for its name in Spanish). This repetitive survey captures monthly data for each abattoir in a questionnaire that asks questions about the slaughter of cattle for human consumption. Four species of animals are considered here: cattle, swine, sheep and goats. Even though INEGI puts a lot of effort to collect and publish trustworthy data, it is a fact that the quality of some statistical figures published by this official statistical agency can still be greatly improved. Such is the case of the data generated by the ESGRM, since this survey presents the typical problems of: (1) inconsistency of the collected data (the informant at the abattoir responded to the questionnaire, but the answers are not considered valid by some criteria used to verify the information), and (2) missing data (at least one of the variables lacks its value requested in the questionnaire). These problems create the necessity of applying statistical procedures for editing and imputing data. Such tasks should
556
Victor M. Guerrero and Blanca I. Gaspar
be done for each questionnaire (at the abattoir level) to avoid the accumulation of errors when aggregating data of two or more abattoirs. Therefore, it is desirable to use editing and imputing procedures with solid statistical foundations, which can also be computationally automated for massive and repetitive application (in all the municipal abattoirs, month after month). In this work we propose a statistical methodology that is supported by multiple time series models. These models take into account historical information on the variables under study as well as their possible interrelations. The following three basic variables of the ESGRM were considered relevant: (1) number of heads (number of animals that are introduced alive to the abattoir), (2) weight on the hoof (weight of the live animal when entering the abattoir) and (3) weight of the beef carcasses (weight of the slaughtered animal after taking out some of its parts, like its skin, its head and its offal). There is a large body of literature dealing with the problem of missing data in different types of surveys. We refer the reader to such authoritative works as Little and Rubin (1987) and Schafer (1997) for tools designed to perform statistical analysis of incomplete multivariate observations and to Zhang (2003) for a review of multiple imputation methods in use nowadays. Here we just consider the issue of imputation without taking into account the subsequent analyses of the data, because INEGI is a national statistical agency in charge of collecting and publishing data for the general public and it does not necessarily analyze the data. With regard to the missing data problem in a univariate time series setting, some influential works are those of Kohn and Ansley (1986) and G´omez et al. (1999), although some other works have appeared in the literature (e.g. Guerrero, 1994). All these works suggest building an Auto-Regressive Integrated Moving Average (ARIMA) model for the available data, then use all the data (observed before and after the missing ones) to get efficient estimates of the unobserved values. The problem in this context is also known as interpolation and it consists in essence of predicting the outcome of the unobserved variable by means of the expected value of the predictive distribution. A particular work that deals with edition and imputation, considered as tools for quality control of univariate time series data, is that of Caporello and Maravall (2002). In the multiple time series case we found only a few proposals, even though the problem appeared in the literature as early as 1974. The solution proposed by Sargan and Drettakis (1974) was very thorough, but the authors accepted explicitly that their method was difficult to apply in practice. The proposal by Luce˜ no (1997) is more general than the previous one, since it can be used with vector Auto-Regressive and Moving Average (ARMA) models, but it relies on Maximum Likelihood Estimation, so that it also becomes difficult for massive
Edition and Imputation of Time Series
557
application. Pfefferman and Nathan (2002) suggested another method, based on a multivariate state-space representation of the time series that relies also on Maximum Likelihood Estimation. The procedure suggested here differs from the already existing methods in that it is designed for a multiple time series that can be represented by a simple VAR (Vector Auto-Regressive) model that can be efficiently estimated by Ordinary Least Squares, equation by equation, a fact that simplifies considerably its practical implementation. It should be noticed that all the aforementioned methods aim to produce minimum Mean Square Error (MSE) estimates of the missing values. This fact differs from the usual approach used to impute values by drawing simulated values from a predictive distribution. An exception is Pfefferman and Nathan (2002) who did obtain the simulated values to represent uncertainty more appropriately. Thus, in our case we do not attempt to refer to the imputed values as simulated individual observations, but as estimated expected values. In the next section we describe the ESGRM and present some graphs that allow us to appreciate the typical dynamic behavior of the variables under study, along with some suggested transformations, which will serve mainly to edit the data. In the section after we present the VAR model and the restricted forecasting methodology that will be used to impute the missing data. Then, we present some aspects of the model building process and the estimation results, for the abattoir and animal species under consideration. Afterwards we present some results produced by the methodology, as much in the edition as in the imputation of data for the ESGRM. In that section we also show the results of some simulations carried out to verify the effectiveness of the method in practice. We conclude with some practical considerations. 2. Preliminary Data Analysis The ESGRM covers the 31 States of Mexico where abattoirs are in operation. This study made use of data from the abattoirs of a State whose name is omitted for confidentiality reasons. Only the results of one abattoir will be used to illustrate the methodology, although the intention is to apply it to all the existing municipal abattoirs in the country (this number changes every year, there were 907 abattoirs in December, 2004 and 890 in December, 2007). The sample period covers data from January of 1998 to December of 2003, since those were the historical data available in the more recent annual publication (see INEGI, 2004) at the beginning of the study. It should be stressed that we had data up to December, 2003 and that we required estimating old data to get a complete record of multiple time series in order to build a model and start the repetitive (monthly) application of our methodology. The joint dynamic behavior of the three variables for each abattoir of the State in consideration was represented by a VAR model. We searched for a generic model and found
558
Victor M. Guerrero and Blanca I. Gaspar
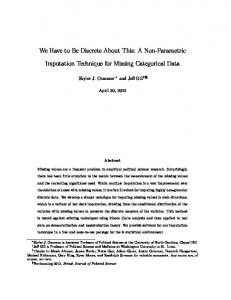
a specification that provides reasonably valid results, in statistical terms, for all the abattoirs of the State. 2.1 Definition of concepts The following concepts are used in the ESGRM. A municipal abattoir is the basic unit of observation, defined as the building where the slaughter of animals for human consumption takes place. The animal species considered are: cattle (includes bulls, oxen, cows, heifers and yearling calves), swine (includes pigs), sheep (includes lambs), and goats. Two constructed variables: average weight on the hoof (weight on the hoof divided by number of heads) and yield of meat (ratio of weight of the beef carcass to weight on the hoof) were used to validate the collected data. We observed that these variables tend to stay near a constant value for several consecutive months. In Figure 1 we show an example of this phenomenon for an abattoir, called A for confidentiality of the data. The species slaughtered are cattle and swine. Average weight g
440
Yield of meat
.68
420
.64
400
.60
380
.56
360
.52
340
.48
320
.44
300
.40 .36
280 1998
1999
2000
2001
2002
2003
1998
1999
2000
2001
2002
2003
Figure 1: Average weight on the hoof and yield of meat (Cattle)
The basic behavior observed in these graphs is repeated for all the animal species and abattoirs in consideration. This fact led us to think that the informants tend to report numbers close to the average values or within certain bounds of the constructed variables. The data are usually reported with evident errors and the INEGI personnel edit some of those errors when capturing the data every month, since this is a repetitive survey. Even with this first validation of data, several inconsistencies remain unnoticed by the capture personnel. Besides, some new errors are introduced when capturing the data. Thus, in order to correct these errors in a systematic way, we propose to start the editing process by taking into account the permissible values of the constructed variables. The aggregated
Edition and Imputation of Time Series
559
figures for all the abattoirs in each Mexican State that appear in INEGI (2004) are official and definitive, nevertheless it was necessary to perform a preliminary analysis of the data pertaining to each and every abattoir under study to make sure that all the data were within the permissible limits. This was done for each and every variable. In fact, if a recorded observation of a variable fell outside those limits, it was replaced by a permissible value, while the observations of the remaining variables were not affected. This way we obtained a set of edited historical time series. Then, we applied some transformations that allowed us to see the natural variability of the data more clearly and proceeded to build multiple time series models, as described below. The transformation procedure must be applied month after month as new data arrive, in order to force them to be consistent with each other and with their historical records. Afterwards, we can use the imputation methodology to estimate missing data in the transformed scale by means of restricted forecasting. The restricted forecasts provide optimal estimates (in a statistical sense defined below) of the missing data. Finally, we retransform the estimates back to the original scale of the variables. 2.2 Transformation of variables The transformations used are intended to complement the data edition in such a way that the transformed data satisfy the criteria that informants have been trying to apply routinely, although in an informal way. Therefore, transformation of the data is a fundamental part of the editing procedure. The variables are defined for month t as follows; N Ht denotes number of heads, W Ht weight on the hoof measured in kilograms, and W Bt weight of beef carcasses also measured in kilograms. Since 0 < N Ht for t = 1, ..., N , the proposed transformation becomes ) ( N Ht