Efficient Line-of-Sight Algorithms for Real Terrain Data Roberto de Beauclair Seixas1,2 Maurício Riguette Mediano2 Marcelo Gattass2 IMPA – Instituto de Matemática Pura e Aplicada Visgraf – Laboratório de Visão e Computação Gráfica Estrada Dona Castorina, 110 22460-320 – Rio de Janeiro, RJ
[email protected] PUC-Rio – Pontifícia Universidade Católica do Rio de Janeiro TeCGraf – Grupo de Tecnologia em Computação Gráfica Rua Marquês de São Vicente, 225 22453-900 – Rio de Janeiro, RJ {tron,mediano,gattass}@tecgraf.puc-rio.br
Resumo: Este artigo descreve duas abordagens para o cálculo de visibilidade entre objetos em um terreno real. Nosso objetivo é determinar um algoritmo eficiente de visualização para elementos de combate em uma simulação de guerra, tais como soldados, tropas, veículos, navios e aeronaves, permitindo assim um ambiente de combate simulado. Palavras-Chave: Visibilidade; Modelos de terreno; SIG; Visualização em tempo real.
Abstract: This article describes two approaches for computing the line-of-sight between objects in real terrain data. Our purpose is to find an efficient algorithm for combat elements in warfare simulation such as soldiers, troops, vehicles, ships, and aircrafts, thus allowing a simulated combat theater. Keywords: Line-of-sight algorithm; terrain model; GIS; real-time visualization.
1. Introduction Line-of-sight computation is a fundamental step in interactive games over terrain models. For each step of the game, objects change their positions in the terrain, and the new possible actions depend on their pairwise visibility. Essentially, one object is visible to another if the line segment that joins them does not intercept any terrain elevation. There are important applications, such as military training, in which the terrain model is very complex and the objects are grouped in a huge hierarchical structure. In these applications, several layers of information about the terrain and the environment are required to compute the visibility between objects. For example, the vegetation can hide an object and can also severely reduce the visibility of the objects that are embedded it. Visibility is also affected by the time of the day, sun position regarding movement direction, and weather conditions. Other relevant layers include roads, bridges, mined fields, etc., which can also change during the game simulation. Destruction, creation and repair of bridges, building and removal
of mined fields, and creation of craters are examples of game actions that change the terrain data. Although they do not interfere with the visibility computations, they are required for many other game events, such as “trafficability” (which defines the speed in which a given object can move). All terrain layers must be combined in an overlay layer that supports the game simulation. This overlay usually produces a very refined terrain model. Figures 8, 9, and 10 illustrate the complexity of three overlay layers. The combination of these figures would produces an even more refined terrain model. Line-of-sight algorithms must be very efficient to reach real time game simulation in this “dynamic” and highly refined terrain model. The representation of this model in the computer requires some discretization either by a Triangle Irregular Network (TIN) or by a regular grid. In this work we evaluate two algorithms for the visibility calculation, one for each discretization model. The first one is based on access methods used in Geographical Information Systems (GIS) that uses the R3-Tree [Gut84]. The second algorithm is an adaptation of the Computer Graphics terrain visualization algorithms based on height maps [GGP97,SGP97]. In Section 2 we discuss basic concepts of access methods used on GIS databases to support the following section, which describes the algorithm based on the R3-Tree. Section 4 presents the algorithm based on height map, and Sections 5 and 6 present results and conclusions, respectively.
2. Access Methods Given a terrain elevation E and two spatial objects represented by two points A and B (combat elements), this work concentrates on the visibility test between A and B on terrain E. Or, rather, we want to compute, in an efficient way, if there is any obstacle of E blocking the visibility between A and B. In the first algorithm we concentrate on performing this computation based on a TIN model. In this context the visibility test can be expressed as the following spatial query: is there an intersection between the line segment AB and any of the triangles of E? Access methods in GIS are specialized data structures that efficiently store and query huge amounts of spatial data in secondary memory. Guttman [Gut84] proposed a index scheme based on a simple and efficient data structure known as R-Tree. The R*-Tree, a variant of the R-Tree, was proposed by Beckmann and others [BKSS90], and has been widely accepted as a spatial access method for query optimizations involving spatial attributes in GIS. Other variants were also proposed: Roussopoulos and Leifker [RL85] proposed an algorithm for the generation of a static version of the R-Tree; Kamel and Faloutsos [KF92] proposed Parallel with the purpose of exploring the parallelism to increase the efficiency of the R-Tree; Lo [LR94] proposed Seeded-Tree to store intermediary results in the calculation of spatial joins; and Berchtold and others [BKK96] proposed X-Tree to store
bounding boxes in higher dimensional space. In the context of this work, we call R3-Tree an R*-Tree that stores 3D bounding boxes in the ℜ3. Brinkhoff and others [BHKS93,KSB93] have said: “Due to the high complexity of objects and queries and also to the huge volume of data, the systems of spatial databases impose strong restrictions to the performance of the queries processing.” They proposed architecture in multiple steps for the processing of spatial queries. We can divide that architecture in two main steps: a filtering step and a refinement step, as illustrated by Figure 1.
Figure 1: Multiple step architecture for query processing. The filtering step uses the bounding box of the geometric representation of the spatial attributes stored in the R*-Tree index. The main task of this step is to restrict the group of objects that are candidates to the refinement step, which, on its turn, consists of solving, through the exact geometric representation of the spatial attribute, the part of the query that was not solved by the filtering step. In general, the refinement step is the most time consuming one because it requires the geometric representation of the spatial attribute and usually makes complex geometric calculations. To simplify these complex computations, the initial proposal of the multiple step architecture uses the TR-Tree [SK91] in the refinement step to represent the exact geometry of the spatial attributes.
3. R3-Tree Given a set TE of triangles that describes a terrain elevation E, each triangle ti ∈ TE can be inserted in an R3-Tree with its 3D bounding box and a reference for its geometry (vertices). Let AB be the straight-line segment that connects two points A and B. The visibility test between A and B can be computed as an intersection test: for each triangle ti, test if it intersects the segment AB. If an intersection occurs there is no visibility between A and B; otherwise, they are visible to each other.
The use of R3-Tree in this work is a classic example of the multiple step architecture illustrated in Figure 1. In the filtering step we test the intersection of the bounding box of the segment AB with the bounding boxes of the intermediary nodes of R3-Tree and with the bounding boxes of the triangles in the leaves of R3-Tree. The triangles whose bounding boxes intercept the bounding box of the segment AB go on to the refinement step (Figure 2). The refinement step tests the intersection between the line segment AB and the geometry of the triangles. That is, no bounding box is used in this step. Notice that the intersection test between two bounding boxes, in the filtering step, is faster than the intersection test between the straight-line segment and the triangles, in the refinement step. Figure 2a shows the bounding boxes of the triangulation shown in Figure 2b. Note that the figure only shows the 2D projection of the bounding boxes and that they are also superimposed. Figure 2c shows the bounding boxes selected by the filtering step. The triangles used in the refinement step are shown in Figure 2d.
Figure 2: Example of triangulation, in multiple layer architecture, stored in a R3-Tree. According to Volker and Günther [GG98], access methods such as the R3-Tree tend to group spatial representations close to each other. The immediate consequence of this property, for the visibility test, is that the input of R3-Tree relative to triangles that intercept the segment AB tends to be contained in the same nodes of R3-Tree. If each node occupies one storage unit in secondary memory, the R3-Tree groups in the secondary memory the references to the triangle ti. To understand how this grouping can be done, it is important explain the R-Tree node-splitting algorithm [BKSS90]. Given two nodes, the algorithm finds the two rectangles that would waste the largest bounding box put in one group. In this sense the two rectangles are the most distant ones. It is important to mention that the bounding box of the two resultant nodes will tend to be small if the rectangles to be distributed are of very different sizes and/or have a large overlap. The algorithm assigns each remaining entry, to one of the two nodes, by the minimum area criterion. To store the references to neighboring triangles closer together in the secondary memory, we propose the following strategy. Let f be a leaf of R3-Tree. All the triangles related to f should be stored in the same storage unit of secondary memory. That is, whenever a leaf f of R3-Tree is created, two storage units are allocated in the secondary memory: one for f and another for the triangles referenced by f. This technique is a variation of the grouping techniques based on the R-Tree proposed by Brinkhoff and Kriegel [BK94]. In Figure 3, the line R separates the leaves of R3-Tree and the pages which contain the
descriptions of the triangles referenced by the leaves of R3-Tree. Note that the descriptions of the triangles use more space than the entries in the leaves of R3-Tree.
Figure 3: The R3-Tree and the disk pages with the descriptions of triangles referenced by the leafs in the R3-Tree. When the triangulation of the terrain does not change during the game, algorithms for the generation of a static R3-Tree can be used (see Roussopoulos and Leifker [RL85]). The approach presented in this section is particularly relevant when the data volume is larger than the main memory available. In other words, with this approach it is possible to compute visibility without maintaining the terrain model in main memory. When the visibility tests are limited to a small area of the terrain, only a small subset of storage units of the secondary memory is read into the main memory.
4. Height Map A height map, or height field, is defined as a group of height values in selected points on a plane area. When these points are arranged in a regular matrix, the structure is implicit and no topology data is required. In the geographical information systems, this type of representation is known as Digital Elevation Map (DEM), in which not only the heights are stored, but also attributes such as colors, usually given by a texture image [SGP97]. This type of representation is also commonly used in high-performance visual applications that need a description of terrain data, such as flight simulators and action games [GGP97].
Figure 4: Terrain data represented as a Height Map.
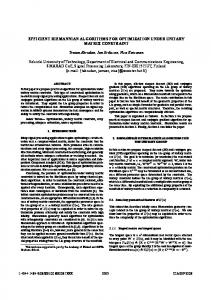
Thus, given the coordinates (x,y) of two combat elements, the z coordinate is obtained for the visibility calculation from the height map. After that, a 3D Bresenham algorithm is used to “traverse” the straight-line segment joining the two coordinates. At each step, the height of the current coordinate of the line segment is verified to check if it is higher (larger) than the corresponding height in the map. In Figure 5, it can be observed that, to determine whether the combat elements represented by A and B they visible it is necessary for the traverse to begin at A, and finish at B with no one of the steps having the height inferior to the height of the terrain.
Figure 5: Example of visibility between AB using a height map. However, in order to assert that the combat elements are not visible, it is enough that one of those heights is the same as or inferior to the height of the terrain. With that, it is not necessary to conclude the traversal to determine that the combat elements are not visible. In Figure 6, the arrows illustrate the points in which the traversal finishes if we go from A to B or vice-versa.
Figure 6: Example of no visibility between AB using height map.
5. Results The results presented were obtained using a microcomputer 400 MHz Pentium II with 128 Mb of memory, running Linux (RedHat 5.2). The terrain data used here for both algorithms represents an area of 54 × 30 km of the municipal district of Macaé, RJ. The elements were uniformly but randomly distributed on the terrain. Due to the detail level of the characteristics of terrain, its description is done by means of a Triangle Irregular Network (TIN) with 151584 triangles. This network is generated from sampled points starting from contour curves of from 20 to 20 meters. For the R3-Tree, these triangles are inserted directly into the tree. For the height map, an image is generated with samples obtained by regular bars placed on this irregular network, generating an image of 2650 × 1500. number of detections 100 1000 5000 10000 50000 100000
time (s) 0.294 3.075 15.388 30.732 153.964 307.078
detections per second 339.99 325.17 324.92 325.39 324.75 325.65
Table 1: Computing times with R3-Tree algorithm.
number of detections 100 1000 5000 10000 50000 100000
time (s) 0.044 0.186 0.879 1.750 8.887 17.672
detections per second 2240.14 5377.38 5685.58 5714.83 5625.97 5658.79
Table 2: Computing times with height map algorithm. As it can be observed in Tables 1 and 2, the algorithm has presented an answer that is almost linear in function of the amount of detections.
6. Conclusions In the approach based on R3-Tree we look for a fast identification of the triangles that intercept the line-of-sight segment's bounding box. After this identification, the intersection of the straight line segment is verified between the two combat elements of interest and these triangles. The combat elements are only visible to each other if there is no intersection with
any of the triangles; otherwise, they are not visible. It is important to notice that it is necessary to test all the triangles, then one can say that the combat elements are visible.
Figure 7: Triangles intercepted in R3-Tree. Besides, in the R3-Tree the visibility test is based on points; therefore, to verify the visibility of an area, it becomes necessary to check several straight-line segments. This is important because we are verifying objects that occupy an area of the terrain, and not a single point. In the approach based on, the height map, the generated image has its pixel choose according to the size of the smallest combat element to be visualized and to the detail level of the terrain. For the tests done, a pixel of 400 m2 was used, representing an area of 20 × 20 meters. The visibility is calculated through an algorithm of discrete traversal along the straight-line segment between the two combat elements, such as, for example, Bresenham algorithm. In case it meets along the traversal a height smaller than the height of the image (height map), the combat elements will not be visible (see Figure 5); otherwise, they are visible. For the visibility calculation necessary to the problem described in this work, we are basically comparing the time between the calculation of the intersection of a straight-line segment and several triangles, using an algorithm of discrete traversal along a straight line. At each step a height value (threshold) is verified. There is a common theme in these two approaches. Both test either heights (height map approach) or triangles (R3-Tree approach) found along the straight-line segment. The height test is faster than the triangle test, but in the R3-Tree approach, based on triangles, the smoother the terrain, the fewer triangles have to test. In the height map approach, the map's resolution does not depend on how smooth the terrain is. For the proposed problem, in which practically all the actions are based on visibility and distance, the acting of these calculations implies directly in the global acting of the system. Tables 1 and 2 show the comparison among the two methods, resulting in a performance 17 times better of the algorithm based on height map than the algorithm based on R3-Tree.
Another important point to be observed is the amount of memory used by the two approaches. The height map approach uses 3.9 Mb of memory, which is exactly the size of the image (2650 × 1500). In the R3-Tree approach, the used space is about 22 Mb, because the coordinates of each triangle are stored as well as the data structure of the tree. We would like to point out that the R3-Tree approach is a good option in case the main memory that is not enough to use the model based on height map.
7. Acknowledgements We are grateful to the Corpo de Fuzileiros Navais of the Centro de Instrução Almirante Sylvio de Camargo, for their contributions and efforts in the development of the “Sistema de Jogos Didáticos” (training games system), mainly CT (FN) Adriano, CT (FN) Ricciardi, CT (FN) Wagner, and CT (FN) Barroso.
8. Bibliography [DLN97] [GGP97]
[SGP97]
[KFL96]
[AA83] [BHKS93]
[BK94] [BKK96] [BKSS90]
[Gut84]
[KF92] [KSB93]
D. L. Neyland, “Virtual Combat: A Guide to Distributed Interactive Simulation”; Stackpole Books, 1997. L. C. C. Guedes and M. Gattass and P. C. P. Carvalho; “Real-Time Rendering of Photo-Textured Terrain Height Fields”, Proceedings of Brazilian Computer Graphic Symposium – Sibgrapi'97, 1997, pp. 18–25. F. Szenberg and M. Gattass and P. C. P. Carvalho, “An Algorithm for the Visualization of a Terrain with Objects”, Proceedings of Brazilian Computer Graphic Symposium – Sibgrapi'97, 1997, pp. 103–110. R. Kerchner and J. Friel and T. Lucas, “Understanding the Air Force's Capability to Effectively Apply Advanced Distributed Simultation for Analysis”, RAND,1996. T. Asano and T. Asano, “Minimum Partition of Polygonal Regions into Trapezoids”, IEEE Transactions, 1983, pp. 233–241. T. Brinkhoff and H. Horn and H. Kriegel and R. Schneider, “A Storage and Access Architecture for Efficient Query Processing in Spatial Database Systems”, 3rd Int. Symp. on Large Spatial Databases, 1993, pp. 357–376. T. Brinkhoff and H. Kriegel, “The Impact of Global Clustering on Spatial Database Systems”, Proceedings of the 20th VLDB Conference, 1994. S. Berchtold and D. Keim and H. Kriegel, “The X-tree: An Index Structure for High-Dimensional Data”, Proceedings of the 22th VLDB Conference, 1996. N. Beckmann and H. Kriegel and R. Schneider and B. Seeger, “The R*-Tree: An Efficient and Robust Access Method for Points and Retangles”, Proceedings of the ACM SIGMOD Conference on Management of Data, 1990, pp. 322–332. A. Guttman, “R-Trees: A Dynamic Index Structure for Spatial Searching”, Proceedings of the ACM SIGMOD Conference on Data Engineering, 1984, pp. 47–56. I. Kamel and C. Faloutsos, “Parallel R-trees”, Proceedings of the ACM SIGMOD Conference on Management of Data, 1992, pp. 195-204. H. Kriegel and R. Schneider and T. Brinkhoff, “Potentials for Improving Query Processing in Spatial Database Systems”, 9th Conf. on Advanced Databases, 1993.
[LR94] [RL85]
[SK91]
[GG98]
M. Lo and C. Ravishankar, “Spatial Joins Using Seeded Trees”, Proceedings of the ACM SIGMOD Conf. on Management of Data, 1994, pp. 209–220. N. Roussopoulos and D. Leifker, “Direct Spatial Search on Pictorial Databases Using Packed R-trees”, Proceedings of the ACM SIGMOD Conference on Management of Data, 1985, pp. 17–31. R. Schneider and H. Kriegel, “The TR*-tree: A New Representation of Polygonal Objects Supporting Spatial Queries and Operations”, Proceedings of 7th Workshop on Computational Geometry, 1991, pp. 507–518. V. Gaede and O. Günther, “Multidimensional Access Methods”, ACM Computing Surveys, 1998, 30 (2), pp. 170–231.
Figure 8: Terrain with types of soil and vegetation.
Figure 9: Terrain with target circles and trafficability.
Figure 10: Terrain with contour curves, roads, rivers and elevations.