Foundation of Computer Science FCS, New York, USA. Volume 3â No.7, August 2012 â www.ijais.org. 7. Effort Estimation in Agile Software Development using.
International Journal of Applied Information Systems (IJAIS) – ISSN : 2249-0868 Foundation of Computer Science FCS, New York, USA Volume 3– No.7, August 2012 – www.ijais.org
Effort Estimation in Agile Software Development using Story Points Evita Coelho
Anirban Basu
Dept. of CSE, R&D East Point College of Engineering and Technology Bangalore, Karnataka, India
Dept. of CSE, R&D East Point College of Engineering and Technology Bangalore, Karnataka, India
ABSTRACT Agile software development has been gaining popularity and replacing the traditional methods of developing software. However, estimating the size and effort in Agile Software development still remains a challenge. This paper gives an overview of the different size estimation methods traditionally used and discusses in details the method based on Story Points, which is at present the most widely used estimation technique in Agile Software Development. The paper describes the steps followed in Story Point based method and highlights the area which needs to be looked into further.
General Terms User Story, Velocity, Agility, Scheduling.
Keywords Story Points, Size Estimation, Effort Estimation
1. INTRODUCTION Often the traditional ways of project planning do not provide satisfactory answers with respect to the scope, schedule and resources involved in a software project, and making it difficult to meet customer requirements. A crucial deficiency with traditional planning methods is that they give more thrust on the completion of activities rather than on delivery of fruitful features to the customer. The “Agile Manifesto” [1] valued individuals and the communication between them more than the development process. Agile planning balances the effort and investment in planning and the plan is revised throughout the life cycle of the project. The project owner ensures that all the team members have a common vision of the project. The Agile team executes a project in short Iterations and productive yields are delivered to the customer based on negotiations and continuous collaboration [1]. The features chosen to be developed in Iteration are based on business priority. This ensures that the most important features are developed first. The focus of Agile Methodology is on welcoming changing customer requirements even during later stages of software development. Estimation of schedule of an agile project is initiated by the work breakdown structure [1]. Once this activity is completed, the various tasks or features that can be developed are listed. Each such feature is called a user Story. Story Point is a measure for relatively expressing the overall size of a user Story or a feature. The value of the Story Point is dependent on the development complexity, effort involved, and the inherent risk and so on. The team members estimate the effort and duration required to deliver each feature to the customer. The main challenge involved in predicting the attributes of an agile project is that Agility is subject to uncertainty. There may not be adequate
information to estimate upfront. Customer requirements are subject to change based on changing technology and domain, budgets, political influence etc. [1]. Further estimates are not guaranteed to be accurate. All these make estimation in Agile Software development a challenging task. This paper gives an overview of the available estimation techniques and describes in details estimation technique based on Story Points.
2. OVERVIEW OF EXISTING ESTIMATION TECHNIQUES Various methods have been proposed to estimate a project’s size and effort. However, there is no standard method which satisfies universal acceptability. The simplest technique used to measure the size of a program is Source Lines of Code (SLOC)] [2]. Based on this size estimate and the project team’s productivity; the effort, and time schedule is computed. Measuring software size by the number of lines of code has been in practice since the inception of software. This was considered one of the simplest techniques to measure a project’s size. Since Line of Code is a physical entity; automating the counting process can easily eliminate manualcounting effort. Line of Code serves as a metric for measuring the size of software due to the fact that it can be seen and the effect of it can be visualized. Effort is highly correlated with SLOC: a project with higher SLOC may require more time and effort to develop. But functionality is not effectively correlated with SLOC [2]. A skilled developer may develop the same functionality with less SLOC compared to a novice developer. As a program with less SLOC may exhibit more functionality than a program with a larger value of SLOC, SLOC is a poor productivity measure. The major drawback with this method is the ambiguity involved in the operational definition [2]. The SLOC required to develop the same application in two different platforms may not be the same. With the advent of high-level languages, the one-to-one correspondence between one physical line and one instruction broke down. This requires to pre state whether physical LOC or logical LOC is being used in a project. Industry wide standards require conversion techniques between the two variations of the metric. Finally, a programmer whose productivity is measured using the SLOC tends to write verbose code. He is forced to expand his code with unneeded complexity, which further results in increased maintenance cost and increased effort for bug fixing. A better technique proposed was Function Point Analysis (FPA) [2]. It estimates the metrics for the business functionality delivered to the end user. There are five major components of Function Point Analysis: External Inputs (EIs), External Outputs (EOs), External Inquiries (EQs), Internal Logical Files (ILFs) and External Interface Files (EIFs). Function Point measure is independent of language,
7
International Journal of Applied Information Systems (IJAIS) – ISSN : 2249-0868 Foundation of Computer Science FCS, New York, USA Volume 3– No.7, August 2012 – www.ijais.org development method; hardware/platform used and is a better candidate for benchmarking across organizations. Function Points can be used to effectively derive empirical formulae and pinpoint scope for improvement. Despite these benefits; due to its very nature, Function Points have to be counted manually. The counting process cannot be automated. A great level of detail is required to estimate the software size in terms of Function Points [2]. Information on inputs, outputs, screens, database tables, and even logical records and fields are required to perform Function Point Analysis (FPA).
3.1 Customer/User Expectation
An extension to FPA is the Use Case Points method [3] for sizing and estimating projects developed using object oriented methods. The main drawback of this approach is that use case based estimation method based on UML cannot be done during the early project phase as the use case document is usually prepared after project sign off and requires detailed analysis. When applying this method, there are no detailing guidelines defined for a use case and for actor identification. Another technique is a group estimation technique called Wideband Delphi method [3]. Although this method provides broad analytical perspective, it tends to provide a biased opinion. It eliminates the extreme positions and forces middle-of-the-road consensus. It also requires adequate time and participant commitment. After estimating the software size, Effort Estimation is carried out and COCOMO II [3] is the most accepted method. This method incorporates software reuse and reengineering and also accounts for requirement volatility.
Because an estimate represents the cost of developing a user Story, it is important that each one is estimated correctly. It is not necessary to estimate all the features together in one shot. It is only necessary to have an estimate of each new feature that has possibility of being selected for inclusion in the upcoming release.
However none of the methods discussed above has found acceptance in the agile community for Size and Effort estimation due to the difference in philosophy and approach.
3. ESTIMATION BASED ON STORY POINTS Story Point [2] is a unit to measure the size of a user Story or a feature. A point is assigned to each user Story. These Points are relative in nature, i.e. a Story that is assigned a two-point value is assumed to take twice the effort than a Story that is assigned a single point value. A Story Point may be assigned based on the effort involved, the complexity and the inherent risk in developing a feature [4]. An estimate of the effort of developing a user Story requires the developer to have some experience of estimating, to have access to historical data and have the freedom to use a trial based estimation approach. In order to aid estimation, an expert maybe asked about how long it will take to achieve a desired goal. The expert [4] may rely on his/her intuition or previous experience. The benefit of using expert opinion is that it is not time consuming. But this method is not beneficial in an agile environment as here estimates are assigned to user valued functionality which very likely requires domain skills of multiple people working in the team. This makes it difficult to find suitable experts in a variety of disciplines to evaluate the effort. Alternatively, the user stories can be estimated against a collection of already estimated stories [4]. There is no need to compare all the stories against a single baseline or common reference. A Story can be disaggregated into smaller, easier to estimate blocks. But there is no safety check when disaggregating a Story. The likelihood of missing out a task increases with disaggregation. Summing up estimates of a number of small tasks may further cause problems. Estimation of the schedule and effort using Story Points proceed in the following sequence:
It is important to know the criteria by which the project will be evaluated as a success or a failure. Most projects use the trio of schedule, scope, and resources as principle indicators of success or failure. For most projects, the product owner’s conditions of satisfaction are defined by a combination of schedule, scope, and resource goals [5].
3.2 Estimation of User Stories
3.3 Select an Iteration Length The next goal is to determine the length of the Iteration [5]. It should be selected in order to encourage the team members to work at a consistent pace throughout the Iteration. The selection of Iteration length is guided by various factors that include the length of the entire Release Plan, the amount of uncertainty, the ease of feedback, volatility of priorities, iteration overhead and so on. Majority of Agile teams settle on Iteration lengths varying from one to four weeks [5]. The length of the Iteration can vary across projects and development teams. If the duration is too long, there is a tendency to relax at the start which eventually leads to panic and long working hours towards the end of the Iteration. Extremely short Iterations leave no time for recovery. There is a need to choose an Iteration length that smoothes out these variations.
3.4 Estimate Velocity In order to estimate the effort based on Story Points, the concept of “Velocity” is used. It is a measure of the team’s progress rate. It is calculated by adding all the Story Points assigned to each user Story completed by the team in the current iteration. The addition of the Story Points of all the desired features gives the total size estimate of the project. Dividing the total size by the team Velocity gives the estimated number of Iterations, as shown in Figure 1.Velocity can be estimated using three approaches which include techniques that rely on historical data, executing iteration and forecasting [5].
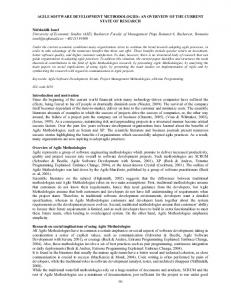
3.4.1 Estimation of Velocity based on historical data Before computing Velocity on the basis of historical data it needs to be ascertained if the technology, the domain, the development team, the working environment and the tools used for development in the current project are the same as the earlier one. Any significant changes in the above factors will reduce the usefulness of this approach [6]. To reduce the risk of estimation, a larger range is used with the historical approach. The team’s average Velocity is computed over the course of the prior Release. The actual value obtained is converted into a range using the cone of uncertainty shown in Figure 2. The actual value of the average Velocity is multiplied by 60%-160% to get the upper and the lower bounds.
8
International Journal of Applied Information Systems (IJAIS) – ISSN : 2249-0868 Foundation of Computer Science FCS, New York, USA Volume 3– No.7, August 2012 – www.ijais.org
3.4.2 Execute an Iteration The second approach to estimate Velocity is to run a couple of Iterations and then estimate Velocity from the observations [6]. Once the team has run more than three Iterations, the
number of people in the team and the number of days in the Iteration. For instance, four people each working six hours a day is 24 hours per day. In ten-day Iteration, they put in about
Project schedule
1.6x
1.25x 1.15x 1.1x x 0.9x 0.85x 0.8x 0.6x
Initial product definition
Approved product definition
Requirement specification
Product design specification
Detailed design specification
Accepted software
Fig 2: The Cone of Uncertainty
Range computed from the observed values can be used. Alternatively, the cone of uncertainty can be used [6]. The average Velocity of all the Iterations is calculated and this value is converted into a range. If the team has run a single Iteration, the “initial product definition” milestone is considered and the corresponding range is used. If two Iterations are completed, the range corresponding to “approved product definition” milestone is used and so on.
3.4.3 Forecasting In some cases historical data may be unavailable and it may not be feasible to run an Iteration to observe the Velocity. In cases like these the Velocity needs to be forecast. It begins by estimating the number of hours each person is available to work for the project on a daily basis. Project participants do not spend 100% of their time working on the project [6]. They have additional responsibilities which include answering emails, telephone calls; attending company meetings and so on. Using these factors one can assume that each team member will spend 55% to 80% of their time on project related activity. These parameters can be used to estimate the amount of time each individual may dedicate to the project each day. Based on this, the total number of hours that will be spent on the project in Iteration can be determined. This is done by multiplying the number of hours available each day by the
240 hours towards the project. The next step is to select stories randomly and expand them into constituent tasks. This is iterated until enough number of tasks is obtained to fill the number of hours available in the Iteration, that is they should not exceed the capacity of the individuals in the team. This gives the Velocity which is then converted into a range using the cone of uncertainty shown in Figure2. The two techniques in 3.4.1 and 3.4.2 rely on Story Point values provided for estimation. These values can be fine tuned at any given time as and when the customer requirements change. However problems arise when the features planned to be completed in one Iteration spills over onto the next. Calculation of Velocity becomes difficult in this situation.
3.5 Prioritize User Stories It is not possible to incorporate all the desired features within the time allocated. Hence there is a need to prioritize the development of user stories [7]. Prioritizing user stories is guided by factors such as the financial value of the Story, the cost involved in developing the Story, the amount and significance of the knowledge created by developing the Story and the amount of risk mitigated by developing the user Story [7].
9
International Journal of Applied Information Systems (IJAIS) – ISSN : 2249-0868 Foundation of Computer Science FCS, New York, USA Volume 3– No.7, August 2012 – www.ijais.org
DESIRED FEATURES
ESTIMATE SIZE
ESTIMATE DURATION
SCHEDULE
Fig 1: Relating size and velocity
3.6 Estimation of Delivery Date In order to estimate the delivery date, the length of the selected Iteration is used to estimate the duration which is mapped onto the calendar time, and gives the project schedule. When planning a Release, an appropriate Iteration length must be chosen [8]. With Iteration plan, a team takes a more detailed look at the requirements of a user Story that
3.7 Estimation of Delivery Date In order to estimate the delivery date, the length of the selectedneeds to be implemented in the current Iteration. Iteration planning can be Velocity driven or commitment driven. In Velocity driven Iteration planning, the team collaboratively adjusts priorities [8]. They identify the target Velocity for the upcoming Iteration. The team then selects an Iteration goal which consists of the user stories to be estimated. These user stories are further split into tasks and each task is individually estimated. In the commitment driven Iteration planning, adjusting priorities and identifying an Iteration goal are same as in the Velocity driven approach. Stories are selected one at a time. After each Story is split into tasks the team decides whether or not they can commit to delivering that Story during the Iteration [9]. After obtaining an estimate of the team’s Velocity and the number of Iterations involved, project delivery can be planned to meet the desired customer’s expectations. Estimation can be done more accurately by involving the entire team, planning at different levels and re-planning whenever required [9].
4. CONCLUSION The objective of Agile development methodology is to find answer to the question as to which features should be developed with which resources and in what timeline. An Agile approach to software development helps in finding an answer because plans are made at different levels and replanning occurs frequently. Story Points are estimates of the size of the work to be performed. Velocity is a measure of a team’s rate of progress per Iteration. There are methods based on Historical data, Executing an Iteration and Forecasting that can be used to estimate Velocity. Regardless of the approach used, estimates of Velocity need to be given in a range aided by the cone of uncertainty. The estimated Velocity may not be 100% accurate. There may be hidden factors that trigger delay in the deployment of the software. The Cone of Uncertainty reflects this vagueness inherent in the estimate and poses challenges in accurate estimation of a project following Agile Methodology.
5. ACKNOWLEDGEMENT Our thanks to Vinay Krishna of Cegedim Software, Bangalore who provided valuable inputs and suggestions and to management of EPCET for providing encouragement and assistance.
6. REFERENCES [1] LINDSTROM, L. & JEFFRIES, R., 2004 Extreme Programming and Agile Software Development Methodologies. Information Systems Management, 21, 41-52. [2] IFPUG: FSM Method: ISO/IEC 20926:2009, Software and systems engineering - Software measurement - IFPUG functional size measurement method [3]Robert E Park, “Software Size Measurement: A Framework for Counting Source Statements”, Technical Report CMU/ SEI-92-TR-020, Software Engineering Institute, pp. 1-242 [4] Peter Hill, 2010 “Practical Software Project Estimation- A Toolkit for Estimating Software Development Effort and Duration” Mc Graw Hill Education, [5] Mike Cohn “Agile Estimating and Planning” Prentice Hall 1st edition, 2005 [6] K. McDaid, D. Greer, F. Keenan, P. Prior, P. Taylor, G. Coleman, 2006 “Managing Uncertainty in Agile Release Planning”, 18th Int. Conference on Software Engineering and Knowledge Engineering (SEKE’06), pp. 138-143,. [7] K. Logue, K. McDaid, D. Greer, 2007, “Allowing for Task Uncertainties and Dependencies in Agile Release Planning”, 4th Proceedings of the Software Measurement European Forum, pp 275-284. [8] MOLØKKEN, K. & JØRGENSEN, M. 2003, A Review of Software Surveys on Software Effort Estimation, Proceedings of the 2003 International Symposium on Empirical Software Engineering. WILLIAMS, L. (2003) the XP Programmer: The Few-Minutes Programmer. IEEE Software, 20, 16-20. [9] KEUNG, J., JEFFERY, R. & KITCHENHAM, B. 2004, The Challenge of Introducing a New Software Cost Estimation Technology into a Small Software Organization, Proceedings of the Australian Software Engineering Conference. Australia.
10