7. Empirical Model Selection with Fitting Approximation using Drive Test for DIT University, Dehradun. Govind Sati. ECE Department. DIT University. Dehradun ...
International Journal of Computer Applications (0975 – 8887) Volume 102– No.1, September 2014
Empirical Model Selection with Fitting Approximation using Drive Test for DIT University, Dehradun Govind Sati
Sonika Singh, Ph.D
ECE Department DIT University Dehradun, Uttarakhand India
ECE Department DIT University Dehradun, Uttarakhand India
ABSTRACT An exact radio propagation model is important for coping up with new challenges in the field of communication like: appropriate design, deployment and service management strategies for any wireless network. Analysis of path loss for outdoor propagation models is important for the purpose of signal coverage prediction, data reception, reception schemes, and analysis of signal attenuation under different environments. The aim of this work is to survey different outdoor propagation models with respect to empirical data collected from DIT University (formally Dehradun Institute of Technology), Dehradun by drive testing using TEMS Investigation tools at 1.8GHz. Predication of path loss is based on obtaining the mean received power distribution at specified receiver distance from the respective GSM base station. The measurement process was based on signal strength measurement and the study revealed that out of all the outdoor propagation models. COST Hata model, COST Hata W-B model and Ericsson model approximated the measurement characteristics and hence they can be deployed for network planning in this region and select the best propagation model for that region. Measurement process of signal strength and data collection methodology also discuss in this paper.
Keywords Path loss, TEMS, Drive testing, Outdoor propagation models, COST Hata, COST Hata WB, Ericsson model, Comparative analysis, Model selection
1. INTRODUCTION Radio system planning can be seen as a process that defines the stages required to provide a desired radio network plan for a given geographical area. When propagation model used in one site (e.g. suburban) is optimized based on the drive test on this site measurement, whereas the same model used for different site (e.g. rural) is adjusted based on drive test for that sites. To achieve a desired radio network, it is important to capture critical factors [2] that influence the choice of base transceiver station locations. The parameters that affect radio system planning also define the specified characteristics of the radio propagation environment which furthermore has a significant effect on the coverage and capacity of radio network [1]. Continuous wave (CW) signals are transmitted to the base station antenna. Omnidirectional antenna is used in the base station mounted on the top of base station. This omnidirectional antenna has azimuth pattern and gain of 8.14 dBi [1]. This is to ensure that the BTS station sites used are performing optimally and meets up with all parameters [2].
Power conversion from Watt to dBm is done using the following expression: ….(1) The effective power radiated from the Base Transceiver Station (BTS) antenna is given as: ….(2) Where =Base station power, =Duplexer loss, = Feeder loss, = Mobile station (receiver) antenna gain, = Base antenna gain. Path loss at the receiver site with appropriate distances from the base station is expressed as: …..(3) ….(4) Eq.(3) and eq.(4) determine the path loss values, where PL is path loss.
2. TEST SITE AND SCENARIO SELECTION DIT University has been selected for this experiment (located at Makkawala Greens, PO Bhagwantpur, Mussoorie Diversion Road, Dehradun, Uttarakhand, India) which is categorized under rural environment. Region of the DIT University starts form 500m of the airtel BTS station. Measurement of signal strength is based on the effect of density of vegetation and height of buildings in the test sites, the sites of measurement were selected to ensure that the sites were representative of the clutter types being considered. At first, built areas were considered. The cell characteristics were analyzed to verify that the cell contained over 80% of built clutter. The height of the base station antenna, distance between transmitter and receiver represent the characteristics of test site. Base station antenna can be installed on the top of building or top of the mountain. Usually omnidirectional antennas are used for predesign drive test and the measurements are made all around the site. Propagation characteristics of models depend on morphology and environment (like urban suburban and rural). The base station antenna was located at a height 40m above the ground while some were located on masts and few others were on rooftops. The signal transmitted has a bandwidth of 806-880MHz/880960 MHz & 806-960MHz (for uplink and downlink) at 1800MHz respectively. Type of modulation used was GMSK with TDMA/FDMA.
7
International Journal of Computer Applications (0975 – 8887) Volume 102– No.1, September 2014
3. DRIVE TEST MEASUREMENT AND DATA COLLECTION METHODOLOGY The methodology for data fetch deals with the drive test tools which contained both software and hardware devices. TEMS 10.0.5 has been used for drive test measurement for the region of DIT University, Dehradun. Main objective of drive testing is to provide real time data based on test site of coefficient, which minimizes the prediction error [3]. Measurement process started with a Hata’s propagation models by default. Whenever the vehicle is not moving the measurement process has to be stopped. Accuracy of prediction (for a given environment) was based on the correct choice of coefficients. In field measurement we analyzed that signal variations is due to propagation and slow fading [4]. The best set of correction factors to minimize the prediction errors by comparing the predicted and the measured signal strength on the drive testing routes.
The high interference can be reduced by rechecking the RF planning using planning tool.
4.3.Bad Coverage
The signal strength of the antenna is weak at a reasonable distance. It may occur due to wrong azimuth in the field. Low power transmission from the BTS can also be a reason for this bad coverage and it can be checked by a power meter. If the power is ok then it is a hardware failure.
4.4.Missing neighbors This case may cause to drop calls and bad coverage, as the Mobile Station (MS) will not be able to handover on the target site as it’s not known for the serving site.
4.5.Dropped calls
A drop call may occur due to all the above cases as mentioned. It may also occur due to an abnormal release in the Traffic Channel (TCH) or Standalone Dedicated Control Channel (SDCCH) after it‘s being occupied successfully.
5. COMPARASION OF MEASURED DATA CONTRAST TO PRE EXISTING OUTDOOR PROPAGATION MODELS
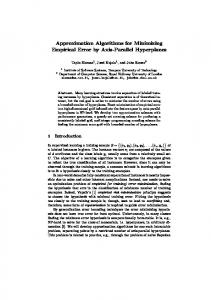
Fig1. Process of data collection depicted using real-time drive test with TEMS Investigation at DIT University. Drive testing process start with connect TEMS dongle, GPS system and MS to the laptop. In this research work TEMS investigation tool are used for data collection at DIT University. TEMS 10.0.5 version is used for drive test. Sony Ericsson Z750i and Sony Ericsson C905 used as a Mobile Station, it is connected to laptop via UBS 2.0 along with TEMS Dongle. TEMS Dongle is hardware key for TEMS Investigation tool. Fig1 shows the real time picture of data collection process at DIT University.
This context under covers a comparative outlook on different Propagation models for path loss measurement [5]. It also compares pre-existing theoretical profiles with empirical measurement [6] (depicted measured values vs. distance) with different theoretical models singularly and in a cumulative fashion too. After that select the closest proximity models to measured values taken in region of DIT University Dehradun, Uttarakhand, India. MATLAB R2010a was used for simulation. Fig.2 shows the measured path loss with the distance. Path loss obtain by the measurement of receive signal strength at particular distance.
4. VARIOUS ISSUES DURING MEASUREMENT The issues to be considered during measurement are the following as.
4.1.Overshooting
Overshooting means, it serves at very long distance with good Rx Level where in this area it is supposed to be served by another closer site having approximately the same signal strength. It can cause high interference which leads to bad quality. Usually the advice for this case is down tilt the antenna.
4.2.Bad Quality
Bad quality can occur due to bad coverage and high interference (It is mainly co channel which is known from Carrier over Interference ratio (C/I) data in the TEMS data collection).The remedies to reduce bad quality The bad coverage can be rectified by checking the infected site or antenna.
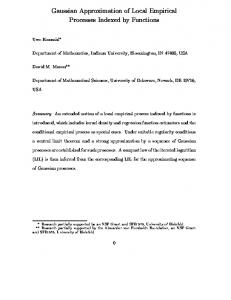
Fig2. Measured path loss vs. distance The received signal varies due to variation in vegetation, building at the test site. These variations in the received signal change the path loss. After obtaining the path loss the data file is made in workspace, than the MATLAB code is written for the theoretical path loss, after that add these code are indicated in the workspace and comparative results are obtained.
8
International Journal of Computer Applications (0975 – 8887) Volume 102– No.1, September 2014
6. FITTING APPROXIMATION FOR EMPIRICAL MODEL SELECTION FOR DIT UNIVERSITY REGION, DEHRADUN After the measurement of signal strength the path loss was obtained. These values simulated with MATLAB R2010a using Curve Fitting tool. Curve Fitting tool can be used to fit any curve to data. Easy fit, hard fit, bad fit, generic fit are done over CF tool. Curve fitting layout was generated on the basis of fitting analysis studies of different models comparison and appropriate model for the region could be decided easily. Moreover from general comparative observations based on path loss [5], it was found that only three of the models best approximated the measurement results namely: COST-Hata and Ericsson model [6]. Therefore the task was simplified now as we only needed to carry out the analysis for only these models. Fitting results are shown in fig3 with comparison of different outdoor propagation (a). Fig3 (b) shows the curve fitting of the COST Hata model with the measured path loss which showed good approximation. Fig3 (c) shows the curve fitting of Ericsson model with measured values which showed good approximation.
7. CONCLUSION On the basis of the results obtained during the curve fitting process (using 6th order polynomial approximation and confidence bound of 95%) for every chosen model for DIT University, Dehradun. COST Hata model is found to be closest proximity to the measured data value. It can be selected as a model to study the signal strength distribution or network planning for the region of DIT University at 1800 MHz. It was revealed during the comparative study of different models along with interpolated measured field data values that out of different models studied only three specific models closely approximated the actual measurement characteristics namely: COST Hata model, Ericsson model and COST W-B model. Apart from these three propagation models all other propagation models showed huge deviation from the measured field data value, which clearly indicates inefficiency of all other models to be deployed for network planning in this region.
8. REFERENCES [1] Ed. Upper Saddle River, NJ 07458 Prentice Hall PTR. 2002. Rapport T.S Wireless Communication Principles and Practice 2nd. [2] Theodore S. Rappaport, ISBN 978-81-317-3186-4, Wireless communications principles and practice, Second Edition, 2013 [3] Shoewu, O and F. O. Edeko, AJSIR ISSN 2153-649X, doi:10.5251/ajsir. 2011.2.3.438.455. Analysis of radio wave propagation in Lagos environs. [4] Abdi A., Allen Barger H., and Kaceh M., in Proc. IEEE Vehic. Technol. Conf. Atlantic City. NJ, pp 2058-2062, 2001. A simple alternative to the lognormal model of shadow fading in terrestrial and satellite channels.
(a)
[5] Vishal Gupta, Sandip Vijay and S. C. Sharma, ISN2008, Feb. 22-24, 2008, Pg-271. Efficient Path Loss Prediction in Mobile Wireless Communication Network, [6] Hemant kumar sharama, Santosh Sahu, Sanjeev Sharma. IJCA (0975-8887). Vol. 19-No.6 April 2011., Enhanced Cost231 W.I. propagation model in wireless network. [7] Naren Mohan, Praven Chandrasekaran and Hossam Hmimy, 0-78903-9152-7105. 2005 IEEE. Drive test based EDGE radio network performance evolution.
(b)
(c) Fig3. (a) Comparison of different outdoor propagation models with measured path loss. (b) Fitted measured values of COST-Hata model. (c) Fitted measured values of Ericsson model IJCATM : www.ijcaonline.org
9