Jun 19, 1992 - University of California, Santa Cruz. Santa Cruz, CA 95064. Many applications designed for .... Cupertino, CA. 24.50. 95.96 ucbvax.berkeley.
End-to-end performance prediction for the Internet (Work in progress) Richard A. Golding UCSC–CRL–92–26 June 19, 1992
Concurrent Systems Laboratory Computer and Information Sciences University of California, Santa Cruz Santa Cruz, CA 95064
Many applications designed for wide-area systems use replication to provide a service at multiple locations. From which site should a client choose to obtain service? A client can specify its needs in terms of communication latency, bandwidth, or error rate. This specification must be matched against the expected performance available from each site. I present the results of two experiments that measured end-to-end performance, and discuss how the results can be used for prediction.
Keywords: diction
distributed systems, communication latency, network bandwidth, performance pre-
Directory servers
Internet Client workstation
Client workstation
Storage servers
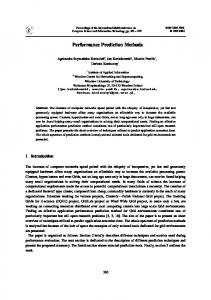
FIGURE 1: Architecture for Internet information services.
1 Introduction Applications for wide-area systems often use replication to provide a service at several different sites. This approach improves both the fault-tolerance of the system and its performance. In many systems, clients can contact any one server, so that the service is unavailable only when all servers are unavailable. The client can also select the server that will provide it the best service. In general, the best server for an operation will be the one that will respond most quickly. If the operation requires that only a small amount of information be moved between the sites, message latency will dominate performance. On the other hand, if large amounts of information must be transferred then bandwidth will dominate. For example, the archie system [Emtage92] provides an index of files that are available for anonymous FTP on the Internet. A user typically first sends one or more query message to archie to find a set of sites providing the file, then uses FTP to transfer it. The query operations typically send only a few bytes to the server and obtain at most a few kilobytes in return, so message latency is most important in selecting an archie server. FTP sessions often transfer files of a megabyte or more, so throughput is more important in selecting an FTP site. I am investigating an architecture for providing replicated information services on the Internet, as shown in Figure 1. In this model, client systems use the information service to locate and access collections of information that I will call “files”. This information need not actually be provided as a file. The client software runs on a workstation, and uses the Internet to communicate with directory and storage services. The directory servers process user queries, returning locations and details about files that contain the requested information. A client can then contact storage servers to retrieve the file. This architecture enables an information service to use several performance-improving techniques. The service can dynamically cache interesting files at several sites throughout the internetwork, improving the distance a client must communicate to retrieve files. Different caching policies can be used depending on the kind of information – a new software distribution system can proactively create many copies, anticipating 1
future needs, while an information retrieval service can use semantic structure to cache information likely to be used. I have investigated quorum multicast protocols that will use preferred sites [Golding91, Golding92]. These protocols use an ordering on sites, and attempt to communicate with the best of them. The sites can be ordered, for example, from lowest to greatest latency. This approach requires accurate performance predictions. In the next three sections I will consider, first, predicting latency, then using these predictions. I will then discuss a separate experiment on predicting bandwidth. All of this work should be considered preliminary; sample sizes are not always large enough to ensure statistical accuracy and the analysis can surely be improved.
2 Predicting latency and loss This section is based upon my Master’s thesis work [Golding91], which in turn used ideas from Van Jacobson’s TCP implementation [Jacobson88]. I was investigating quorum multicast protocols, that send a message to a fixed-size subset of a set of sites. The subset is selected according to an ordering on the sites; for example, sites could be ordered by increasing expected response latency. Some of these protocols attempt to handle packet loss through retry. The site orderings and packet loss timers both required accurate predictions of expected communication latency. I conducted the performance evaluation by collecting samples of packet latency and loss, then using the traces to drive simulation. There were two such experiments, varying mainly in duration. I also built a simple quorum multicast implementation to verify the simulation results.
2.1
Methods
Trace records were obtained by polling the remote host from maple.ucsc.edu, a Sun 4/20 workstation in the Concurrent Systems Laboratory (CSL) at UC Santa Cruz. The measurement software was built atop the the ping program, which sends ICMP echo messages. Hosts are expected to respond to ICMP echo messages by returning the message as soon as possible. It polled each host 30 or 50 times (depending on the experiment) every 20 minutes. The first experiment lasted 48 hours; the second lasted one week. The first measurement experiment used 24 hosts chosen from those hosts with which CSL systems communicated regularly. The experiment collected 50 samples at one-second intervals every 20 minutes for each host, on a Wednesday and Thursday. This resulted in 7200 samples for each host. The hosts, and a summary of their behaviors, are reported in Table 1. One host, andreas.wr.usgs.gov, was unavailable for 7 of the 48 hours sampled; the other hosts appear to have been available the entire time. The second experiment was similar to the first, except that it involved more hosts and behavior was traced over an entire week. For this study I selected 125 hosts on the Internet from a list of several thousand Sun 4 systems. One set of polls was collected for each host every 20 minutes over a seven-day period. Each set of polls consisted of 30 ICMP echo requests issued at one-second intervals. This resulted in 15 120 samples for each host.
2.2
Packet loss behavior
Packet loss is the simplest measure to be obtained from the traces. I first examined the success rate for communicating with each host. The results for the 24-host experiment are reported in Table 1. In the this experiment I found that most hosts would respond to a message more than 90% of the time. The one exception (andreas.wr.usgs.gov) represented a host that appears to have been continuously unavailable for 7 of the 48 hours sampled. Combining this information with published results on the reliability of hosts, I
2
TABLE 1: Hosts selected for first study.
spica.ucsc.edu cs.stanford.edu apple.com ucbvax.berkeley.edu andreas.wr.usgs.gov fermat.hpl.hp.com ucsd.edu june.cs.washington.edu beowulf.ucsd.edu unicorn.cc.wwu.edu gvax.cs.cornell.edu prep.ai.mit.edu lcs.mit.edu vivaldi.helios.nd.edu acrux.is.s.u-tokyo.ac.jp swbatl.sbc.com zia.aoc.nrao.edu sdsu.edu inria.inria.fr top.cs.vu.nl slice.ooc.uva.nl cs.helsinki.fi mtecv1.mty.itesm.mx
Location Santa Cruz, CA Palo Alto, CA Cupertino, CA Berkeley, CA Menlo Park, CA Palo Alto, CA San Diego, CA Seattle, WA San Diego, CA Bellingham, WA Ithaca, NY Cambridge, MA Cambridge, MA Notre Dame, IN Tokyo, Japan Atlanta, GA Virginia San Diego, CA France Netherlands Netherlands Finland Mexico
Mean response latency (ms) 0.59 18.50 24.50 24.96 26.64 39.88 51.86 52.56 57.68 107.88 162.35 215.97 219.13 228.96 263.68 298.57 353.09 404.54 1142.99 1312.32 1340.40 1525.78 1641.70
3
Message success (%) 100.00 97.79 95.96 96.43 79.90 97.92 91.15 97.11 93.33 96.44 95.28 89.47 89.08 96.57 96.46 97.06 97.79 92.85 84.63 90.42 88.97 90.42 91.33
140
Cumulative number of hosts
120
100
80
60
40
20
0
0
20
40 60 Message success (%)
80
100
FIGURE 2: Overall packet delivery rates (1-packet loss rate). Average rate 80%.
conclude that communication will succeed most of the time when a host is functioning. The data from the 125-host experiment are less encouraging. In this set, four hosts were continuously unavailable for the entire seven days, while some hosts exhibited overall packet loss rates of more than 50%. All sample hosts selected were known to exist and function a few weeks before I recorded the traces, and it seems unlikely that these four hosts had been deliberately taken out of service in the interval. The mean loss rate was 20.0%, as compared to 6.7% for the 24-host experiment. Figure 2 shows the fraction of hosts with different overall packet loss rates. I conjectured that the packet loss rate might be related to the number of gateways that must pass the message. I plotted overall delivery rates against distance (Figure 3.) I had expected that nearby replicas, those that require three or four number hops to reach, would have high delivery rates. Indeed this appears to be the case. However, outside of this local organization the number of hops does not appear to be a good predictor of packet delivery. Packets can be lost for one of two reasons: they are lost in transmission, or the remote host is down. While host availability cannot be determined exactly, a host that does not answer any pings for 30 seconds is likely to have failed. This is not a perfect measure for two reasons: a gateway or link crash would appear to be a host failure, and because a very busy host could also appear to have failed. Bearing these limitations in mind, I computed an estimate of overall host availability as the fraction of 30-ping data sets containing at least one response to the total number of such data sets collected for the host. Figure 4 shows the distribution of overall availabilities in the 125-host experiment. Next, I examined the data sets to determine how long communication failures lasted. Failures were classified by the length of the run of lost packets, as shown in Figure 5 and in Tables 2 and 3. The first column in these tables lists those run lengths that contributed to 1% or more of the lost messages. The second column reports the percentage of lost messages that were in runs of each length. I found that in more than half the cases where a packet was lost, it was part of a run of only one or two. The only other significant run length was 30 or 50, the size of one data set, due to hosts being down for an entire data set. The third column in Tables 2 and 3 lists the percentage of lost packets that were not in runs of length 30. 4
100
Message success (%)
80
60
40
20
0
0
5
10
15 Host distance (hops)
20
25
30
FIGURE 3: Packet delivery versus distance.
140
Cumulative number of hosts
120
100
80
60
40
20
0
0
20
40 60 Availability (%)
80
FIGURE 4: Approximate host availability. Average availability 87.5%
5
100
30000
25000
Number of runs
20000
15000
10000
5000
0
0
5
10
15 Run length
20
25
30
FIGURE 5: Lengths of runs of failed messages.
This number approximates the percentage of each run length that is due solely to communication failure, such as congestion, loss of connectivity, or routing loops. I compared this distribution to what would be obtained if all communication failures were independent. This can be modeled as a Bernoulli trial with parameter . The parameter corresponds to the probability that a packet would be successfully acknowledged. The probability that a lost packet would be part of a run of length is 1 1 1 Values of this distribution are shown in the fourth column of Tables 2 and 3, for the 24-host and 125-host experiments respectively. If packet losses were independent, there would be many more single- or double-packet failures than were
TABLE 2: Fraction of lost packets by size of run (24-host experiment).
Length of run 1 2 3 11 12 13 17 50
Failure fraction (%) All failures Communication 50.04 67.81 6.87 9.31 1.33 1.80 1.99 2.70 3.47 4.70 1.52 2.07 0.77 1.04 26.22 —
Independent 93 32% 87.09 11.63 1.17 — — — — —
6
TABLE 3: Fraction of lost packets by size of run (125-host experiment).
Length of run 1 2 3 4 5 30
Failure fraction (%) All failures Communication 7.73 20.63 1.03 2.74 0.26 0.68 0.11 0.29 0.08 0.21 2.09 —
Independent 80 0% 64.00 25.60 7.68 2.05 0.51 —
35000
30000
Number of runs
25000
20000
15000
10000
5000
0
0
5
10
15 Run length
20
25
30
FIGURE 6: Lengths of runs of successful messages.
observed. The difference between the observed behavior and predicted behavior for independent failure leads to the unsurprising conclusion that packet losses are not independent events. There appear to be two behaviors for message failure: short, transient failures due to temporary network conditions, and longer failures due to host or network failure. These data indicate that an internetwork communication protocol would do well to retry failed messages. Further, it appears that most of the advantage can be obtained using a small number of retries. In the 125-host traces, when a sequence of three failures has been observed there is about a 60% probability that the host will be unreachable for the entire set of 30 or 50 polls. I also considered how many consecutive packets succeeded. As with failures, successful packets were classified by run length (Figure 6.) I found that there were many data sets in which all messages succeeded. However, I also found that there were many runs of a small number of successful messages. Short times between failures are further indication that failures tend to cluster.
7
6000
Latency (milliseconds)
5000
4000
3000
2000
1000
0
0
5
10
15 Host distance (hops)
20
25
30
FIGURE 7: Message latency versus distance.
2.3
Packet latency distribution
Communication latency was the second focus of the measurements. The values were obtained using a Sun 4/20 workstation that has a clock resolution of approximately 10 milliseconds. (This resolution is obvious in Figures 12 and 13.) The average response latency for hosts in the first experiment is reported in Table 1. As with packet loss, I was curious whether the number of gateways traversed in communicating with a host was related to the average latency. Figure 7 shows the latency against the distance in hops. It would appear that there may be some relation between the two. While the average latency may be of interest, its distribution is equally important. Figures 8 through 11 present four typical distributions. These graphs show histograms of the fraction of messages that fell into 10-millisecond ranges, starting from zero. Most hosts showed a very few short-latency messages, with a sudden peak dropping rapidly back to zero. The host sequoia.ucsc.edu (Figure 8) is at UC Santa Cruz, in the same organization as the host from which the measurements were taken. One gateway machine connects the Ethernets used by either machine. Most response times were sufficiently small that the 10-millisecond sampling resolution is of some concern. This curve is typical of the results observed for hosts on the same or nearby Ethernet segments. The latency distribution for bromide.chem.utah.edu (Figure 9) is typical of the distribution observed for hosts in North America. It is similar to that of a nearby host, but shifted toward greater latency. The distributions for the hosts cana.sci.kun.nl (Figure 10), a site in the Netherlands, and brake.ii.uib.no (Figure 11), a site in Norway, illustrate the range of distributions observed for overseas connections. The distribution for the Dutch host appears not unlike that of a host in North America, with the majority of messages having a small latency, though the variance is quite a bit larger. The Norwegian site exhibits a much more random distribution. I believe that the packets to this host are routed through a satellite channel, which usually causes high variability.
8
14000
12000
Number of messages
10000
8000
6000
4000
2000
0
0
100
200
300 400 Latency (milliseconds)
500
600
FIGURE 8: Distribution of communication latency for sequoia.ucsc.edu.
6000
Number of messages
5000
4000
3000
2000
1000
0
0
100
200
300 400 Latency (milliseconds)
500
600
700
FIGURE 9: Distribution of communication latency for bromide.chem.utah.edu. Average latency 87 milliseconds.
9
500 450 400
Number of messages
350 300 250 200 150 100 50 0
0
500
1000
1500 2000 2500 Latency (milliseconds)
3000
3500
4000
FIGURE 10: Distribution of communication latency for cana.sci.kun.nl. Average latency 938 milliseconds.
90 80
Number of messages
70 60 50 40 30 20 10 0
0
500
1000
1500 2000 2500 Latency (milliseconds)
3000
3500
4000
FIGURE 11: Distribution of communication latency for brake.ii.uib.no. Average latency 1653 milliseconds.
10
2.4
Predicting effective latency
The overall average values for communication latency and packet loss may not be good predictors of actual performance. It appears from the samples that failures cluster. Upon examining the traces it also appears that the latency of one message is related to the latency of the next. This section examines a way to predict latency and loss rate from recent past behavior. There are two uses for behavior prediction. First, the prediction can be used to select probably nearby sites. Second, it can also be used to adaptively set timeout values for detecting packet loss. The performance predictions can be based on a priori information, such as the topology of the network, or on observed behavior, such as past message latency. Most systems have used a moving average of recent behavior for prediction. This is used, for example, in most TCP implementations. of latency samples at time is The moving average of a sequence
where is the weight of new samples, 0 recurrence
1 This can also be written as the more convenient 1
1
Figure 12 illustrates how the moving averages of latency behave. This figure shows 100 samples of communication latency from a trace of communication with sequoia.ucsc.edu. Two curves show the effects of different weighting values. As long-latency samples are observed, the moving average rises, then decays back to a lower value as latency returns to normal. Figures 13, 14, and 15 show similar curves for the other three hosts considered in the last section. The moving average can be seen to track changes in behavior. The flat sections in Figure 14 (for cana.sci.kun.nl) and Figure 15 (for brake.ii.uib.no) represent failed samples. These are ignored when calculating moving averages. An appropriate timeout period for determining when messages have failed can be based on the predicted communication latency. The moving average at time is an estimate of the mean of the latency distribution for the next sample. While it is obvious from the latency distributions for cana.sci.kun.nl (Figure 10) and brake.ii.uib.no (Figure 11) that message latencies are not quite exponentially distributed, they can be used as such to calculate a timeout period. The parameter for the exponential distribution can be estimated for a sample using ˆ 1 , the maximum likelihood estimator. The exponential is used to estimate a reasonable upper bound for message latency by taking, say, its 95th percentile. The th percentile of the exponential approximating the predicted latency can be computed as ln 1
0 01
ln 1
ˆ
0 01
For the 95th percentile, this leads to the formula 95
2 995732
This computation is different from that proposed by Jacobson for his TCP system. His approach treats latency as normally distributed, and uses an approximation of the sample standard deviation to find a likely value for the timeout. I have not yet done any systematic comparison of the two approaches, but it is worth consideration. If this setting is to be useful for the timeout period, it must not be too short. When it is, the protocol will time out before a reply is received and either send another message or declare the host unavailable, even
11
30 Observed latency Moving average, w=0.75 Moving average, w=0.95 Overall average
Latency (milliseconds)
25
20
15
10
5
0 8300
8310
8320
8330
8340 8350 8360 Sample number
8370
8380
8390
8400
FIGURE 12: Sample moving averages of latency for sequoia.ucsc.edu.
200 Observed latency Moving average, w=0.75 Moving average, w=0.95 Overall average
180
Latency (milliseconds)
160
140
120
100
80
60 8300
8310
8320
8330
8340 8350 8360 Sample number
8370
8380
8390
8400
FIGURE 13: Sample moving averages of latency for bromide.chem.utah.edu.
12
1400 Observed latency Moving average, w=0.75 Moving average, w=0.95 Overall average
1300 1200
Latency (milliseconds)
1100 1000 900 800 700 600 500 400 8300
8310
8320
8330
8340 8350 8360 Sample number
8370
8380
8390
8400
FIGURE 14: Sample moving averages of latency for cana.sci.kun.nl.
4500 Observed latency Moving average, w=0.75 Moving average, w=0.95 Overall average
4000
Latency (milliseconds)
3500
3000
2500
2000
1500
1000 8300
8310
8320
8330
8340 8350 8360 Sample number
8370
8380
FIGURE 15: Sample moving averages of latency for brake.ii.uib.no.
13
8390
8400
TABLE 4: Fraction of replies rejected because of short timeout. 95th percentile used to set timeout. Moving average weight 0 95.
sequoia.ucsc.edu bromide.chem.utah.edu cana.sci.kun.edu brake.ii.uib.no
Fraction rejected No min 40ms min 3.17% 1.20% 0.27% 0.27% 0.54% 0.54% 0.19% 0.19%
though the reply was on its way. The expense of retrying or declaring failure is likely to be unacceptable, so any timeout setting must not reject too many valid messages. On the other hand, the timeout period must not be too long, since a protocol must wait for that period before a message can be determined to have failed. I examined the the traces using the 95th percentile estimator. The fraction of replies that were returned later than the estimated timeout period are shown in Table 4. It is very small for all but the nearby site, for which it was 3.17%. The estimated timeout period for this host often goes to zero. This occurs because the resolution of the trace samples is only 10 milliseconds, so the actual latency was almost always small enough to be recorded as zero. The fraction rejected dropped to 1.20% of successful replies upon applying a minimum timeout period of 40 milliseconds. While this is still high, from the distribution in Figure 8 it can be seen that the cutoff would have to be set to several hundred milliseconds to obtain less than 0 05% rejection fractions from this host. The average latency and variance are small enough that cutoff values more than about 40 milliseconds make no sense. Moving averages can also be applied to the estimation of failure probability. Given a sequence of samples 0 1 , the moving average
0
gives an approximation of the likelihood of failure. A large weight, that is, a value of near one, appears to work well by accounting for short-term failure behavior. The overall latency expectation is useful when a communication protocol is to selectively communicate with the replicas most likely to respond quickly. Given that the communication latency, probability of failure, and timeout period can all be estimated, the overall expected time is the sum of the expected latency and timeout period, weighted by failure probability: 1
95
Figure 16 shows a sample of this overall expectation for one of the sample hosts. The latencies shown in this figure for failed messages are the timeout periods for 0 95. The way the expectation responds to changing conditions is evident in the samples between 8330 and 8350, where the expectation changes from tracking actual latency in a low-failure period to averaging actual latency and time-out period in a high-failure period.
3 Effect of using nearby sites The quorum multicast protocols use the performance predictions discussed in the last section to attempt to optimize communication latency. These protocols provide the interface: 14
11000 Observed latency Failed messages Expected time, w=0.75 Expected time, w=0.95
10000 9000
Latency (milliseconds)
8000 7000 6000 5000 4000 3000 2000 1000 8300
8310
8320
8330
8340 8350 8360 Sample number
8370
8380
8390
8400
FIGURE 16: Expected communication latency for brake.ii.uib.no
quorum-multicast(message, site set, reply count, tuning parameter) reply set The message is sent to at least a reply count of the sites. If the protocol cannot communicate with at least that many sites, it reports an exception. The site set is assumed to be ordered (or orderable), perhaps using the latency predictions of the last section. The tuning parameter controls the eagerness with which some protocols contact less preferred sites, as will be explained shortly. I have investigated four variations of quorum multicast protocols. The naive protocol is the simplest: it sends one message to each site, and waits until it either receives enough replies or times out. The reschedule protocol tries to only contact the best possible sites by first sending enough packets to make the reply count, and sending packets to less favored sites when the first packets time out. This time out is set to a “delay” fraction of the normal message time out period, 0 1 In this way the reschedule protocol can behave like naive by setting the delay to zero, or it can use the fewest possible messages by setting to one. The retry and count protocols improve upon reschedule by retrying when packets are lost. They use different policies for doing so; the details are not relevant to this paper. Operation success is measured by the fraction of all multicast operations that were successful in meeting the reply count. In the simulations, the naive and reschedule protocols each exhibited an approximately constant success fraction, at about 82% of all operations. Since these two protocols each attempt to send at most one message to a replica, the delay parameter has no effect on the probability of success. The retry protocol, which retries nearby replicas more times when the delay parameter is larger, succeeds in more than 94% of all cases when 0 1, while count performs even better. The data obtained by measuring a test application show that all four protocols met the reply count more than 95% of the time. Count succeeded more often than the other protocols for almost all values of , with retry generally succeeding more often than naive and reschedule. These results are similar to the simulation results.
15
2400 Naive Reschedule Retry Count
2200 2000
Milliseconds
1800 1600 1400 1200 1000 800
0
0.2
0.4 0.6 Delay Parameter d
0.8
1
FIGURE 17: Communication latency for all operations.
For operations that are able to meet their reply count, naive is generally the fastest of the four protocols, since it always sends messages to every replica immediately. The communication latency for the other protocols increases approximately linearly as the delay parameter increases, taking about the same amount of time as naive at 0. Of the three, count takes longer than retry, which in turn takes very slightly longer than reschedule. Reschedule takes less time than the other two because of the rare cases where the retry and count protocols must send more than one message to distant replicas to obtain the reply count. The performance of the four protocols is quite different when the reply count cannot be met – all four protocols require several seconds to declare failure. While this is quite a long time, failures constitute only a few percent of all operations and the latency is not onerous. Naive is the baseline measure, requiring about 4 8 seconds to determine that a reply count cannot be obtained – almost an order of magnitude longer than was generally required for success. The latency of the other three protocols again increases roughly linearly in . Reschedule requires more time than naive since it must detect just as many failed messages, but it may have delayed sending some of those messages. Retry requires more time than all the others for most values of . Count performs much better than any of the other three protocols. It avoids the problem of having to communicate with the most distant replica, since it can stop when sufficient nearby replicas have failed. The measured results differ slightly because fewer messages failed. While simulation indicated that reschedule takes more time than naive to declare failure, and that this time increases with , the measured results show that the two have quite similar latencies. The sample size is small enough that this result is inconclusive. Figure 17 shows the overall latency for each protocol. Since the probability of meeting the reply count is quite high, the values for successful operations predominate in these graphs. However, it is worth noting that even with a high probability of success, the low failure latency of count makes it the fastest of the three quorum multicast protocols, consistently faster even than naive. Reschedule has the highest latency of the three for all values of . Retry is better than naive or reschedule for values of less than about 0 6. This is the reverse of their positions for successful operations. The latency of the quorum multicast 16
algorithms increases approximately linearly as increases. The overall measurement results are consistent with simulation results since the overall success rate was in excess of 95%, despite the differences in failure behavior.
4 Bandwidth While latency and packet loss are most important for communicating with directory services, available throughput or bandwidth is most important when transferring large amounts of information from a storage server. In this section I will present the results of an experiment to measure effective bandwidth between sites, and to determine if bandwidth can be predicted. The experiment consisted of a program that sent 1 000 000 bytes to the discard daemon on a remote site using TCP. The discard daemon, which normally listens on port 9, will receive any data and immediately discard it. Since TCP is a reliable stream protocol, the sender can estimate the bandwidth by measuring the time it takes to send the data. This estimation will not be completely accurate. The TCP protocol dynamically adjusts its window size and timeout values, and these values might not stabilize. The measurement program also cannot directly measure the transmission time; instead, it can only measure the rate at which the local kernel or TCP implementation accepts information. It seems unlikely that the TCP implementation will be able to buffer more than a tenth of a megabyte, so the accepted bandwidth is not likely to be more than 10% greater than the actual bandwidth. As inaccurate as this estimation of network bandwidth is, it is still arguably the right measure. An application is concerned with the actual end-to-end bandwidth, not with the maximum effective bandwidth. Factors such as kernel buffering and dynamic TCP behavior should be considered. In at least one storage system objects transferred in bulk are between one-half and two megabytes. I believe that the numbers measured here are useful. Table ?? summarizes the experiment. The measurement program ran at four sites: oak.ucsc.edu, a SparcStation 2, manray.berkeley.edu, a SparcStation 1, beowulf.ucsd.edu, a SparcStation 1, and slice.ooc.uva.nl, a SparcStation 1. These four sites polled thirteen sites, including each other. The measurement program run for the month of March 1992, polling once every four hours. The times were adjusted so that no two sites were polling simultaneously. The table lists the mean bandwidth observed and its variance. As expected, communication within one machine is more than an order of magnitude faster than sending packets on a network. Few of the other results were surprising: where there were low-capacity links (such as to Canada or Australia) very little bandwidth was available; sites connected close to the NSFnet backbone (Cornell and MIT) did much better. The variance, however, was much higher than expected, and dims the prospect for accurate prediction. Figures 18 through 26 show the bandwidth distribution for several different hosts, presented in roughly increasing order of “distance.” All these were measured from beowulf.ucsd.edu, but the results are similar to those observed from other hosts. The figures show the bandwidth for varying fractions of the samples. Accordingly, horizontal segments reflect large numbers of samples with similar bandwidth. in general, the more horizontal, the more consistent the samples. Figure 18 shows the distribution when beowulf is communicating with itself. There are a number of steps in the graph, indicating that many samples showed the same bandwidth. Figures 19 and 20 show connections from beowulf to hosts on the BARRnet. Both these sites show a few fast connections, as evidenced by the more vertical tail on the right, and a few slow connections, as shown by the left-hand end. The remainder of the samples are fairly uniformly distributed between 10 and 35 Kbytes/sec (for manray) or 20 and 50 kbytes/sec (for oak). The samples appear not to have an exploitable central tendency. 17
TABLE 5: Mean bandwidth, sampled from four sites.
oak oak.ucsc.edu manray.berkeley.edu beowulf.ucsd.edu slice.ooc.uva.nl cc.mcgill.ca cs.wwu.edu gvax.cs.cornell.edu ifi.uio.no inria.inria.fr lcs.mit.edu syd.dit.csiro.au top.cs.vu.nl uhunix.uhcc.hawaii.edu
1208899 18517 16906 3380 1776 4874 16693 1778 3050 12060 2477 4844 13362
manray 184077 10943 9409 1626 2314 1321 5800 1219 1904 6210 809 2518 6800
26778 703491 23520 3613 1699 5259 16022 1625 3395 14410 2872 4693 20641
beowulf
14503 111866 11637 1939 2377 1043 5642 1120 2377 7294 891 2863 7165
34931 25144 717695 4236 2905 5459 18465 1955 4186 15699 3042 5745 18730
1e+06 900000
Bandwidth (bytes/sec)
800000 700000 600000 500000 400000 300000 200000 100000 0
0
0.2
0.4 0.6 Sample fraction
0.8
FIGURE 18: Bandwidth distribution from beowulf to itself.
18
1
14710 9565 237711 2075 3168 1009 4495 1339 2618 8674 1018 2959 5585
slice 3425 3193 3209 636399 2237 2787 5791 5590 4432 4446 1466 6609 3522
1387 1378 1377 155168 1519 1269 1086 1039 1410 1152 652 302 1289
55000 50000
Bandwidth (bytes/sec)
45000 40000 35000 30000 25000 20000 15000 10000 5000
0
0.2
0.4 0.6 Sample fraction
0.8
1
0.8
1
FIGURE 19: Bandwidth distribution from beowulf to manray.
80000 70000
Bandwidth (bytes/sec)
60000 50000 40000 30000 20000 10000 0
0
0.2
0.4 0.6 Sample fraction
FIGURE 20: Bandwidth distribution from beowulf to oak.
19
30000
Bandwidth (bytes/sec)
25000 20000 15000 10000 5000 0
0
0.2
0.4 0.6 Sample fraction
0.8
1
0.8
1
FIGURE 21: Bandwidth distribution from beowulf to hawaii.
40000 35000
Bandwidth (bytes/sec)
30000 25000 20000 15000 10000 5000 0
0
0.2
0.4 0.6 Sample fraction
FIGURE 22: Bandwidth distribution from beowulf to mit.
20
6500 6000
Bandwidth (bytes/sec)
5500 5000 4500 4000 3500 3000 2500 2000 1500 1000
0
0.2
0.4 0.6 Sample fraction
0.8
1
FIGURE 23: Bandwidth distribution from beowulf to wwu.
Figures 21, 22, and 23 show samples taken to other US sites. The site in Hawaii is connected through NASA Ames, and exhibits the best performance of the three. The site at MIT is near an NSFnet gateway, but shows almost an almost uniform bandwidth distribution with a low near zero, excepting a slight spike at around 20 kbytes/sec. The site in Washington is connected using a low-speed modem to NorthWestNet, and provides bandwidth between 5 and 6 kbytes/sec about 80% of the time. The final three figures show connections outside the US. Figure 24 shows samples for McGill University, which uses a nearly-saturated 56 kbit/sec link to the US. The saturation is evident from graph: most of the samples show little bandwidth is available, but there is the occasional sample many times larger. This link is heavily used by the archie resource-location service. Figure 25 shows traffic to the Netherlands, and Figure 26 shows traffic to Australia. Both of these use low-speed transoceanic cables; performance is much lower than for most North American sites. However, the links do not appear to be saturated.
4.1
Predicting bandwidth
Bandwidth prediction is primarily useful on the Internet for ranking sites. One site will often have a choice of several others from which it can transfer some information, and it should be able to determine which site will provide the fastest service. This kind of prediction is not generally useful for multimedia applications, which need guaranteed performance. The Internet as currently built does not provide these guarantees, and the kind of performance prediction discussed in this paper does not provide a mechanism for them. As with latency, I have used moving averages of recent measurements as a predictor. I performed two variations on the analysis: a “cold start” evaluation that started all estimates at zero, and a “warm start” evaluation that first found the mean of all samples, then used that as an initial estimate. The former analysis should show how accurate the predictor is for the first several samples; the latter should show how the system behaves once it has reached a steady state. Tables 6 and 7 show how accurate this is. For these measures, I computed the absolute error between 21
14000
Bandwidth (bytes/sec)
12000 10000 8000 6000 4000 2000 0
0
0.2
0.4 0.6 Sample fraction
0.8
1
0.8
1
FIGURE 24: Bandwidth distribution from beowulf to mcgill.
7000
Bandwidth (bytes/sec)
6000 5000 4000 3000 2000 1000 0
0
0.2
0.4 0.6 Sample fraction
FIGURE 25: Bandwidth distribution from beowulf to slice.
22
5000 4500
Bandwidth (bytes/sec)
4000 3500 3000 2500 2000 1500 1000 500 0
0
0.2
0.4 0.6 Sample fraction
0.8
1
FIGURE 26: Bandwidth distribution from beowulf to csiro (Australia).
each sample and the moving-average prediction, and report the mean error and its deviation. The moving average used a weight of 0 9 so it responds slowly to changes. It appears that the moving average is not a particularly good predictor. The mean error for most sites is between 30 and 50% of the mean bandwidth, and the variance is high. The warm-start error is generally lower than the cold-start error, but the difference is not necessarily statistically significant. This indicates that either the moving average converges quickly, or the variability of bandwidth measurements is such that this predictor will not work well. I suspect the latter from the sample variance. A conditional autocorrelation of bandwidth samples should give some insight into the usability of this sort of predictor, by showing how much short-term and long-term variation is in the samples. A site will often need only to be able to rank sites, rather than determine accurately the real available bandwidth. This is a somewhat simpler problem, since it may be less sensitive to short-term performance variations. Table 8 shows how well moving-average predictions can be used to order sites. The table reports how much lower observed bandwidth is than the optimal, when moving averages are used to rank one, two, or three sites from the four measured. There is fairly high variance in this difference. The observed bandwidth from one site to another single best site is, on the average, less than ideal by a few kilobytes per second; however, this value is often 20–30% of the mean bandwidth measured from that site. This indicates that prediction is not working especially well, and that it behaves very badly at times. This is not surprising, given the variance in actual measured bandwidth.
4.2
Static prediction
The dynamic prediction mechanism discussed in the last section only responds to changes when communication has been attempted. It can only work well when communication is frequent. If a site is ranked as undesirable, or if a new site becomes available, there may be no up-to-date prediction information available. To remedy this, a site must be polled proactively to obtain the needed information. 23
TABLE 6: Mean error in “cold start” bandwidth prediction, in bytes per second, using a moving average with parameter 0 9 and an initial value of zero.
oak oak.ucsc.edu manray.berkeley.edu beowulf.ucsd.edu slice.ooc.uva.nl cc.mcgill.ca cs.wwu.edu gvax.cs.cornell.edu ifi.uio.no inria.inria.fr lcs.mit.edu syd.dit.csiro.au top.cs.vu.nl uhunix.uhcc.hawaii.edu
233701 7614 7253 1418 1511 1279 5505 953 1574 5032 825 2194 5877
266734 8967 7439 1038 1632 1122 4497 873 1295 4298 636 1726 4841
manray 11923 135152 9812 1723 1482 1228 5604 846 2027 6277 970 2467 6431
10407 162386 8618 1047 1719 1169 4137 834 1397 4021 737 1711 5599
beowulf 12941 8863 220178 1864 2458 1104 4348 1009 2430 7894 1068 2727 5213
11505 7578 178106 1199 2199 1113 3726 988 1497 5855 753 1486 4062
slice 1263 1235 1155 160777 1311 1109 1244 1258 1406 1193 578 899 1170
935 946 909 156185 828 767 1304 1236 1151 1013 503 1406 880
TABLE 7: Mean error in “warm start” bandwidth prediction, in bytes per second, using a moving average with parameter 0 9 and an initial value of .
oak oak.ucsc.edu manray.berkeley.edu beowulf.ucsd.edu slice.ooc.uva.nl cc.mcgill.ca cs.wwu.edu gvax.cs.cornell.edu ifi.uio.no inria.inria.fr lcs.mit.edu syd.dit.csiro.au top.cs.vu.nl uhunix.uhcc.hawaii.edu
123840 7282 6940 1287 1566 994 4589 925 1473 4504 596 2097 5288
142136 8510 6323 855 1565 867 3251 750 1102 3694 465 1319 4701
manray 11143 65539 9472 1607 1545 732 4507 865 1915 5480 743 2256 5938
24
9906 95656 6911 947 1661 767 3071 675 1246 3528 515 1499 4021
beowulf 11691 7838 195946 1754 2549 736 3469 997 2232 7042 856 2503 4483
8229 6017 138013 967 2018 705 2497 855 1331 4362 583 1366 3152
slice 1083 1092 1060 108590 1276 956 793 799 1222 911 526 234 969
766 744 773 119251 708 686 793 703 745 677 385 207 701
TABLE 8: Loss of aggregate bandwidth from one, two, and three sites selected using moving average predictions.
One site oak.ucsc.edu manray.berkeley.edu beowulf.ucsd.edu slice.ooc.uva.nl cc.mcgill.ca cs.wwu.edu gvax.cs.cornell.edu ifi.uio.no inria.inria.fr lcs.mit.edu syd.dit.csiro.au top.cs.vu.nl uhunix.uhcc.hawaii.edu
0 0 163 0 1960 460 3047 22 1429 3745 521 1394 3557
0 0 1475 0 2562 811 3895 129 1835 5187 784 1489 4775
Two sites 3637 2444 2257 1128 1740 536 3029 575 1591 3782 549 1707 2244
7563 6031 5763 1526 2801 989 3848 778 1967 5023 737 1905 4958
Three sites 0 0 0 1203 1256 158 79 497 1151 330 149 1550 0
0 0 0 1460 2050 457 440 708 1342 864 395 1727 0
One solution is to pool measurements from everywhere on the Internet to generate global, static prediction information. Global information has the advantage of being centrally computable, and not requiring large amounts of proactive sampling. It can also be adjusted according to network-wide policies to, say, favor communication between sites in the same country. I have investigated one such measure for predicting bandwidth between two sites, and . If the Internet consisted of an infinite-bandwidth backbone to which all sites were connected, then the bandwidth between any two sites would be the lesser of the bandwidths of the two connections to the backbone. Except for the site with the fastest connection, the bandwidth of a backbone connection would be equal to the maximum bandwidth observed between that site and any other site. If the bandwidth observed between two sites is denoted the estimated bandwidth is ˆ
min max
max
Table 9 shows the estimated bandwidth calculated for each of the four polling sites. This is always a poor estimator for communicating within a machine, since sending packets on a network always takes longer than simply buffering them internally. Between different machines, however, the estimator seems to reflect reality. These estimations can be averaged to give a single global measure. This is shown in the last row of Table 9. The estimator is to be used to rank sites according to predicted available bandwidth. If this is a good estimator, it should always select the site with the greatest available bandwidth. Different estimation methods can be compared by computing how close they come to the best possible selection. Table 10 shows this comparison. Each of the thirteen sites measured are assumed to be repeatedly attempting to communicate with the four polling sites, and must select the best one, two, or three sites. The table compares the global static measure just described with a dynamic moving-average estimator and with random selection. The bandwidth obtained using each of these estimators is compared to the optimal, and the table shows the overall difference. A dynamic moving-average selection appears to be the best selection method. It almost always gives a better selection than static selection, and when it does not the difference is minimal. Dynamic selection also properly handles cases where a host can communicate with itself, which the static measure does not. 25
TABLE 9: Transitive bandwidth estimations ˆ
oak manray beowulf slice Metric
Predict 18517 16906 18517 5791
oak Actual 1208899 18517 16906 3380
13738
and the global static measures derived from it.
manray Predict Actual 16906 26778 26778 703491 26778 23520 5791 3613
beowulf Predict Actual 18517 34931 26778 25144 34931 717695 5791 4236
slice Predict Actual 5791 3425 5791 3193 5791 3209 6609 636399
16492
17029
5791
TABLE 10: Comparison of the aggregate bandwidth loss from one, two, and three sites selected using either dynamic (moving-average) or static estimations.
oak.ucsc.edu manray.berkeley.edu beowulf.ucsd.edu slice.ooc.uva.nl cc.mcgill.ca cs.wwu.edu gvax.cs.cornell.edu ifi.uio.no inria.inria.fr lcs.mit.edu syd.dit.csiro.au top.cs.vu.nl uhunix.uhcc.hawaii.edu
Stat 1175960 674748 163 637264 1713 427 3227 3673 1658 4161 447 2072 5398
One site Dyn 0 0 163 0 1960 460 3047 22 1429 3745 521 1394 3557
Rand 892056 513407 531820 478300 2455 1288 7377 2904 2072 8276 1029 2386 10049
26
Stat 1188259 2444 2257 639073 2105 516 4030 4514 2553 3392 480 3386 2244
Two sites Dyn 3637 2444 2257 1128 1740 536 3029 575 1591 3782 549 1707 2244
Rand 611790 354510 365556 320508 2401 2026 10033 2606 2576 10235 1462 2954 13518
Three sites Dyn Rand 0 0 315587 0 0 183415 0 0 188656 639397 1203 161097 1628 1256 1536 158 158 1970 79 79 8602 4485 497 1602 2458 1151 1770 330 330 7550 149 149 1143 3269 1550 2172 0 0 10556 Stat
Both these methods are noticeably better than a random selection of a single site, but random selection gets better as the number of sites selected increases. When three of the four sites are to be selected, random is often better than the static selection. In general, it appears that the global static estimator does not work as well as a local dynamic estimator.
5 Future directions These measurements represent only a preliminary look at end-to-end performance prediction. There are several improvements to be made to these analyses. All of the measurements can be improved by increasing the amount of data. The latency measurements only cover one week for a select few hosts; a longitudinal study, covering more hosts, will allow a real analysis of the long-term stability of predictions and of the way the predictions respond to changes in the network. The bandwidth measurements likewise suffer from lack of data, and could be improved by obtaining more samples, between more hosts, and at finer resolution. Diurnal effects are currently invisible. These measurements could also collect routing information so that possible relations between bandwidth and number of hops could be evaluated. A conditional autocorrelation may show interesting relationships between one measurement and future measures for bandwidth, errors, and latency. It is likely that performance prediction need not be done on an individual host-to-host basis. Instead, a body of predictions can probably be shared among all the hosts in an organization. It seems likely that most hosts will be on one or a few LANs and will share a few common routes to the rest of the Internet. One would expect that all the hosts would therefore show similar communication behavior. Sharing the prediction information should improve the quality of predictions, by making more data available, and should reduce the frequency with which a prediction system should need to proactively collect performance information. At present it appears that static quality-of-service measures do not work well. This is unfortunate, since it means sites can only use information they have collected, and may have to proactively collect to determine what sites are distant. These effects can be mitigated somewhat by sharing a prediction database within an organization.
Acknowledgments This work was motivated by discussions with Alan Emtage and Peter Deutsch of McGill University. Matthew Lewis (Universiteit van Amsterdam), Eric Allman (Mammoth Project, UC Berkeley), Fred Korz (Columbia University), and Darrell Long (UC Santa Cruz) helped provide accounts for running the measurements. George Neville-Neil provided encouragement, proofreading, and helpful discussion.
References [Emtage92] Alan Emtage and Peter Deutsch. archie – an electronic directory service for the Internet. Proceedings of Winter 1992 Usenix Conference (San Francisco, 24–24 January 1992), pages 93–110 (January 1992). [Golding91] Richard A. Golding. Accessing replicated data in a large-scale distributed systems. Master’s thesis; published as Technical report UCSC–CRL–91–18 (June 1991). Computer and Information Sciences Board, University of California at Santa Cruz.
27
[Golding92] Richard A. Golding and Darrell D. E. Long. Quorum-oriented multicast protocols for data replication. Proceedings of 8th International Conference on Data Engineering (Tempe, Arizona, February 1992), pages 490–7 (February 1992). IEEE Computer Society Press. [Jacobson88] Van Jacobson. Congestion avoidance and control. Proceedings of SIGCOMM ’88, pages 314–29 (1988).
28