Cent. Eur. J. Geosci. • 6(2) • 2014 • 207-218 DOI: 10.2478/s13533-012-0175-y
Central European Journal of Geosciences
Ensemble of Ground Subsidence Hazard Maps using Fuzzy Logic Research Article
Inhye Park1 , Jiyeong Lee1 , Saro Lee2,3∗ 1 Department of Geoinformatics, University of Seoul, Siripdae-gil 13, Dongdaemun-gu, Seoul 130-743, Republic of Korea 2 Geoscience Information Center, Korea Institute of Geoscience & Mineral Resources (KIGAM), Gwahang-no 124, Yuseong-gu, Daejeon, 305-350, Korea 3 Korea University of Science and Technology, 217 Gajeong-ro Yuseong-gu, Daejeon 305-350, Korea
Received 06 November 2013; accepted 17 February 2014
Abstract: Hazard maps of ground subsidence around abandoned underground coal mines (AUCMs) in Samcheok, Korea, were constructed using fuzzy ensemble techniques and a geographical information system (GIS). To evaluate the factors related to ground subsidence, a spatial database was constructed from topographic, geologic, mine tunnel, land use, groundwater, and ground subsidence maps. Spatial data, topography, geology, and various ground-engineering data for the subsidence area were collected and compiled in a database for mapping groundsubsidence hazard (GSH). The subsidence area was randomly split 70/30 for training and validation of the models. The relationships between the detected ground-subsidence area and the factors were identified and quantified by frequency ratio (FR), logistic regression (LR) and artificial neural network (ANN) models. The relationships were used as factor ratings in the overlay analysis to create ground-subsidence hazard indexes and maps. The three GSH maps were then used as new input factors and integrated using fuzzy-ensemble methods to make better hazard maps. All of the hazard maps were validated by comparison with known subsidence areas that were not used directly in the analysis. As the result, the ensemble model was found to be more effective in terms of prediction accuracy than the individual model. Keywords: Ensemble modeling • fuzzy logic • ground subsidence • abandoned underground coal mine • GIS • Korea © Versita Sp. z o.o.
1.
Introduction
topography caused by readjusting the overburden above voids, such as those created by underground mining. Subsidence can result in major financial losses and pose risks to human life [1].
Ground subsidence is a geological hazard that has various causes, including changes in mining activity, excessive groundwater extraction, earthquake and volcanic activity, floods, and sudden or progressive ground collapse. It is also time-dependent deformation of the surface ∗
E-mail:
[email protected]
The coal industry played a major role in the development of the Korean economy from the 1960s to the late 1980s. However, most of these coal mines were abandoned in the 1990s when the profitability of the industry plummeted. Of the 173 coalmines operating in 1988 in Jeongseon, Kangwon-do (the largest coal mining region in Korea), none are in operation today. In addition, the water flowing 207
Unauthenticated Download Date | 3/20/16 7:27 PM
Ensemble of Ground Subsidence Hazard Maps
through these mines is contaminated with heavy metals, and eventually pollutes rivers and soil. The subsidence of underground mining cavities can threaten human life, property, and infrastructure, including railways, roads, houses, and other buildings. Ground recovery following subsidence is difficult and rehabilitation is expensive. Most countermeasures for ground subsidence involve simple reinforcement after the ground has already subsided [2–4]. As a result, it is important to have a systematic prediction and management plan for areas experiencing ground subsidence. Recent studies have analyzed ground subsidence hazards using the results of geological and geotechnical investigations and of probability, statistical, fuzzy algebra, and artificial neural network models in tandem with GIS applications [2, 4–15]. Some studies have assessed and identified areas with a high subsidence risk. For example, Ambrožiˇc and Turk [5] and Kim et al. [9] applied ANN models to predict ground subsidence. As a probabilistic model, Zahiri et al. [16] applied the weightsof-evidence technique to derive the rock fall potential associated with mining-induced subsidence. Kim et al. [6] and Oh and Lee [14] assessed the spatial ground subsidence hazard potential using GIS techniques with frequency ratio and weights-of-evidence models. Oh et al. [15] applied probabilistic-based sensitivity analysis to determine the effect of input factors on ground subsidence hazard maps. Esaki et al. [7] used a stochastic model to predict subsidence in coal mining areas, while Mancini et al. [13] applied a multi-criteria decision model to analyze salt mining activities. Choi et al. [11] constructed subsidence susceptibility maps based on fuzzy relations for an AUCM area. Lee and Park [4] applied frequency ratio and decision tree model to mapping GSH maps. For the same study site, Lee et al. [12] applied a logistic regression model, and Oh and Lee [15] integrated GSH maps using various models such as frequency ratio model, weight of evidence, logistic regression and artificial neural network model. According to the geological hazard, these models have been used to analyze landslide susceptibility mapping in many recent studies [17–27]. In this study, the fuzzy algebra model was used to integrate ground subsidence hazard maps, withthis model being used most frequently in analysis landslide susceptibility mapping [28–32]. Ercanoglu and Gokceoglu [28, 29] proposed an assessment of landslide susceptibility for landslide prone areas using fuzzy relationships, Pradhan et al. [30] and Sezer et al. [31] used neuro-fuzzy models to analysese landslide susceptibility, and Akgun et al. [32] applied Mamdani fuzzy algorithm for the assessment of landslide susceptibility mapping.
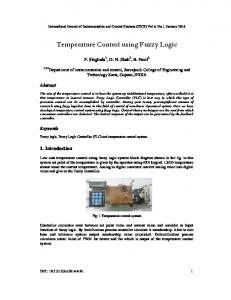
This study focused on the former coal mining area of Samcheok City, Korea. The study site covered approximately 2.10 km2 , as shown on a digital topographic map at a scale of 1:5,000 (Figure 1). The site lies between 37◦ 14’26”N–37◦ 15’24””N and 129◦ 2’40”E– 129◦ 3’30”E. Elevation in the area ranges from 194-454 m above sea level, with an average elevation of 266 m (standard deviation = 53.55 m). The Youngdong railroad, a local road (Route 38), and the Oship River cut through the center of the study area. The Oship Fault also cuts across the area. Coal was deposited during the upper Paleozoic and lower Mesozoic eras in the Jangseong Formation of the Pyeongan Supergroup and is almost entirely (85%) anthracite [33]. In the study area, twentyone indications of ground subsidence were identified near an AUCM in Samcheok City [34] (Figure 1). Although various models have been applied to determining ground subsidence hazard (GSH), including frequency ratio (FR), logistic regression (LR), and artificial neural network (ANN) approaches, no fuzzy-logic-based ensemble involving a combination of hazard maps involving FR, LR, and ANN models has been used to improve the prediction accuracy of GSH mapping. This study is the first attempt to ensemble individual GSH maps from FR, LR and ANN models using fuzzy logic, which will result in improved GSH maps in the Samcheok area, Korea. A fuzzy relation is simple to understand and can be easily incorporated into geographic information system (GIS) software, regardless of the quantity of data. It can address many of the problems relating to vagueness in spatial information [35] and express the probability of an event occurring as a normalized value between 0 and 1; it is therefore effective for comparing the results with other sites [11]. This paper applies an ensemble method using fuzzy logic to better predict subsidence using a single model. Individual GSH maps made using the FR, LR, and ANN approaches were integrated in order to improve the GSH maps for Samcheok, Korea. The study flow is shown in Figure 2. In the fuzzy-logic-based ensemble analysis, the GSH maps from the FR, LR, and ANN models were evaluated to identify new input or relevant factors, and ensemble GSH maps were recalculated quantitatively using these models. The ensemble GSH maps were validated using ground subsidence locations not used for training.
2.
Data
To create GSH maps, a spatial database was utilised to relate factors influencing ground- subsidence, including
208
Unauthenticated Download Date | 3/20/16 7:27 PM
I. Park et al.
Figure 1.
Study area in Korea.
the mine excavation method, depth and height of the mined cavities, degree of inclination of the excavation, structural geology, scope of mining, and flow of groundwater [1, 12, 34]. Field surveys revealed areas of ground subsidence at the study site, from which maps relevant to ground-subsidence occurrence were constructed in a vector format spatial database using the ArcGIS software package. Data sources included 1:5,000 scale topographic maps, 1:1,200 scale mine-tunnel maps, a 1:50,000 scale geological map, and 1:5,000 scale land use maps (Table 1) [15]. Contour (5 m intervals) and survey base points with elevation values were extracted from the topographic map, and a DEM was constructed from which the slope gradients were calculated. As a major factor in ground subsidence is the scope of the mine cavities [1, 36, 37], it was important to construct a database of the depths and distribution of mined cavities. The groundwater levels and permeability factors were extracted from 35 boreholes at the study site and mapped using an inverse distance weighting (IDW) interpolation method. Geological data was extracted from a 1:50,000 scale geological map from the Korea Institute of Geoscience and Mineral Resources and fourteen classes of land use were extracted from the land use map of the National Geographic Information
Institute.
The calculated and extracted factors, which included slope, depth of drift, distance from drift, depth of groundwater, permeability, geology, and land use were mapped to 1 m×1 m grid cells for analysis of the spatial ground subsidence hazard. Slope, depth to drift, distance from drift, depth of groundwater and permeability were representative oflinear and continuous data. In contrast, geology and land use data were non-linear and categorical. The independence of factors from each other was verified by comparing Pearson Correlation Coefficients. The study area was gridded into 1,742 rows by 1,207 columns (i.e. total number of grid cells = 2,102,594), in which there were 10,369 cells of ground subsidence areas. The subsidence locations were randomly divided into a training set (70%) to analyze ground subsidence hazards using the neuro-fuzzy models, and a validation set (30%) to validate the predicted hazard maps. The training and validation data consisted of 7,259 cells and 3,110 cells, respectively [15]. 209
Unauthenticated Download Date | 3/20/16 7:27 PM
Ensemble of Ground Subsidence Hazard Maps
Figure 2.
Table 1.
Study flow for ground subsidence hazard mapping.
Data layer related to ground subsidence of study area [15].
Category
Factors
Data Type
Scale
Remark
Hazard map
Subsidence
Polygon
1: 5000
Area of subsidence
Geology
Geology
Polygon
1: 50000
Type of strata
Topography
Slope
GRID
1: 5000
Calculate from DEM
Polyline
1: 1200
DEM minus sea level of drift
Distance from drift
Polygon
1: 1200
Buffering of drift
Depth of ground water
Point
Mined tunnel map Depth of drift
Borehole*
IDW (Inverse Distance Weight) 1: 5000
Land use
Permeability
Point
Land use
Polygon
interpolation 1: 5000
Type of land use
*35 boreholes from investigation in 1999, some boreholes do not have value of relating factors.
3.
Method
The main concept of ensemble modeling is to improve the prediction accuracy based on multiple outputs from a set of models using a fuzzy operator. Specifically, it
results in more accurate and reliable estimates for making decisions than can be obtained using an FR, LR, or ANN model alone. This study used FR, LR, and ANN models in the initial analysis. The resulting GSH maps from each model were used as new input factors for a subsequent
210
Unauthenticated Download Date | 3/20/16 7:27 PM
I. Park et al.
analysis to generate ensemble-based GSH maps using a fuzzy operator. In other words, the relationships between ground subsidence locations and three new input factors were identified and re-quantified using a fuzzy operator to generate improved GSH maps.
3.1. Ground subsidence hazard mapping using various models
a logistic regression of presence or absence of ground subsidence on the independent variables. Using this approach, logistic multiple regression coefficients of the related factors were calculated. After interpretation, equation (4) (which predicts the ground subsidence-occurrence possibility) was created (Table 3 in [15]): Z = (−0.126 × SLOPE) + (−0.001 × DEPTHDRIFT)
Using the frequency ratio, the spatial relationship between ground subsidence occurrence and subsidencerelated factor was derived. The data layers containing scale factors were subdivided into a convenient number of classes, and the class or type of each factor was obtained as the subsidence occurrence ratio [12, 15]. The GSH index (GSHIF R ), equation (1), was calculated by a summation of each factor ratio value [38], where F Rn is the frequency ratio of each subsidence-related factor type or range: GSHIF R = F R1 + F R2 + F R3 + . . . + F Rn
(1)
The relation analysis is the ratio of the area where subsidence occurred to the total area. Therefore a high probability indicated a greater hazard to ground subsidence, while a lower value indicated a lower hazard. Logistic regression, which is one of the multivariate analysis models used, allows one to form a multivariate regression relation between a dependent and several independent variables. In the present situation, the dependent variable is binary, representing the presence or absence of ground subsidence. The quantitatively relationship between the occurrence and its dependency on several variables can be expressed as [6, 15]: p=
1 1 + e−x
(2)
where p is the probability of an event occurring that is the estimated probability of ground subsidence occurrence in these circumstances. The probability varies from 0 to 1 on an S-shaped curve and z is a linear function. When there are multiple explanatory variables z can be expressed as [12, 15]: z = b0 + b1 x1 + b2 x2 + . . . + bn xn
(3)
where b0 is the intercept of the model, the bi (i = 0, 1, 2, . . . , n) are the slope coefficients of the logistic regression model, and the xi (i = 0, 1, 2, . . . , n) are the independent variables. The linear model formed is then
+ (−0.071 × DISTDRIFT) + (0.532 × WATERLEVEL) + (−0.555 × PERMEABILITY) + GEOLOGYa + LANDUSEa − 26.351, (4) where SLOPE is slope value; DEPTHDRIFT is depth of drift, DISTDRIFT is the distance from the drift, WATERLEVEL is the depth to the groundwater level, PERMEABILITY is permeability value, GEOLOGYa and LANDUSEa is the logistic regression coefficient value, and Z is a prediction parameter. The ANN model is a ”computational mechanism able to acquire, represent, and compute a mapping from one multivariate space of information to another, given a set of data representing that mapping” [39]. It provides a network which can generalize and predict outputs from inputs that it has not previously seen. The most frequently used ANN model is the back propagationlearning algorithm, which trains the network until some target minimal error is achieved between the desired and actual output values of the network [15]. Oh and Lee [15] built up the network which consisted of three layers; input, hidden and output layers for analysis ground subsidence hazard. The structure of 7×14×2, input, hidden and output layers, respectively, was selected for the networks with input data normalized to the range 0.1 to 0.9. The learning rate parameter was set to 0.01 and the momentum parameter was set to 0.01. The subsidence-prone (occurrence) locations and the locations that were not prone to subsidence were selected as training sites. From each of the two classes, 7,259 grid cells per class were selected as training cells. Areas where the GSHILR was zero were classified as ’areas not prone to subsidence’, and areas where subsidence was known were assigned to an ’areas prone to subsidence’ training set. To lessen the error between the predicted output values and the actually calculated output values, the back propagation algorithm was used. The ground subsidence hazard index value was acquired by calculating the weights determined from back propagation and the spatial database [15]. Oh and Lee [15] applied and compared FR, WOE (weight of evidence), LR, ANN and their integrated models to mapping GSH maps for the same study area. The four 211
Unauthenticated Download Date | 3/20/16 7:27 PM
Ensemble of Ground Subsidence Hazard Maps
GSH maps were developed and reflected as the new input factors and integrated using FR, WOE, LR, and ANN models to make a hazard map. As a result, integrated GSH maps used four new subsidence-related input factors that showed a greater accuracy than individual models. In this study, three GSH maps were used using individual models (FR, LR and ANN) of Oh and Lee [15] as input factors and applied ensemble method to create GSH maps using fuzzy operator.
3.2.
Fuzzy logic and operator
The fuzzy set theory was used to integrate the calculated subsidence hazard indices through each model in this study. The fuzzy set theory introduced by Zadeh [40] is one of the tools used to handle the complex problems, and is utilized across many disciplines. The concept of fuzzy logic is to consider the spatial objects on a map as members of a set. In the classical set theory, an object is a member of a set if it has a membership value of 1, or is not a member if it has a membership value of 0. In the fuzzy set theory, membership can take on any value between 0 and 1 reflecting the degree of certainty of membership. The fuzzy set theory employs the idea of a membership function that expresses the degree of membership with respect to some attribute of interest. Zimmerman [41] discussed a variety of combination rules. Bonham-Carter [42] discussed five operators, namely the fuzzy and, fuzzy or, fuzzy algebraic product, fuzzy algebraic sum and fuzzy gamma operator. This study uses the fuzzy gamma operator for combining the fuzzy membership functions. The Fuzzy Algebraic Product is defined as: µcombination =
n Y
µi
where λ is a parameter chosen in the range (0,1), and the fuzzy algebraic sum and fuzzy algebraic product are calculated using equations (5) and (6) respectively. In the fuzzy gamma operation, when λ is 1 the combination is the same as the fuzzy algebraic sum, and when λ is 0 the combination equals the fuzzy algebraic product. Judicious choice of λ produces output values that ensure a flexible compromise between the ’increase’ tendencies of the fuzzy algebraic sum and the ’decrease’ effects of the fuzzy algebraic product. Like the membership function, the frequency ratio was calculated. The spatial relationships between the subsidence location and each subsidence-related factor were analyzed by using the probability model-frequency ratio. The frequency ratio, a ratio between the occurrence and absence of subsidence locations in each cell, was calculated for each factor’s type or range that had been identified as significant with respect to causing ground subsidence. An area ratio for each factor’s type or range to the total area was calculated. Finally, frequency ratios for each factor’s type or range were calculated by dividing the subsidence occurrence ratio by the area ratio. If the ratio was greater than 1, the relationship between subsidence locations and the factors was higher and, if the ratio was less than 1, the relationship between subsidence location and each factor’s type or range was lower. The frequency ratio was then normalized between 0.00 and 1.00 to create the fuzzy membership value.
4.
Results
4.1. Ensemble-based ground subsidence hazard mapping using fuzzy operator
(5)
i=1
where µi is the fuzzy membership function for the ith map, and i = 1, 2, . . . , n maps are to be combined. The fuzzy algebraic sum is complementary to the fuzzy algebraic product, being defined as: µcombination = 1 −
n Y
(1 − µi ).
(6)
i=1
The gamma operation is defined in terms of the fuzzy algebraic product and the fuzzy algebraic sum by: µcombination = (Fuzzy algebraic sum)λ · (Fuzzy algebraic product)1−λ , (7)
The ensemble methodology integrates factors causing ground subsidence to generate a GSH map. The input factors used to produce three GSH maps using the FR, LR and ANN models included slope, depth of the drift, distance from the drift, depth of groundwater, permeability, geology, and land. The index used for the hazard maps was classified into seven classes, using the equal area approach in the GIS environment for cases in which each class did not have a similar number of cells for the total area based on the distribution area of GSHILR. The first class comprised 40% of the area, while the remaining six classes (classes 2 to 7) each comprised 10% of the area. The first class of GSHIFR and GSHIANN was set to 40% of the study area because the GSHILR value of the 0.00 value (the first class) comprised 41.64% of the study area. The other hazard map classes were each set to 10% of the study area with a similar number of cells in the remaining
212
Unauthenticated Download Date | 3/20/16 7:27 PM
I. Park et al.
(a)
(b)
213
Unauthenticated Download Date | 3/20/16 7:27 PM
Ensemble of Ground Subsidence Hazard Maps
(c)
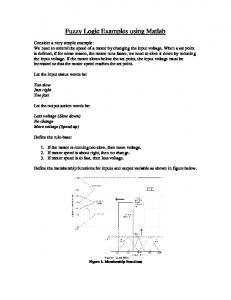
Figure 3.
Subsidence susceptibility map created using fuzzy gamma operator λ = 0.1, 0.2 and 0.6) model. The index was classified into five classes based on area for easy and visual interpretation: very high, high, medium, low, and very low index ranges in 10%, 10%, 20%, 20%, and 40% of the study area, respectively; (a) fuzzy gamma operator (λ = 0.1), (b) fuzzy gamma operator (λ = 0.2), (c) fuzzy gamma operator (λ = 0.1, 0.2, 0.6).
4.2.
area.
The input factors were combined to assign membership functions. Three factors (GSHIFR, GSHILR, and GSHIANN) were combined to generate the final hazard map using a fuzzy gamma operator. The value of λ was set to 0.1, 0.2, 0.3, 0.4, 0.5, 0.6, 0.7, 0.8 and 0.9 to determine its effect on the GSH map.
Using the fuzzy membership function (Table 2) and the fuzzy operator (from equations 5 to 7), the GSHI values were computed for the 9 cases in which the gamma operator was used. The computed GSHI values were mapped to allow interpretation, as illustrated in Figure 3. The values were classified into equal areas and grouped into five classes for visual interpretation.
Validations
The quality of a GSH method can be validated by using ground subsidence information. The success rate was determined by comparing the locations of subsidence that were not used for training the model and the hazard maps created using the FR, LR, and ANN models and ensemble method (Figure 4). The success rate illustrated how well the estimators performed. To obtain the relative ranks of each prediction pattern, the calculated index values of all cells in the study area were sorted in descending order and divided into 100 classes at 1% intervals. To quantify the results, the area under the curve (AUC) was recalculated for a case in which the total area was represented by 1; i.e., a perfect prediction accuracy. The area ratio under the curve is shown in the second column of the Table 3. In ensemble case using fuzzy gamma operator (λ = 0.6 to
214
Unauthenticated Download Date | 3/20/16 7:27 PM
I. Park et al.
Table 2.
Spatial relationships between subsidence and subsidence hazard maps from FR, LR and ANN models.
Factor
FR
LR
ANN
Class
No. of
% of
No. of
subsidencea
% of
Fuzzy
subsidence
pixels in
pixels in
membership
domainb
domain
value
1.41-4.58
15
0.21
847,380
40.30
0.0006
4.59-5.43
88
1.21
209,917
9.98
0.0134
5.44-6.84
25
0.34
209,727
9.97
0.0038
6.85-8.71
164
2.26
209,212
9.95
0.0251
8.72-10.75
305
4.20
209,590
9.97
0.0465
10.76-13.50
159
2.19
208,771
9.93
0.0243
13.50-37.22
6,503
89.59
207,997
9.89
0.9996
0
32
0.44
875552
41.64
0.0011
0-0.002363
22
0.30
225012
10.70
0.0030
0.002364-0.004726
18
0.25
221330
10.53
0.0025
0.004727-0.009451
130
1.79
197680
9.40
0.0198
0.009452-0.0212656
218
3.00
195280
9.29
0.0337
0.0212657-0.0708854 414
5.70
193962
9.22
0.0644
0.0708854-0.602526
6,425
88.51
193778
9.22
1.0004
0.0066-0.2834
101
1.39
841159
40.01
0.0039
0.2835-0.3603
118
1.63
210242
10.00
0.0182
0.3604-0.4295
54
0.74
210256
10.00
0.0083
0.4296-0.5025
130
1.79
210241
10.00
0.0200
0.5026-0.5794
201
2.77
210232
10.00
0.0309
0.5795-0.6986
163
2.25
210245
10.00
0.0251
0.6987-0.9868
6,492
89.43
210219
10.00
0.9995
0.9), the 90%-100% (10%) class with the highest possibility of a subsidence contained 58% and the 80-100% class (20%) contained 69% of the subsidence of study area. For the fuzzy-based ensemble product, the area ratio was 0.9798; i.e., the prediction accuracy was 97.98%. For the gamma operator (λ = 0.6 to 0.9), the area ratio was 0.9789 and the prediction accuracy was 97.89%. In comparison, the GSH maps using seven factors and the FR, LR, and ANN models had 95.54%, 96.89%, and 94.45% prediction accuracy, respectively, after applying the AUC method. Moreover the integration GHS maps using FR, LR and ANN models showed 96.46%, 97.20%, and 96.70% prediction accuracy, respectively [15]. According to ensemble cases, the accuracy of fuzzy-based ensemble method for analysis subsidence hazard was the higher the other methods using FR, LR and ANN models. Therefore, the predicted hazard using the ensemble method using a fuzzy operator was relatively accurate in terms of locating actual ground subsidence occurrences.
Table 3.
Prediction accuracies calculated by the area ratio under the rate curve between a map of the reported subsidence areas and the produced hazard maps for all 9 cases.
Tested fuzzy operators
Area ratio under the curve
Fuzzy gamma (λ = 0.1)
0.9793
Fuzzy gamma (λ = 0.2)
0.9789
Fuzzy gamma (λ = 0.3)
0.9789
Fuzzy gamma (λ = 0.4)
0.9789
Fuzzy gamma (λ = 0.5)
0.9789
Fuzzy gamma (λ = 0.6)
0.9798
Fuzzy gamma (λ = 0.7)
0.9798
Fuzzy gamma (λ = 0.8)
0.9798
Fuzzy gamma (λ = 0.9)
0.9798
215
Unauthenticated Download Date | 3/20/16 7:27 PM
Ensemble of Ground Subsidence Hazard Maps
thought to be caused by ensemble the analysis models those had been validated as subsidence hazard prediction methods through previous studies. Consequently, it can be concluded that the ensemble model using fuzzy operator is better than the individual model. Secondly, for the five classes of hazard rank (very high 10% of the study area, high 10%, medium 20%, low 20%, and very low 40%), the occurrence subsidence ranged from 93-98% in the very high-, and high-rank area, and 2-7% in the medium-, low-, and very-low-rank areas, respectively. Therefore, the classification of hazard ranks provides a quantitative spatial interpretation of subsidence and can delineate the predicted hazardous portions of residential and industrial areas.
Figure 4.
5.
Success rate curves showing the cumulative percentage of subsidence (y-axis) for the descending ordered ground subsidence hazard index (GSHI) rank (x-axis) in the case of a fuzzy gamma operator (λ = 0.1, 0.2, 0.6), logistic regression and integrated logistic regression models.
Discussion and conclusion
Minimizing the damage due to coalmine subsidence requires accurate estimations of locations vulnerable to ground subsidence and efficient prevention work. This study applied an ensemble method using fuzzy logic to predict coalmine subsidence in terms of susceptibility at an abandoned underground coal mine. The GSH maps obtained using individual models using the frequency ratio, logistic regression, and artificial neural network methods were used as control factors. The relative weights of these control factors were calculated and then normalized using a fuzzy membership function. The fuzzy gamma operator was used to evaluate ground subsidence susceptibility and the results were validated through a comparison with known subsidence locations and a field survey. This study had two main conclusions: Firstly, for the ensemble model using fuzzy gamma operator, for most values of λ the resulting maps had the best accuracy of 97.98%. In the cases of individual models, the integrated LR model had the greatest accuracy (97.20%), while the artificial neural network model had the poorest accuracy (94.45%) [15]. Comparing the individual and ensemble ground subsidence hazard maps, the maps derived by ensemble model showed the better result. These are
For effective performance prediction, the ensemble method using fuzzy operator should be tested in other geospatial application areas. This method is not widely used, so more case studies are required to check the ensemble approach. Using the ground subsidence hazard map, current or future ground subsidence hazard locations where collapse has not previously occurred or been suspected can be predicted. Therefore, based on the map, ground subsidence hazards can be anticipated, and subsequent planning for land use, development and policiescan be undertaken efficiently. Furthermore, if the same analyses are performed in other areas where the factors relevant to ground subsidence are present, time and cost can be saved by predicting ground subsidence effectively.
Acknowledgments This research was supported by the Basic Research Project of the Korea Institute of Geoscience and Mineral Resources (KIGAM) funded by the Minister of Science, ICT and Future Planning of Korea.
References [1] Waltham A. C., Ground subsidence. Blackie & Son Ltd, New York, 1989 [2] Oh H. J., Ahn S. C., Choi J. K., Lee S., Sensitivity analysis for the GIS-based mapping of the ground subsidence hazard near abandoned underground coal mines, Environ. Earth Sci., 64, 2011, 347-358 [3] Lee S., Park I., Choi J. K., Spatial Prediction of Ground Subsidence Susceptibility Using an Artificial Neural Network., J. Environ. manage., 49, 2012, 347358
216
Unauthenticated Download Date | 3/20/16 7:27 PM
I. Park et al.
[4] Lee S., Park I., Application of decision tree model for the ground subsidence hazard mapping near abandoned underground coal mines, J. Environ. manage., 127, 2013, 166-176 [5] Ambrožiˇc T., Turk G., Prediction of subsidence due to underground mining by artificial neural networks., Comput. Geosci., 29, 2003, 627-637 [6] Kim K. D., Lee S., Oh H. J., Choi J. K., Won J. S., Assessment of ground subsidence hazard near an abandoned underground coal mine using GIS, Environ. Geol., 50, 2006, 1183-1191 [7] Esaki T., Djamaluddin I., Mitani Y., A GIS-based prediction method to evaluate subsidence-induced damage from coal mining beneath a reservoir, Kyushu, Japan, Q. J. Eng. Geol. Hydroge., 41, 2008, 381-392 [8] Turer D., Nefeslioglu H. A., Zorlu K., Gokceoglu C., Assessment of geo-environmental problems of the Zonguldak province (NW Turkey), Environ. Geol., 55, 2008, 1001-1014 [9] Kim K. D., Lee S., Oh H. J., Prediction of ground subsidence in Samcheok City, Korea using artificial neural networks and GIS, Environ. Geol., 58, 2009, 61-70 [10] Quanyuan W., Jiewu P., Shanzhong Q., Yiping L., Congcong H., Tingxiang L., Limei H., Impacts of coal mining subsidence on the surface landscape in Longkou city, Shandong Province of China, Environ. Earth Sci., 59, 2009, 783-791 [11] Choi J. K., Kim K. D., Lee S., Won J. S., Application of a fuzzy operator to susceptibility estimations of coal mine subsidence in Taebaek City, Korea, Environ. Earth Sci., 59, 2010, 1009-1022 [12] Lee S., Oh H. J., Kim K. D., Statistical Spatial Modeling of Ground Subsidence Hazard near an Abandoned Underground Coal Mine, Disaster Advances, 3, 2010, 11-23 [13] Mancini F., Stecchi F., Gabbianelli G., GIS-based assessment of risk due to salt mining activities at Tuzla (Bosnia and Herzegovina), Eng. Geol., 109, 2009, 170-182 [14] Oh H. J., Lee S., Assessment of ground subsidence using GIS and the weights-of-evidence model., Eng. Geol., 115, 2010, 36-48 [15] Oh H. J., Lee S., Integration of ground subsidence hazard maps of abandoned coal mines in Samcheok, Korea, Int. J. Coal Geol., 86, 2011, 58-72 [16] Zahiri H., Palamara D. R., Flentje P., Brassington G.M., Baafi E., A GIS-based Weights-of-Evidence model for mapping cliff instabilities associated with mine subsidence, Environ. Geol., 51, 2006, 377-386 [17] Pradhan B., A comparative study on the predictive ability of the decision tree, support vector machine
[18]
[19]
[20]
[21]
[22]
[23]
[24]
[25]
[26]
[27]
[28]
[29]
and neuro-fuzzy models in landslide susceptibility mapping using GIS, Comput. Geosci., 51, 2013, 350365 Pradhan B., Chaudhari, A., Adinarayana, J., Buchroithner M. F., Soil erosion assessment and its correlation with landslide events using remote sensing data and GIS: A case study at Penang Island, Malaysia, Environ. Monit. Assess., 184(2), 2012, 715727 Pradhan B., Mansor, S., Pirasteh, S., Buchroithner M. F., Landslide hazard and risk analyses at a landslide prone catchment area using statistical based geospatial model, Int J Remote Sens., 32(14), 2011, 4075-4087 Lee M. J., Choi J. W., Oh H. J., Won J. S., Park I., Lee S., Ensemble-based landslide susceptibility maps in Jinbu area, Korea, Environ. Earth Sci., 67(1), 2012, 23-37 Lee S., Dan N. T., Probabilistic landslide susceptibility mapping in the Lai Chau province of Vietnam: focus on the relationship between tectonic fractures and landslides, Environ. Geol., 48, 2005, 778-787 Lee S., Hwang J., Park I., Application of data-driven evidential belief functions to landslide susceptibility mapping in Jinbu, Korea, Catena, 2013, 100, 15-30 Lee S., Sambath T., Landslide susceptibility mapping in the Damrei Romel area, Cambodia using frequency ratio and logistic regression models, Environ. Geol., 50, 2006, 847-855 Lee S., Song K. Y., Oh H. J., Choi J., Detection of landslides using web-based aerial photographs and landslide susceptibility mapping using geospatial analysis, Int J Remote Sens., 33(16), 2012, 4937-4966 Oh H. J., Lee S., Cross-application used to validate landslide susceptibility maps using a probabilistic model from Korea, Environ. Earth Sci., 64(2), 2011, 395-409 Oh H. J., Lee S., Landslide susceptibility mapping on Panaon Island, Philippines using a geographic information system, Environ. Earth Sci., 62(5), 2011, 935-951 Oh H. J., Park N. W., Lee S. S., Lee, S., Extraction of landslide-related factors from ASTER imagery andits application to landslide susceptibility mapping, Int J Remote Sens., 33(10), 2012,545084, 3211-3231 Ercanoglu M., Gokceoglu C., Assessment of landslide susceptibility for a landslide prone area (North of Yenice, NW Turkey) by fuzzy approach, Environ. Geol., 41(6), 2002, 720-730 Ercanoglu M., Gokceoglu C., Use of fuzzy relations to produce landslide susceptibility map of a landslide
217
Unauthenticated Download Date | 3/20/16 7:27 PM
Ensemble of Ground Subsidence Hazard Maps
[30]
[31]
[32]
[33]
[34]
prone area (West Black Sea Region, Turkey), Eng. Geol., 75(3/4), 2004, 229-250 Pradhan B., Sezer E. A., Gokceoglu C., Buchroithner, M.F., Landslide susceptibility mapping by neurofuzzy approach in a landslide prone area (Cameron Highland, Malaysia), IEEE T Geosci Remote, 48(12), 2010, 4164-4177 Sezer E. A., Pradhan B., Gokceoglu C., Manifestation of an adaptive neuro-fuzzy model on landslide susceptibility mapping: Klang valley, Malaysia, Expert Syst Appl., 38(7), 2011, 8208-8219 Akgun A., Sezer E. A., Nefeslioglu H. A., Gokceoglu C., Pradhan B., An easy-to-use MATLAB program (MamLand) for the assessment of landslide susceptibility using a Mamdani fuzzy algorithm, Comput. Geosci., 38(1), 2012, 23-34 Geological Society of Korea, Gosari geological map sheet. Korea Institute of Geoscience and Mineral Resources, Daejeon, 1962 Coal Industry Promotion Board, Fundamental investigation report of the stability test for Gosari. Coal Industry construction method of subsidence prevention, Coal Industry Promoton Board, Seoul, 99, 1999, 7-22
[35] Robinson V. B., A perspective on the fundamentals of fuzzy sets and their use in geographic information systems, Trans GIS, 7, 2003, 3-30 [36] National Coal Board, Subsidence engineer’s handbook. National Coal Board Mining Department, London, 1975 [37] Goel S. C., Page C. H., An empirical method for predicting the probability of Chimney Cave occurrence over a mining area, Int. J. Rock Mech. Min. Sci. Geomechanics, 19, 1982, 325-337 [38] Lee S., Min K., Statistical analysis of landslide susceptibility at Yongin, Korea, Environ. Geol., 40, 2001, 1095-1113 [39] Garrett J. H., Where and why artificial neural networks are applicable in civil engineering, J. Comput. Civil Eng., 8, 1994, 129-130 [40] Zadeh L. A., Fuzzy sets, IEEE Inform. Control, 8, 1965, 338-353 [41] Zimmerman H. J., Fuzzy set theory and it applications. Kluwer Academic Publisher, Massachusetts, 1996 [42] Bonham-Carter G. F., Geographic Information Systems for Geoscientists: Modeling with GIS. Pergamon, Ontario, 1994
218
Unauthenticated Download Date | 3/20/16 7:27 PM