Av. Eugenio Garza Sada 2501 ... Controlling: To track project compliance with the plans; .... COCOMO also estimates effort and duration per project phase. 3.
Proceedings of the 2010 Winter Simulation Conference B. Johansson, S. Jain, J. Montoya-Torres, J. Hugan, and E. Yücesan, eds.
ESTIMATING THE IMPLEMENTATION TIME FOR DISCRETE-EVENT SIMULATION MODEL BUILDING Leonardo Chwif
Jerry Banks
Escola de Engenharia Mauá Praça Mauá 1 São Caetano do Sul, 09580-900, BRAZIL
Tecnológico de Monterrey Av. Eugenio Garza Sada 2501 Monterrey, 64849, NL, MÉXICO
Marcos Ribeiro Pereira Barretto Universidade de São Paulo Av. Prof. Mello Moraes 2231 São Paulo, 05508-900, BRAZIL
ABSTRACT There are several techniques for estimating cost and time for software development. These are known in software engineering as “software metrics.” LOC (lines of code), COCOMO (COnstructive COst Model), and FPA (Function Point Analysis) are examples of such techniques. Although Discrete Event Simulation Modeling (DESM) has some differences from classical software development, it is possible to draw a parallel between these techniques and DESM. This article reviews some of the metrics from software engineering, and, based on those, proposes a metric for estimating time for the implementation of a simulation model using one specific simulation software. The results obtained for 22 real simulation projects showed that the proposed technique can estimate the time for software development with acceptable accuracy (average error of 6% and maximum absolute error of 38%) for models that have less that 200 simulation objects. 1
INTRODUCTION
Effective management of any process requires modeling, quantification, and measurement. The software development process has been thoroughly discussed giving birth to various development methodologies. It is also the case for DESM. Quantification and measurement are fundamental for managerial activities within a given project. These include: • • •
Planning: To determine resource scheduling and budgeting; Controlling: To track project compliance with the plans; Improving: To allocate resources to increase productivity.
Techniques for quantification in software engineering are collectively called “software metrics,” and many techniques have been described. But for DESM, the situation is quite different. In discrete event simulation projects, according to Robinson and Pidd (2007), there are “three stereotypes of simulation practice” resulting in three kinds of simulation models:
978-1-4244-9864-2/10/$26.00 ©2010 IEEE
1774
Chwif, Banks and Barretto •
•
•
Type I: Models treated with the software engineering approach. This refers to simulation models built using formal approaches. Such models are developed by relatively large teams, rather than by an individual. Model specification is normally separated from model coding and documentation standards are rigidly enforced. Generally, military simulation models can be classified into this category. This kind of model is often built using conventional programming languages such as Ada or Java. Typical development time is measured in years. Type II: Models for organization change. This category includes models developed to address real world problems, often in management science or industrial engineering. Visual interactive modeling systems (VIMS), like simulation software, are frequently used. The majority of manufacturing models lie within this category. Generally they are developed by an individual. Typically, the development time is several weeks. Type III: Models for facilitation, also known as “quick and dirty simulation.” These models are constructed for problem understanding rather than for answering specific questions. The models could be built with the aid of VIMS. Due to the simplicity of these models, the development cycle lasts but a few days.
For Type I models, it is possible to directly apply software metrics as in conventional software engineering. For Types II and III models there are no formal methods available. This article develops a discrete-event simulation model metric to evaluate the time to implement a simulation model in a specific VIMS, Simul8. This simulation software was chosen because of the available implementation-time data, although the method can be applied to other VIMS. This article is organized as follows: Section 2 reviews some metrics for classical software development. Only those considered relevant to the present work are discussed. Section 3 shows how this can be extended to evaluate the development time of Types II or III models, creating a generic model metric for these types. Section 4 tests the model with a database of size 22 in order to find parameter estimates. Finally section 5 concludes this work. 2
REVIEW OF SOFTWARE METRICS
The scale is a fundamental problem when defining a metric. Scales are defined with a special purpose in mind and can be classified (Conte 1986) as: • • •
•
Nominal scales consisting of categories of similar objects. A scale can be defined in terms of groups. Examples are data-oriented programs, embedded software and system software; Ordinal scales providing a ranking of objects. A scale in this sense may classify projects into small, medium and large. Interval scales defining meaningful differences although ratios may not be necessarily significant. For instance, a student that scores 100 on a test is better than a student that scores 50, although not necessarily twice as good; Ratio scales are used when ratios are meaningful. For instance, a house with 200 m2 is twice as big as a 100 m2 house.
The current state of software metrics is not very satisfactory, despite the large number of proposed metrics. They lack one or both of two important attributes: A sound theoretical basis and statistically significant experimental validation. As a theoretical basis, Weyuker’s nine properties (Weyuker 1998) is perhaps the most important result. Simply stated his properties are: 1. There are at least two programs with different measures. This property may seem somewhat simple but it states that any candidate to be a metric must be non-trivial.
1775
Chwif, Banks and Barretto 2. 3. 4. 5. 6. 7. 8. 9.
There are a limited number of programs of the same size. There may be two distinct programs with the same size. There may be two distinct programs with the same functionality but with different sizes. Any metric must be monotonic, in the sense that adding functionality to a program will increase program size. Equally (or different) complex prologues affect the code that follows in differing ways. Changing the order of program statements affects program complexity. Changing variable names must not change program complexity. A combination of programs may be more complex than each part.
Although current techniques frequently fail in satisfying Weyuker’s nine properties, metrics are increasingly used in the software industry. Software metrics may be classified into: • •
Product metrics, which measure the software as a product at any stage of its development, measuring attributes such as size, complexity, reliability, and maintainability; Process metrics, which measure software development process attributes, such as overall development time, effort and productivity.
Most product metrics techniques focus on software size, as an attempt to see software as an asset, just as a building becomes a part of a company’s financial statement. Also, size measurement can be used to determine the overall effort to develop or maintain software within an average productivity level. Therefore, a general relation is Effort = Size*Productivity
(1)
Size may be physical, as in LOC (lines of code), discussed in (McGary 2002). It can also be functional, as in the FPA-Function Points Analysis (IFPUG 2004) or COSMIC (COSMIC 2007), among other methods known as Functional Size Measurement (FSM). Despite criticism largely reviewed in Jørgensen (2007), FPA is currently the ISO 24750 standard and is an industry best practice. Using equation (1) to estimate effort is also subject to many criticisms as long as productivity is not a constant for all teams within a company and varies with team experience in a certain field of knowledge or technology (Card 2006). As for process metrics, Putnam’s and Halstead’s models (Conte 1986) laid the basis for a more theoretical approach. However, probably the best known and documented model is COCOMO - Constructive Cost Model – (Boehm 1981), now COCOMO II (Boehm et al. 2000). COCOMO relates software size (in LOC) to project effort and overall duration, based on statistical analysis. It also demonstrates the scaling factor that affects large software projects. Effort and overall duration grow according to different ratios as project size increases. COCOMO also estimates effort and duration per project phase. 3
PROPOSED METRIC MODEL
There are some differences between VIMS and a general programming language. Generally VIMS have pre-built objects with properties that enable the construction of simulation models without the need to write lines of codes. The model is built by adding objects and configuring parameters. However, in many cases, some dynamic characteristics cannot be determined only by the object’s properties and some programming is required. In fact according to Banks and Gibson (1997): “…there is a point at which a graphical environment presents the user with more barriers than advantages. Creating and editing complex models with graphical tools often requires more time than creating and editing such models in a textbased environment. In fact, a no-programming graphical interface can lead the user into a trap. In an attempt to restrict the model building activity to what is supported by the GUI, the user may lose sight of 1776
Chwif, Banks and Barretto the detail and logic needed in the model while attempting to fit the model to the software capabilities.” To overcome this problem, VIMS generally offer some kind of programming language. Frequently, animation of the simulation model is also required to demonstrate model operation requiring some effort and time to change icons, import layouts, prepare the interface, etc. Hence, in the case of VIMS we claim that basically three factors affect the time and effort to implement a model: • • •
Simulation objects, i.e., the number and complexity of the parameters that need to be specified; Lines of code written; Graphics and animation level.
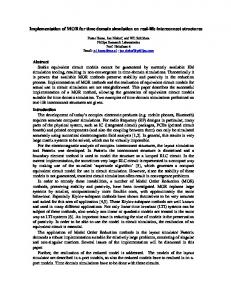
Each factor is demonstrated in what follows using Simul8 constructs. A similar procedure could be applied to any VIMS. Simul8 has basically five simulation objects: Work Entry Point, Storage Bin, Work Center, Work Exit Point and Resource. Each object has its own properties. For instance, a Work Center has work center time, work center efficiency (either in % or MTBF/MTTR parameters), work center resources, etc. The routing in and routing out properties are also configured on the object interface. Figure 1 shows some Work Center properties. In this case the model was built only by adding the objects and configuring the parameters (filling in the blanks).
Figure 1: Work Center Properties in Simul8 Software. Figure 2 shows a basic M/M/1 model. Note that in this case the model was built using Simul8 standard features only. But, as indicated previously, there are models where some programming is required. Simul8 uses a proprietary language called Visual Logic. Consider an example having three processing stations (this example is provided with the Simul8 software). The first station is owned by Fred who processes the work and sends it to one of the two remaining stations (the one owned by Jack and the other owned by Mary). Figure 3 shows the structure of this model. The model also requires that Fred send all goods to be processed to Jack, unless there are more than five items in Jack’s queue. This requirement cannot be fulfilled by Work Center properties, and some programming is required. This is done by creating a label called MYROUTE that will be used in the routing out properties and some logic. This logic and the routing out condition of Fred’s Work Center are depicted in Figure 4.
1777
Chwif, Banks and Barretto
Figure 2: M/M/1 Model
Figure 3: Structure of Fred’s, Jack’s and Mary’s Model Another factor that affects the model development time is the graphical/animation complexity. Roughly, graphical complexity can be classified into three levels. These three levels are considered for 2D modeling. For 3-D modeling the number of levels can be increased.
1778
Chwif, Banks and Barretto • •
•
Basic level (1), when standard graphics provided by the software are enough. There is no change of the basic icons. Medium level (2), when using customized icons (either built or from the Icon Library) and changing the background by adding layouts and writing messages to the screen and legends. There could be also the addition of dynamic tables and special purpose graphs. Complex level (3), when animation is obtained by using nonstandard graphic objects to mimic the behavior. An instance is given by a bridge crane (generally an additional piece of logic is necessary to handle the animation).
Figure 4: Visual Logic and Configuration of Routing Out at Jack’s Station Figure 5 shows an example of each category. Figure 5(a) shows a model with standard icons. Figure 5(b) shows objects with customized images (drawn or imported by the library), and Figure 5(c) shows a model with a bridge and crane animation. In order to develop the metric model, some assumptions were made: •
•
The metric model will estimate the development time at the implementation phase. Therefore, it will not consider either the time to develop the conceptual model, or the time for analysis. However the time for model verification is included. The model should be developed by one experienced modeler in the VIMS chosen (in this article, Simul8). Nevertheless a similar approach could be used in other VIMS.
The development time will be a function of the number of objects, the number of lines of codes and the graphics complexity. For the sake of simplification the time to construct each object will be considered the same despite the level of the information detail of the model (this is a point to be refined in future work). This may be considered a simplistic or a “reductionist” approach, since several other variables (like skill, modeler abilities, nature of the problem, etc.) may have an impact on the implementation time, and in this model they are not considered. However, we are adopting in this work an “evolutionary strategy” and since this is one of the first attempts in the literature to estimate discrete-event simulation model implementation time, it is clear that this procedure can be and will be improved over time. In this article, we approach the development time by using a non-linear equation (equation 2). Looking at Equation 2, we can see that second and the third terms are linear, so the development time is pro-
1779
Chwif, Banks and Barretto portional to the number of simulation objects and the number of lines of code. The first term is non-linear. The reason is that the time to develop a model at a given level of graphical complexity is related to the number of objects. As the number of objects in a model increases, more time is required to develop the graphical aspects. Some graphics are not directly related to the objects (e.g. “on screen charts”), but that does not require a major part of the software development time.
T = k ×O×G + k O + k × L 1 2 3 where T is the effort in hours
(2)
O is the number of simulation objects L is the number of lines of codes G is the model´s graphics complexity level (1,2 or 3)
By analogy to COCOMO, from now on this model will be called COTIM-DES (Constructive Time Model for Discrete Event Simulation).
(a)
(b)
(c) Figure 5: Example of Models with Different Graphical Complexity; (a) Basic, (b) Medium, (c) Complex. 4 REGRESSION ANALYSIS A non-linear regression analysis was performed on the data set formed by the first 10 projects, depicted in Table 1 (Data Set 1). Then, after obtaining the correlation model, it was tested against two additional sets of data. Data Set 2 came from Projects 11 to 15 that are from models developed by the same modeler that conducted the projects making up Data Set 1. Data Set 3 was based on Projects 16 to 22 completed by others modelers. The regression using Data Set 1 only resulted in estimating Equation 3 as follows: 1780
Chwif, Banks and Barretto
T ( hours ) = 0.041 × O × G + 0.107 × O + 0.053 × L
(3)
The model provided a correlation coefficient of 97%. Then, the model was tested with data from Data Sets 2 and 3, generating the results shown in Tables 2a and 2b. Table 1: Values of O, L and G and Development Time for Each Project Project 1 2 3 4 5 6 7 8 9 10 11 12 13 14 15 16 17 18 19 20 21 22
O 30 27 44 92 61 67 395 176 53 100 70 92 198 73 77 106 56 1451 550 90 250 900
L 27 67 88 327 386 427 451 909 401 500 580 181 258 33 905 3750 3000 11000 10800 2600 4945 4750
G 1 2 1 2 3 2 3 3 1 1 2 2 1 2 2 3 3 2 3 2 3 2
Real Develop. Time (hrs) 5 9 17 49 50 27 113 86 21 40 36 25 35 15 50 213 128 1020 456 252 441 258
As can be seen from Tables 2a and 2b, in some cases the relative error became higher that 50% (for Projects 19 and 22). By looking at the root causes of these errors, it is seen that the errors occur when the models are large (expressed in terms of the number of objects). By ordering all the data in terms of the number of objects (X axis), and plotting the real and estimated data depicted in Figure 6 (where the Yaxis is hours), we see that for model size higher than 200 objects the regression loses its predictive power. Table 2a: Using Dataset 2 Table 2b: Using Dataset 3 Proj 11 12 13 14 15
Real Model T (hrs) T (hrs) 36 44 25 27 35 43 15 16 50 63
Error 8.1 2.0 8.0 0.6 12.6 Avg Error Max Error Min Error
Error % 18% 8% 19% 4% 20% 14% 20% 4%
Proj 16 17 18 19 20 21 22
1781
Real T(hrs) 213 128 1020 456 252 441 258
Model T(hrs) 224 172 859 700 155 320 423
Error 11.0 44.7 -161.1 244.2 -96.9 -120.8 164.7 Avg Error Max Error Min Error
Error % 5% 35% -16% 54% -38% -27% 64% 11% 64% -38%
Chwif, Banks and Barretto If we eliminate the models with 200 and more objects we obtain an average, maximum and minimum error of 6%, 39% and –34%, respectively, decreasing the standard deviation of the previous case (using Data Sets 1, 2, and 3). This pattern (non-linearity of simulation development time as the size of model increases) was discussed by Minamihara and Miyake (2004). Figure 7, taken from their work, depicts this situation (the X-axis is model complexity and the Y-axis is analyst-hours to develop a model), with some real data points. The author’s interpretation is that as the model becomes more complex and grows in size, the time to locate and edit objects, and the validation time grows extensively in a nonlinear fashion. Another point to consider is whether the time to develop a model is sensitive to the modeler. Recall that Datasets 2 and 3 are from different modelers, so one interesting issue is to evaluate this relationship. Since we dropped the cases that have more than 200 simulation objects, the remaining data do not provide a sufficient sample size to show if this correlation exists or not. Nevertheless, taking the outliers from Data Set 3, we find that the average, maximum and minimum error are respectively 1%, 35% and –38%, showing that the averages and standard deviation look like the results from Data Set 2. As we continue our investigation into this area, we will search for more cases to confirm that the modeler does or does not make a difference. 1200
1000 real estimated
800
600
400
200
456
441
258
252
212,5
127,5
86
113
50
50
49
40
36
35
27
25
21
17
9
15
5
real
0
Figure 6: Comparison (real and estimated) using Data Sets 1, 2, and 3 Man Hour
Model Complexity – Number of Objects
Figure 7: Time requested to develop a model versus model complexity (adapted from Minamihara and Miyake 2004). According to the correlation matrix in Table 3, the number of objects is the dominant factor that affects the time estimate. Table 3 indicates, however, that the number of lines of code and graphical complexity are also important. One can argue that the values for Levels 1, 2 and 3 are not indicative of the real differences between the graphical complexities. Thus, Level 2 might not be twice as complex as a Level 1, and so on. Other values such as 1, 3 and 9 were tried, but the regression analysis showed no further improvement. It seems that what is important is to have a difference, not exactly its values, because the regression will take into account the input-output relations. For the precision obtained and the number
1782
Chwif, Banks and Barretto of samples considered, we claim that the scale 1, 2 and 3 is sufficient for this analysis (we would not have more precision if we look for more complex methodologies of graphical evaluation). For further understanding, a larger sample is needed. Nevertheless, the study of a better evaluation of graphical complexity is still under investigation. Table 3: Correlation Matrix O L G T
O 1.000 0.476 0.583 0.918
L 0.476 1.000 0.531 0.705
G 0.583 0.531 1.000 0.759
T 0.918 0.705 0.759 1.000
5 CONCLUSIONS AND FUTURE WORK In this paper, we proposed a metric to evaluate the time to implement a simulation model. This metric can be applied for models categorized as Types II and III, since there are no formal methods to estimate the development time. We took a sample of 22 real life projects and the regression model showed a correlation coefficient of 97% for Data Set 1. However, it is clear to the authors that the proposed metric must be refined, mainly to investigate the nature of the factors that drive the development of simulation models, in order to make more precise estimates when only a small amount of real data is available early in the development cycle. Nevertheless, paraphrasing the great statistician George E.P. Box, “All models are wrong, but some are useful.” It is better to have a model than to have nothing at all. As more data is generated the model will be updated and hopefully greater accuracy will be achieved. Another point of refinement is to consider the non-linearity of larger models. Table 5 summarizes a comparison of software metric techniques discussed in this paper, which indicates some directions for further improvements. However, since we are focusing our work on Types II and III models in which one person is usually the model builder, the main point is to obtain the time to implement a model. Therefore the goal of COTIM-DES is to measure time, but not effort, as indicated in Table 5. The proposed metric has been evaluated for only one VIMS (Simul8). As stated in Table 5 (Team), another limitation of COTIM-DES is that it only accounts for one level of model building proficiency. So it has to be tested to see how different levels of proficiency will impact the outcome. Therefore, more research should be done in this respect. Regarding the criteria whether the method correctly captures algorithmic complexity is not clear if the algorithmic complexity of simulation, represented by the number of lines of code (parameter L) is correctly captured. There could be a highly complex algorithm with few lines of code. A complex scheduling algorithm, for example, is harder to implement than simply using a FIFO policy. So in the future we can think of a robust measure that involves other considerations of the code like the presence of loops, “ifs,” recursions, etc. Again, more research should be done in this regard. In the future, we are planning to link the COTIM-DES method to a technique for specifying a conceptual model. The idea is to evaluate the effort of the implementation using COTIM-DES by means of a conceptual simulation model (According to Robinson (2004), a conceptual simulation model is “a nonsoftware specific description of the simulation model that is to be developed describing the objectives, inputs, outputs, assumptions and simplifications of the model”). In this case we will propose a methodology to derive the parameters O, L and G directly from the conceptual simulation model.
1783
Chwif, Banks and Barretto Table 5: A Brief Comparison between Metrics. COTIM-DES COCOMO FSM (FPA,COSMIC, NESMA) Goal Horizon estima- Effort and horizon es- Size, convertible to eftion (only one retimation fort and source) horizon through productivity Technology dependency Tested with only Technology indepen- Technology indepenone VIMS dent dent Two models, one durNESMA applicable Applicability Rough estimate ing proposal, another during during proposal, after design proposal, others after refined estimation detailed requirements after detailed requirements Size limitation No No In FPA and NESMA, maximum size is limited, given a desired functionality but not in COSMIC Indirectly taken into Team Only one modeler Can take into account account through prodteam cohesion and (fixed productiviuctivity training ty) Algorithmic complexity Captured someCaptured in terms of No, in general; adwhat in terms of LOCS justed FPA supposes a LOCS fixed complexity
AKNOWLEDGMENTS The authors would like to thank Kenneth Doole at Simul8 and Chris Milligan at Visual8 for providing Data Set 3 for this study. REFERENCES Banks, J. and R. Gibson. 1997. Simulation modeling: Some programming required. IIE Solutions, February. Boehm, B. 1981. Software Engineering Economics, Prentice Hall. Boehm, B. et al. 2000. Software Cost Estimation with COCOMO II. Prentice Hall. Card, D. 2006. The challenge of productivity measurement. In Software Quality Conference, Available via < http://www.compaid.com/caiinternet/ezine/card-prod.pdf> [accessed March 2, 2010]. Chemiavsky, J. C. and C. H. Smith. 1991. On Weyuker´s Axioms for Software Complexity Measures. IEEE Transactions on Software Engineering, Vol. 17 No. 6, June. Conte, S. D., H. E Dunsmore, and V.Y Shen. 1986. Software Engineering Metrics and Models. Benjamin/Cumming. COSMIC. 2007. COSMIC Functional Size Measurement Method. COSMIC. IFPUG. 2004. Function Point Counting Practices Manual. IFPUG. Jørgensen, M and M. A. Shepperd, 2007. Systematic Review of Software Development Cost Estimation Studies. IEEE Transactions on Software Engineering, 33:1:33-53.
1784
Chwif, Banks and Barretto McGarry, J., C. David, C. Jones, B. Layman, E. Clark, J. Dean and F. Hall. 2002. Practical Software Measurement. Addison-Wesley. Minamihara, A. I and D. I. Miyake. 2004. “Modelagem e Análise de Sistemas de Operações em Serviços Utilizando Simulação de Eventos Discretos”, Unpublished Article - PIC-EPUSP Nº2/2004, Escola Politécnica da Universidade de São Paulo, Departamento de Engenharia de Produção. Robinson, S. 2004. Simulation: The Practice of Model Development and Use, John Wiley & Sons, Ltd. Robinson, S. and M. Pidd. 2007 Organizing Insights into Simulation Practice. In Proceedings of the 2007 Winter Simulation Conference, ed. S. G. Henderson, B. Biller, M.-H. Hsieh, J. Shortle, J. D. Tew, and R. R. Barton, 771-775. Piscataway, New Jersey: Institute of Electrical and Electronics Engineers, Inc. Roetzheim, W. H. and A. B Reyna. 1998. Software Project Cost & Schedule Estimating. Prentice Hall. Weyuker, E. J. 1998. Evaluating Software Complexity Measures. IEEE Trans. on Software Engineering. 14:1357-1365. AUTHOR BIOGRAPHIES LEONARDO CHWIF was graduated in Mechanical Engineering (Megatronics Specialization) in 1992 at the University of São Paulo and received his M.Sc. degree in 1994 and his Ph.D. in Simulation in 1999 from the same University. Upon graduation Dr. Chwif joined the Brazilian branch of Mercedes-Benz (truck division). Then, he joined the Brazilian branch of Whirlpool Corporation. He spent one year at Brunel University as a research visitor at the Centre for Applied Simulation Modeling. Currently he is CEO. of Simulate Simulation Technology. Dr. Chwif also teaches introductory (graduate and postgraduate) simulation courses at Mauá School of Engineering and a simulation course at the MBA program at the University of São Paulo. His e-mail address is . JERRY BANKS holds the title Academic Leader at Tecnológico de Monterrey in Monterrey, Nuevo León, México. Previously, he retired from the faculty of the School of Industrial and Systems Engineering at Georgia Tech in Atlanta, Georgia, USA, and then he was Senior Simulation Technology Advisor at Brooks Automation (now part of Applied Materials, Inc.). His e-mail address is . MARCOS RIBEIRO PEREIRA BARRETTO graduated in Electronic Engineering in 1983. He received his M.Sc. degree in 1988 and his Ph.D. in 1993, both from the University of São Paulo. He is a professor and researcher in the Megatronics Department at the University of Säo Paulo. His email address is .
1785