Evaluating Microgrid Management and Control with an Implementable Energy Management System Wenbo Shi, Eun-Kyu Lee, Daoyuan Yao, Rui Huang, Chi-Cheng Chu, and Rajit Gadh Smart Grid Energy Research Center University of California, Los Angeles, USA Emails:
[email protected],
[email protected], {davidyao, rhhuang, peterchu, gadh}@ucla.edu
Abstract—A microgrid can be characterized by its integration of distributed energy resources and controllable loads. Such integration brings unique challenges to the microgrid management and control which can be significantly different from conventional power systems. Therefore, a conventional energy management system (EMS) needs to be re-designed with consideration of the unique characteristics of microgrids. To this end, we propose a microgrid EMS named a microgrid platform (MP). We take into account all the functional requirements of a microgrid EMS (i.e., forecast, optimization, data analysis, and human-machine interface) and address the engineering challenges (i.e., flexibility, extensibility, and interoperability) in the design and development of the MP. Moreover, we deploy the prototype system and conduct experiments to evaluate the microgrid management and control in real-world settings at the UCLA Smart Grid Energy Research Center. Our experimental results demonstrate that the MP is able to manage various devices in the testbed, interact with the external systems, and perform optimal energy scheduling and demand response.
I. I NTRODUCTION A microgrid is a low-voltage distribution network consisting of a variety of energy components including distributed energy resources (DERs) and controllable loads1 [1]. With these components, a microgrid can either be connected to the grid (i.e., grid-connected mode) or use the DERs to supply the loads without the grid (i.e., islanded mode). Integrating DERs and controllable loads within the distribution network introduces unique challenges to the microgrid management and control which are implemented by an energy management system (EMS). A microgrid EMS can be significantly different from the EMS used in conventional power systems due to these challenges. To understand the challenges, Su and Wang [2] discussed the role of EMS in microgrid operations and listed four essential functionalities that a microgrid EMS must support: forecast, optimization, data analysis, and human-machine interface (HMI). Due to the importance of EMS in power systems, many EMS frameworks [3]–[6] have been investigated in the literature. While these previous studies focused on different This work was supported in part by the Research and Development Program of the Korea Institute of Energy Research (KIER) under Grant B4-2411-01. 1 Examples of DERs include photovoltaics (PVs), wind turbines (WTs), fuel cells, combined heat and power (CHP), and energy storage systems. Examples of controllable loads include heating, ventilation, and air conditioning (HVAC) systems and electric vehicles (EVs).
issues in EMS, they commonly suffer from engineering challenges that must be taken into account when designing an implementable microgrid EMS. First of all, intermittency and variability of DERs (e.g., PVs and WTs) and spatiotemporal uncertainty in controllable loads complicate the microgrid management, which the EMS must be able to cope with. Next, a microgrid triggers a number of new applications (e.g., demand response (DR), coordinated EV charging, vehicle-to-grid (V2G), etc.) and innovative control algorithms [7], [8]. The EMS must be able to interface with them seamlessly. Last but not least, a microgrid instruments a number of energy components. But, most of them still use proprietary protocols and cannot interoperate with each other [3]. The EMS must handle the heterogeneity and achieve interoperation. A microgrid EMS can be implemented to perform efficient management and control only when overcoming the engineering challenges and satisfying aforementioned functional requirements. Unfortunately, few previous works have accomplished both of them. To solve the problems, this paper proposes a microgrid EMS named a microgrid platform (MP). Moreover, we deploy the prototype system and conduct experiments in real-world settings at the UCLA Smart Grid Energy Research Center (SMERC)2 . The contributions of this paper are three fold: (1) We design a microgrid EMS with consideration of both the functional requirements and the engineering challenges. It achieves flexibility for the dynamics and uncertainty, extensibility for the variety of emerging applications, and interoperability for the heterogeneity. (2) We implement a microgrid EMS prototype named a MP. The MP is flexible and extensible in the sense that it supports plug-and-play of DER devices, loads, and functionalities by adopting a resource-oriented architecture (ROA) [9] that abstracts energy components as resources. The interoperability is realized via energy service interfaces (ESIs) [10]. (3) We deploy the prototype system in our testbed and conduct experiments to evaluate the microgrid management and control. The MP receives the market information and automated demand response (ADR) signals from the utility as well as communicates with various types of DERs and loads. Our experimental results demonstrate that the MP is able to perform optimal energy scheduling and DR. 2 http://smartgrid.ucla.edu/
To appear in IEEE SmartGridComm, Venice, Italy, 3-6 Nov. 2014
Customer side
Customer side MP
Grid side
Grid side
HMI
Interface
Market information
CHP
DER/load
Market
Data analysis
Diesel
Weather forecast
Battery
Historical data
Forecast data
Optimization Energy scheduling
Demand response
ESI
Data analysis
3rd party service provider
Optimization
Interface
Forecast
Forecast
ADR
WT
ESI
Utility Weather forcast
Smart submeters
PV
Microgrid EMS
EV
HMI Data visulization
Smart appliances
Real-time control
PV Battery
EV ... ...
.....
Fig. 2. An illustration of the MP architecture. Fig. 1. An illustration of a microgrid EMS.
The rest of the paper is organized as follows. We review the functionalities of a microgrid EMS and address the design issues in Section II. The MP is implemented and illustrated in Section III. We install the MP prototype at the UCLA SMERC and conduct experiments on optimal energy scheduling and DR in Section IV. Conclusions are given in Section V.
to adjust the forecast and the optimization models for better performances. It is also useful for the microgrid operator to design control policies for new applications. D. HMI The EMS provides a HMI for real-time monitor and control of the microgrid. The HMI is also the interface for the microgrid operator to interact with other modules in the EMS. Useful information rather than raw data should be provided [13] by means of data visualization, archiving, etc. It should also allow more customer interactions [2].
II. M ICROGRID M ANAGEMENT This section discusses the design issues of an EMS for emerging microgrids - both functional requirements and engineering challenges. A microgrid EMS monitors and controls the DERs and the loads for the optimal operation. It interacts with various DERs and loads as well as external systems for utility information and weather forecast. Fig. 1 shows the role of a microgrid EMS. We refer to [2] for details.
E. Communications A microgrid is a distributed system consisting of heterogeneous types of energy components using proprietary protocols [3]. The EMS must be able to interact with them in an interoperable manner. It is also responsible for interoperating with external systems outside the microgrid - the EMS translates the information delivered from the external systems to internal semantics and protocols. The communication interface in the microgrid EMS must be extensible, indicating that it can be easily extended to support emerging functionalities. New applications such as coordinated EV charging and innovative algorithms such as various forecasts and optimizations have been introduced to cope with the challenges brought by the introduction of DERs and controllable loads. Thus, it is critical that the EMS is able to adopt such new applications and algorithms without affecting the existing functionalities.
A. Forecast The EMS uses the historical data and other inputs (e.g., weather) to forecast the DERs, the loads, and the market. The forecast is preformed on different time scales (e.g., day-ahead, hour-ahead, etc.). The forecast data is used as the input for the optimization. Therefore, the accuracy of the forecast is crucial for the EMS to balance supply and demand in the microgrid. Forecast is challenging in a microgrid setting due to the inherent intermittency and variability of DERs (e.g., PVs and WTs) and the spatial and temporal uncertainty in controllable loads (e.g., EVs). Various forecast methods [11], [12] have been proposed in the literature. B. Optimization
III. I MPLEMENTATION
Optimization is the brain of the EMS. It optimizes the power flows in the microgrid by adjusting the dispatchable DERs, the controllable loads, and the power imported/exported from/to the grid. Different optimizations are performed for different applications (e.g., energy/power management, DR, coordinated EV charging, V2G, etc.). Those applications are typically formulated as non-linear optimization problems with different objectives. Extensive algorithms have been proposed for energy/power management, DR, coordinated EV charging, and V2G in microgrids [7], [8].
In this section, we introduce the implementation of a microgrid EMS with consideration of the design issues discussed in the previous section. We describe the system architecture, the microgrid testbed, and the microgrid control. A. System Architecture In this paper, we propose a microgrid EMS, named a MP, taking into account the requirements discussed in the previous section. We implement it in a ROA style [9] that abstracts energy components in a microgrid in the form of resources. Resources have well-defined interfaces, which enables the MP to support plug-and-play of DERs, loads, and functionalities. The ROA provides advantages over a serviceoriented architecture (SOA) in previous works [3]–[6]: (i) best fit for “linking and referring” to energy resources, thus
C. Data Analysis The historical and forecast data of the DERs, the loads, and the market are used for analysis in the EMS. The data analysis can provide insights to better understand the characteristics of the DERs, the loads, and the market, which can then be utilized 2
To appear in IEEE SmartGridComm, Venice, Italy, 3-6 Nov. 2014
Power strip Battery
Dimmable LED
EV charging station
PV
Fig. 3. Some of the devices in the testbed.
maximizing the interactivity efficiency in the EMS and (ii) more lightweight without complicated interface description. More technically, the MP fulfills the interoperability via ESIs [10] to interact with DERs, loads, and external systems. In the ESI, energy data is represented in open building information exchange (oBIX)3 or IEC 618504 . It is then exchanged using the web service model in the representational state transfer (REST) style [9]. The resource centric security (RCSec) [14] is carried out on action levels (i.e., read, write, and invoke). An illustration of the overall MP architecture is shown in Fig 2.
Fig. 4. The MP web interface showing the market information.
J1772 connectors6 . The charging stations are connected with a control center which monitors and controls the EV charging using 3G technologies. The MP communicate with the EVs via the control center. Due to the low penetration of EVs, we simulate two EV charging stations (level 1 and level 2) based on the real data in the MP for experiments. The MP is also connected to a PV panel and a battery energy storage system (BESS) in our lab. We are currently installing a 50kW PV system on the roof and a 25kWh BESS in the lab. This version of the testbed implements the PV and the BESS using the simulated data that following the specifications of the real devices. The simulated PV and BESS communicate with the MP using the IEC 61850 standard. The details of the simulators can be found in our previous paper [15]. The MP provides two data interfaces for the DERs and the loads in the microgrid. They are (i) historical energy data (e.g., active/reactive power, voltage, current, frequency, etc.) for a given period of time; and (ii) forecast data which are the outputs of the corresponding forecast methods. The historical data and the forecast data can be further analyzed using data visualization in the web interface. 2) Grid Side: Several services on the grid side are implemented and utilized in our testbed including ADR, market information (i.e., day-ahead pricing, hour-ahead pricing, and real-time pricing), and weather forecast. We implement and deploy an OpenADR server (DRAS) that provides the ADR service to the MP. The market information and weather forecast are provided by a server which fetches the data from the California Independent System Operator (CAISO)7 . The server obtains three types of retail market prices from CAISO: day-ahead pricing which gives the dayahead price of every hour, hour-ahead pricing which gives the hour-ahead price of every 15 minutes, and real-time pricing which gives the 10-minute-ahead price of every 5 minutes. The server also gets the weather forecast from CAISO. 3) Web Interface: The MP provides a web interface as shown in Fig. 4 for real-time monitor and control of the microgrid as well as for the user to interact with the MP. The real-time monitor and control are realized via the real-time data and control services provided by the MP to read real-
B. Microgrid Testbed There are a number of DERs and loads connected to the MP on the customer side. Several grid services are also implemented in the testbed for experiments. 1) Customer Side: The DERs and loads connected to the MP testbed at the UCLA SMERC include smart submeters, smart appliances, EVs, PVs, and batteries as shown in Fig. 3. Smart submeters provide fine-grained measurement and control of energy usage. We use two types of smart submeters: smart plugs and smart power strips in the testbed to monitor and control (i.e., on/off) the plug loads in the lab including computers, laptops, desk lamps, and network switches. The submeters communicate with the MP using ZigBee. We also deploy smart appliances which provide interfaces to control the operations including LED lights, a cloth dryer and a refrigerator. We have dimmable LED lights which can change brightness and color. The LEDs use ZigBee to communicate with the MP. For the scalability test, we additionally simulate 200 LEDs which operate exactly the same as the real device (brightness, temperature, and power consumption). The MP connects with the dryer and the refrigerator using Ethernet. The dryer provides interfaces to change the operation mode (high heat, low heat, or no heat) and turn on/off. The refrigerator can adjust the operating cycles of the compressor, the defrost, and the fan. Both the dryer and the refrigerator have submeters to measure the power consumption. The UCLA SMERC is developing a smart EV charging infrastructure5 on campus which supports charging rate control and serving multiple EVs by power multiplexing using 3 http://www.obix.org/ 4 http://www.iec.ch/smartgrid/standards/
6 http://standards.sae.org/j1772
5 http://smartgrid.ucla.edu/projects
7 http://oasis.caiso.com/mrioasis/
evgrid.html
3
201001/
To appear in IEEE SmartGridComm, Venice, Italy, 3-6 Nov. 2014 and Ebe is the minimum energy that the battery should maintain at the end of the scheduling horizon. We model the cost of operating a given battery b as [16]:
time measurements and send control commands to the DERs and the loads. The web interface provides different forms of data visualization (i.e., tables and interactive graphs) to show the data including the real-time/forecast/historical data of the DERs, the loads, and the market.
Cb (pb ) , αb
+ γb
The MP implements two algorithms for the optimal operation of the microgrid: an energy scheduling algorithm and a DR algorithm. The MP provides forecast services of the DERs and loads for optimization. Specifically, it uses a persistence model for load forecasting, an auto regressive moving average (ARMA) model for PV forecasting [11], and a machine learning model for EV forecasting [12]. The market forecast services are implemented using the forecast data from the CAISO. Now we present the system model of the microgrid and formulate the energy scheduling and DR as optimization problems. Let us consider a microgrid consisting of a set of distributed generation (DG) units denoted by G := {g1 , g2 , . . . , gG }, distributed storage (DS) units denoted by B := {b1 , b2 , . . . , bB } and controllable loads denoted by L := {l1 , l2 , . . . , lL }. We use a discrete time model with a finite horizon in this paper. We consider a time period or namely a scheduling horizon which is divided into T equal intervals ∆t, denoted by T := {0, 1, . . . , T − 1}, where t0 is the start time. DG Model: For each DG unit g ∈ G, we assume that there is an upper bound and a lower bound on its power: max pmin (t), ∀t ∈ T , g (t) ≤ pg (t) ≤ pg
pmax b
pb (t + 1)pb (t) (6)
t=0 2
(min(Eb (t) − δb Ebmax , 0)) + cb ,
where pb is the charging/discharging vector pb , (pb (t), t ∈ T ) , αb , βb , γb , δb , and cb are positive constants. The above function is convex when αb > βb . This cost function captures the damages to the battery by the charging and discharging operations. The three terms in the function penalize the fast charging, the charging/discharging cycles, and the deep discharging, respectively. We choose δb = 0.2. Load Model: For each load, the demand is constrained by a minimum and a maximum power denoted by pmin (t) and l pmax (t), respectively: l pmin (t) ≤ pl (t) ≤ pmax (t), ∀t ∈ T . l l
(7)
For deferrable loads such as EVs, the cumulative energy consumption of the loads must exceed a certain threshold in order to finish their tasks before deadlines [16]. Let Elmin and Elmax denote the minimum and maximum total energy that the load is required to consume, respectively. The constraint on the total energy consumed by a deferrable load is given by: X Elmin ≤ pl (t)∆t ≤ Elmax . (8) t∈T
(1)
pmin ≤ pb (t) ≤ pmax , ∀t ∈ T , b b
(2)
Eb (t + 1) = Eb (t) + pb (t)∆t, ∀t ∈ T ,
(3)
∈T,
X
T −2 X
t∈T
We use a utility model to capture customer preference in the scheduling. The utility function Ul (pl ) quantifies a customer’s benefit or comfort obtained by the load l ∈ L using the demand vector pl , (pl (t), t ∈ T ). We assume the utility function is a concave function. Supply-demand Matching: The net demand of the microgrid is equal to the total demand minus the total generation: X X X P (t) = pl (t) + pb (t) − pg (t), ∀t ∈ T . (9)
max where pmin (t) are the minimum and maximum g (t) and pg output power, respectively. If the DG unit is dispatchable (e.g., diesel), the output power pg (t) is a variable. If the DG unit is non-dispatchable (e.g., PVs and WTs), the output power pg (t) cannot vary and its value is equal to the forecasted value (i.e., max pmin (t) = pfg (t) where pfg (t) is the forecasted g (t) = pg power at time t). We denote the generation cost of a DG unit g ∈ G by Cg (pg (t)). We assume that the cost function is strictly convex. For renewable DG units such as PVs and WTs, the generation cost is zero. DS Model: We consider batteries as the DS units in the microgrid. Given a battery b ∈ B, we assume its output power pb (t) is positive when charging and negative when discharging. Let Eb (t) denote the energy stored in the battery at time t. The battery can be modeled by the following constraints:
≤ Eb (t) ≤ Ebmax , ∀t Eb (t0 + T ) ≥ Ebe ,
pb (t)2 − βb
t∈T
C. Microgrid Control
Ebmin
X
l∈L
b∈B
g∈G
If the microgrid is operated in islanded mode, then P (t) = 0. If the microgrid is operated in grid-connected mode, then P (t) is the power traded between the microgrid and the main grid. We model the cost of energy purchase from the main grid as C0 (t, P (t)) , ρ(t)P (t)∆t, where ρ(t) is the market energy price. Note that P (t) can be negative meaning that the microgrid can sell its surplus power to the main grid. 1) Energy Scheduling: The objective of the energy scheduling is to schedule the day-ahead operation of the DERs and the loads such that (i) the total load utilities are maximized, (ii) the total costs of generation and energy purchase are minimized, and (iii) the DER constraints, the load constraints, and the supply-demand matching constraint are satisfied. The scheduling horizon T in this problem is one day. We define pg , (pg (t), t ∈ TP ), pb , (pb (t), t ∈ T ), pl , (pl (t), t ∈ T ), and Cg (pg ) , t∈T Cg (pg (t)). The energy
(4) (5)
−pmin b
where is the maximum charging rate, is the maximum discharging rate, Ebmin and Ebmax are the minimum and maximum allowed energy stored in the battery, respectively, 4
To appear in IEEE SmartGridComm, Venice, Italy, 3-6 Nov. 2014
Forecast
16
9
14
8
PV Plugloads LED EV1 EV2
7
12
6 Power (kW)
Price
10 8 6
5 4 3
4
2
2
1 0
0 0
1
2
3
4
5
6
7
8
9
0
1
2
3
4
5
6
7
8
9
10 11 12 13 14 15 16 17 18 19 20 21 22 23 24 Time
10
11
12 13 Time
14
15
16
17
18
19
20
21
22
23
24
Day−ahead schedule 9
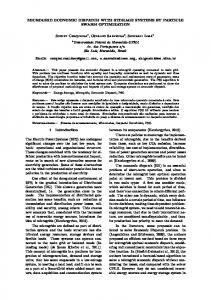
Fig. 5. The day-ahead energy price.
PV Battery Plugloads LED EV2 EV1
8 7 6
scheduling in the microgrid can be formulated as a convex optimization problem [17]: X X X max ξl Ul (pl ) − ξg Cg (pg ) − ξb Cb (pb ) pg ,pb ,pl
g∈G
l∈L
−ξ0
X
Power (kW)
5
b∈B
1
−2 −3
C0 (t, P (t))
−4
1
2
3
4
5
6
7
8
9
10
11
12 13 Time
14
15
16
17
18
19
20
21
22
23
24
A. Energy Scheduling We consider the day-ahead scheduling of the PV panel, the battery, the plugloads (including the refrigerator), the dimmable LEDs, and the EVs in the testbed. The PV is a 5kW simulator using the model in [15] and data from the solar resources and meteorological assessment project (SOLARMAP)8 . The maximum energy allowed to be stored in the battery Ebmax is 20kWh and we set Ebmin = 5kWh. The maximum battery charging/discharging rate is 3kW. We set Eb (t0 ) = Ebe = 5kWh. The parameters in the battery cost function are chosen to be P αb = 1, βb = 0.75, and γb = 0.5. f 2 We choose Ul (pl (t)) , t∈T −ηl (pl (t) − p l (t)) for the P plugloads and the LEDs and Ul (pl (t)) , ηl ( t∈T pl (t)∆t) for the EVs, where pfl (t) is the forecasted load and ηl is the priority of the load given by the customer. The higher the priority is, the more important the load is to the customer. The maximum charging rate is 1.4kW for level 1 EV charging and 2.9kW for level 2 EV charging. In our experiment, we assume that the plugloads cannot be shedded, the LEDs can be shedded, and the EVs can be shifted. Perfect forecasting of the DERs and loads is assumed. We use the day-ahead market price from the CAISO in the experiment. The parameters are chosen as ξl = 1, ξg = 1, ξb = 0.01, and ξ0 = 1. We conduct the energy scheduling experiment for March 27th, 2014. Fig. 5 shows the day-ahead price. Fig. 6 shows the comparison of the forecasts and the day-ahead schedules. From the figures, we can see the battery charging/discharging cycles: the battery is charged when the energy price is low and discharged when the price is high. We can also observe load shedding and load shifting from the results: the LEDs are shedded and the EVs are shifted to the time periods when the price is low. The total operational costs of the testbed using the schedules are 367.62¢ compared with 564.07¢ without scheduling, saving the costs by 564.07−367.62 = 34.83%. 564.07
(10)
Similar to the day-ahead scheduling problem, the DR problem can be formulated as a convex optimization problem: X X X max ξl Ul (pl ) − ξg Cg (pg ) − ξb Cb (pb ) g∈G
l∈L
0
Fig. 6. The forecast and day-ahead schedule.
(1) − (9),
P (t) ≤ Pmax (t), ∀t ∈ T .
s.t.
2
0
where ξl , ξg , ξb , and ξ0 are the parameters to trade off among the utility maximization and the cost minimizations. Solving the problem gives the optimal schedules including the generation schedules pg , the battery schedules pb , and the load schedules pl . 2) DR: The microgrid EMS can receive DR events issued by the utility and it must be able to coordinate the operation of the devices in the microgrid in order to respond properly. A DR event can be characterized by a time schedule T which specifies the start time and the end time and a demand limit Pmax (t) which can be determined from the event information. The DR constraint on the net demand of the microgrid is given by:
pg ,pb ,pl
3
−1
t∈T
s.t.
4
b∈B
(1) − (10).
In the above problems, the control variables are assumed to be all continuous. However, some of them may be discrete in reality (e.g., on/off). A two-stage approach [18] can be used to solve this issue. In the first stage, a solution is obtained assuming that all the control variables are continuous. Then, the discrete variables are rounded to the nearest discrete levels and treated as constants in the second-stage solution. IV. E XPERIMENTS To test the effectiveness of the MP, we conduct various experiments to evaluate the microgrid management and control in the testbed. We present the results of the optimal energy scheduling and DR in this section. Refer to [10] for our previous results.
8 http://www.nrel.gov/midc
5
To appear in IEEE SmartGridComm, Venice, Italy, 3-6 Nov. 2014 V. C ONCLUSIONS In this paper, we propose a microgrid EMS named a MP, taking into account both the functional requirements and the engineering challenges. The MP is flexible and extensible in the sense that it supports plug-and-play of DER devices, loads, and functionalities by adopting a ROA. The MP fulfills the interoperability via ESIs. We develop and deploy the prototype system in the testbed at the UCLA SMERC and conduct experiments to evaluate the microgrid management and control in real-world settings. Our experimental results demonstrate that the MP is able to manage various devices in the testbed, interact with external systems, and perform optimal energy scheduling and DR.
Fig. 7. The result of the DR experiment.
R EFERENCES
B. DR
[1] F. Katiraei, R. Iravani, N. Hatziargyriou, and A. Dimeas, “Microgrids management,” IEEE Power Energy Mag., vol. 6, no. 3, pp. 54–65, May 2008. [2] W. Su and J. Wang, “Energy management systems in microgrid operations,” The Electricity J., vol. 25, no. 8, pp. 45 – 60, Oct. 2012. [3] A. Vaccaro, M. Popov, D. Villacci, and V. V. Terzija, “An integrated framework for smart microgrids modeling, monitoring, control, communication, and verification,” Proc. IEEE, vol. 99, no. 1, pp. 119–132, 2011. [4] Q. Chen, H. Ghenniwa, and W. Shen, “Web-services infrastructure for information integration in power systems,” in Proc. IEEE PES Gen. Meet., Montreal, Canada, Jun. 2006. [5] G.-H. Yang and V. O. Li, “Energy management system and pervasive service-oriented networks,” in Proc. IEEE SmartGridComm, Gaithersburg, MD, Oct. 2010. [6] A. Mercurio, A. Di Giorgio, and P. Cioci, “Open-source implementation of monitoring and controlling services for EMS/SCADA systems by means of web services,” IEEE Trans. Power Del., vol. 24, no. 3, pp. 1148–1153, Jul. 2009. [7] X. Fang, S. Misra, G. Xue, and D. Yang, “Smart grid - the new and improved power grid: A survey,” IEEE Commun. Surveys Tuts., vol. 14, no. 4, pp. 944–980, 2012. [8] W. Shi, N. Li, X. Xie, C.-C. Chu, and R. Gadh, “Optimal residential demand response in distribution networks,” IEEE J. Sel. Areas Commun., vol. 32, no. 7, pp. 1441–1450, Jul. 2014. [9] R. T. Fielding, D. Software, and R. N. Taylor, “Principled design of the modern web architecture,” ACM Trans. Internet Technology, vol. 2, pp. 115–150, 2002. [10] E.-K. Lee, R. Gadh, and M. Gerla, “Energy service interface: Accessing to customer energy resources for smart grid interoperation,” IEEE J. Sel. Areas Commun., vol. 31, no. 7, pp. 1195–1204, Jul. 2013. [11] R. Huang, T. Huang, R. Gadh, and N. Li, “Solar generation prediction using the ARMA model in a laboratory-level micro-grid,” in Proc. IEEE SmartGridComm, Tainan, Taiwan, Nov. 2012. [12] M. Majidpour, C. Qiu, P. Chu, R. Gadh, and H. R. Pota, “Fast demand forecast of electric vehicle charging stations for cell phone application,” in Proc. IEEE PES Gen. Meet., National Harbor, MD, Jul. 2014. [13] P. Zhang, F. Li, and N. Bhatt, “Next-generation monitoring, analysis, and control for the future smart control center,” IEEE Trans. Smart Grid, vol. 1, no. 2, pp. 186–192, Sept. 2010. [14] E.-K. Lee, R. Gadh, and M. Gerla, “Resource centric security to protect customer energy information in the smart grid,” in Proc. IEEE SmartGridComm, Tainan, Taiwan, Nov. 2012. [15] R. Huang, E.-K. Lee, C.-C. Chu, and R. Gadh, “Integration of IEC 61850 into a distributed energy resources system in a smart green building,” in Proc. IEEE PES Gen. Meet., National Harbor, MD, Jul. 2014. [16] N. Li, L. Chen, and S. H. Low, “Optimal demand response based on utility maximization in power networks,” in Proc. IEEE PES Gen. Meet., Detroit, MI, Jul. 2011. [17] S. Boyd and L. Vandenberghe, Convex Optimization. Cambridge University Press, 2004. [18] C. Cecati, C. Citro, and P. Siano, “Combined operations of renewable energy systems and responsive demand in a smart grid,” IEEE Trans. Sustain. Energy, vol. 2, no. 4, pp. 468–476, Oct. 2011.
We consider a DR where the MP changes the demand in response to the real-time energy prices. In order to focus on the DR effect, we pick only the dimmable LEDs to participate in the DR. The DR optimization can then be simplified as a problem to be solved at each time t: X max −ηl (pl (t) − pfl (t))2 pl (t)
s.t.
l∈L pmin (t) l
X
≤ pl (t) ≤ pmax (t), ∀l ∈ L l
pl (t) ≤ Pmax (t),
l∈L
where L includes only the LEDs and pfl (t) corresponds to the brightness preferred by the customer. In our DR experiment, Pmax (t) is defined as a linear piecewise function which translates the real-time price ρ(t) from the CAISO to the maximum allowed total power: P f ρ(t) < 6 ¢/kWh l∈L pl (t), P f 0.8 p (t), 6 ¢/kWh ≤ ρ(t) ≤ 10 ¢/kWh Pmax (t) = Pl∈L fl 0.7 p (t), 10 ¢/kWh < ρ(t) ≤ 14 ¢/kWh Pl∈L fl 0.6 l∈L pl (t), otherwise (11) The LEDs are assumed to be equally deployed in four offices with different priorities (ηl = 5, 10, 15, 20). The brightness of the LED can be dimmed within the range [0, 100]. The minimum, maximum, and preferred brightness are set to 20, 100, and 80, respectively. The DR algorithm is implemented as a web service using JOptimizer 9 . It is able to accept DR signals from the DRAS and sends out control signals to the LEDs via the MP. We conduct the DR experiment on March 27th, 2014. The real-time price, the total power consumption, and the power consumption by each priority group are shown in Fig. 7. From the figure, we can see that the MP is able to reduce the total power consumption in response to the price changes. The demand reduction is based on priority where the devices with lower priorities reduce more than those with higher priorities. 9 http://www.joptimizer.com/
6