Oct 25, 2004 - George A. Allen. NESCAUM, 101 Merrimac St., ... and winter PM2.5 sample filters from this site often exhibit a distinct âwood smoke odorâ. Local.
Evaluation of a New Approach for Real Time Assessment of Wood Smoke PM George A. Allen NESCAUM, 101 Merrimac St., Boston MA 02114 Peter Babich CT-DEP, Bureau of Air Management, 79 Elm Street, Hartford, CT 06106 Richard L. Poirot Vermont DEC - APCD, 103 South Main Street-Building 3 South, Waterbury, Vermont 05671
ABSTRACT Wood smoke from forest fires or anthropogenic activities can be a significant contributor to regional haze and PM2.5, but routine methods to quantify the extent of this source’s contribution to visibility impairment and ambient levels of PM2.5 have not been developed and evaluated. This paper evaluates an approach to semi-quantitatively measure the fraction of PM that is from wood smoke (WS PM) in real-time. A two-wavelength Aethalometer™ (Magee Scientific model AE42) was used to measure the optical absorption of PM-1 ambient aerosol at 880 nm (BC) and 370 nm (UV-C). Certain organic aerosol components of wood smoke PM have enhanced optical absorption at 370 relative to 880 nm (“Delta-C”). This enhanced absorption is shown to be a specific "indicator" of WS PM, but alone is not a quantitative mass measurement. Improved quantification of WS PM can be obtained when the two-channel Aethalometer is collocated with continuous PM2.5 and other measurements. A pilot study was performed to evaluate the potential for this approach in Rutland, VT between February and July, 2004. Aethalometer measurements were made at an existing VT-DEC monitoring site, collocated with continuous PM2.5, SO2, CO, and NOx measurements. Rutland is a valley city surrounded by elevated terrain and subject to strong winter morning inversions, and winter PM2.5 sample filters from this site often exhibit a distinct “wood smoke odor”. Local mobile sources also contribute to the observed PM and BC concentrations (but not Delta-C) at this site, primarily during weekday morning rush hour periods. Monitoring was performed during seasons with and without wood smoke to allow assessment of mobile source signatures without heating sources, since both have large BC components. The UNMIX model was used to apportion measured PM2.5 into several source categories; NOx and SO2 are used to distinguish PM contributions from WS, oil burning (primarily space heating), and mobile sources. WS PM was associated only with the Aethalometer Delta-C measurement even in the presence of substantial local mobile source and oil-burning aerosols.
Paper #16, presented at the Air & Waste Management Association Visibility Specialty Conference on Regional and Global Perspectives on Haze: Causes, Consequences and Controversies. Asheville, NC, October 25-29, 2004. Evaluation of a New Approach for Real Time Assessment of Wood Smoke PM Allen et al. Oct. 2004
Page -1-
INTRODUCTION Wood smoke from forest fires, wood stove space heating, or recreational fireplace use can be a significant contributor to regional haze and PM2.5. As with other combustion-related PM sources, exposure to elevated levels of wood smoke is likely to have both short and long-term adverse health effects. Particle size distributions from wood combustion are also typically highly efficient at scattering visible light, making residential wood combustion a potentially important contributor to local and regional haze, especially in lower elevation valley areas during winter. Daily PM2.5 speciation samples have been used to identify the extent of this source’s contribution to levels of PM2.5. Non-soil potassium (KNON) is a reasonably specific but qualitative indicator of wood smoke PM1. There are potential limitations to KNON since the K is emitted as gas phase, and the amount that is transformed into aerosol phase is a function of smoke age and other parameters. PMF and UNMIX have been used to apportion wood smoke PM using K and a variety of other input parameters2,3. Gao et al.’s presentation at this conference4 updates the PMF analysis in Polissar et al.2 Other approaches include EC/OC ratios and gas-phase indicators5. This work evaluates an approach to semi-quantitatively measure the fraction of PM that is from wood smoke (WS PM) in real-time. Highly time-resolved measurements (1-2 hours or shorter) provide valuable additional insight into the dynamics of sources and dispersion that allow enhanced understanding of these processes on observed concentrations. These dynamics are often lost in a daily (24-hour) integrated sample. Anecdotal reports indicate that some organic aerosol components of wood smoke PM have enhanced optical absorption at 370 nm relative to 880 nm, but often also state that diesel-related PM has a similar enhanced response. Measurements made by Hopke et al. in Philadelphia PA during the Quebec forest fire event in July, 2002 show a substantial enhancement in optical absorption at 370 relative to 880 nm.6 In this work, we show that the enhanced absorption is a specific "indicator" of WS PM in the presence of local mobile sources, and that local diesel and spark-ignition mobile sources do not significantly contribute to this enhanced absorption signal.
METHODS A two-wavelength Aethalometer™ (Magee Scientific model AE42, the portable version of the model AE-21) with a BGI/Magee SCC 0.732 PM-1 2 LPM inlet cyclone was used to measure the optical absorption of PM-1 ambient aerosol at 880 nm (black carbon or BC) and 370 nm (UV-C). The Aethalometer reports aerosol absorption on a quartz fiber filter, empirically scaled to units of BC in ng/m3 for both wavelength channels7. The method uses a simple inverse-lambda relationship to scale the UV-C channel data relative to the BC channel. Several field studies have shown that the Aethalometer BC is well correlated to thermal measurements of EC8,9,10. However, neither UV-C or UV-C minus BC (“Delta-C”) are direct quantitative mass measurements of anything. Improved quantification of WS PM can be obtained when the twochannel Aethalometer is collocated with continuous PM2.5 and other measurements, and generic Delta-C to WS pm factors can be determined.
Evaluation of a New Approach for Real Time Assessment of Wood Smoke PM Allen et al. Oct. 2004
Page -2-
A pilot study was performed to evaluate the potential for this approach in Rutland, VT between February 11 and July 19, 2004. Rutland is a valley city surrounded by elevated terrain and subject to strong winter morning inversions11, and winter PM2.5 sample filters from this site often exhibit a distinct “wood smoke odor”. Local mobile sources also contribute to the observed PM at this site, primarily during weekday morning rush hour periods. Information about and pictures from the site location are at: http://www.anr.state.vt.us/air/Monitoring/htm/RutlandInfo.htm Aethalometer BC and UV-C measurements were made at the existing VT-DEC Rutland monitoring site, collocated with continuous PM2.5, SO2, CO, and NOx measurements; all data were averaged to one-hour intervals. Monitoring was performed during seasons with and without wood smoke to allow assessment of mobile source signatures without heating sources, since both have large BC components. The UNMIX model12 was used to apportion measured PM2.5 into several source categories; NOx and SO2 are used to distinguish PM contributions from WS, oil burning (primarily space heating), and mobile sources. WS was associated only with the Aethalometer Delta-C measurement even in the presence of substantial local mobile source aerosols. UNMIX Procedures The UNMIX receptor model (version 3.1, February 2004) was employed in a "non-traditional" manner with the specific objectives of identifying a unique wood smoke source influence on the measured fine mass, on several collocated gaseous pollutant species, and on the Aethalometer measurements (including a quantitative estimate of the ratio of wood smoke mass to Delta-C). In a more traditional application, the UNMIX model would employ both mathematical and physical constraints, where the input data would include a large number of independent mass-contributing species with the physical constraint that the resultant mass of each source be equal to the sum of its contributing species. In this case, the available measurement data included only a few mass components (volatile and non-volatile PM2.5), carbon indicators (Aethalometer BC and Delta-C) and collocated gaseous species (SO2, NO and CO). All of the above were used as input, with results normalized to the total PM2.5 mass. The gaseous species may help discern or interpret resulting sources but do not contribute directly to the apportioned source's PM2.5 mass. The raw hourly measurement data for the period 2/11/04 through 4/30/04 were prepared for input as follows. The CO data were adjusted to remove effects of instrumental drift by fitting and removing linear trend lines to two periods of obvious upward drift. For all species, negative values were set to zero and missing data for periods with less than 4 contiguous missing hours were filled by assuming linear change between the preceding and following hours. UNMIX visual data screening tools were employed to remove occasional outlier species & observations that fell outside the relational bounds of the rest of the data. The resulting input data included 1,802 hourly observations (95% of all possible measurement hours) with valid data for eight PM-related and gaseous species for the period 2/11/04 through 4/30/04. Various meteorological data were employed to help interpret and evaluate the UNMIX results. These include hourly ambient temperature (measured on site), hourly wind speed (from the Rutland State Airport, 5 miles to the south, obtained via the FASTNET website13), and every 3rd Evaluation of a New Approach for Real Time Assessment of Wood Smoke PM Allen et al. Oct. 2004
Page -3-
hour estimates of mixing depth and Pasquill stability class directly over the monitoring site, (obtained via the NOAA READY website14 using archived EDAS 40 km gridded windfields).
RESULTS Results from a 5-Source UNMIX solution are summarized in Table 1, where the average source mass contributions are expressed in µg/m3 and the PM-related components (BC, Delta-C, non-volatile and volatile fine mass) are expressed as the percent of each source's mass contributed by each species. The gaseous species are expressed as the fraction of the total concentration of each gaseous species contributed by each source. Table 1. Unmix Modeled Source Compositions for Rutland, VT, 2/11/04 - 4/30/04. Source Mass Compositions and Gaseous Contributions Average Fine Mass (ug/m3)
Wood Oil Smoke Burning
Fresh MV
Aged MV
Secondary Aerosol
3.3
3.5
1.4
3.1
2.3
BC (% Source Mass)
4
3
18
9
0
Delta-C (% Source Mass)
7
0
0
0
0
Non-Vol Mass (% Source Mass)
95
100
99
99
20
Volatile Mass (% Source Mass)
5
0
1
1
80
SO2 (Source % of Total SO2)
12
56
25
4
1
NO (Source % of Total NO)
5
5
81
11
0
CO (Source % of Total CO)
12
1
31
55
2
The modeled sources are interpreted as: • Wood Smoke - which accounted for 24% of the PM2.5 mass and 99% of the Delta-C, representing 7% (1/15th) of the wood smoke mass. A small fraction (5%) of this source mass was volatile. Its magnitude declines sharply as the weather warms, from 6.7 µg/m3 in February to 1.4 µg/m3 in April, indicating dominant contributions from residential and/or industrial space heating sources. • Oil (and other fossil fuel) Combustion - which accounted for 26% of the PM2.5 mass and 56% of the total measured SO2. Its magnitude also declines substantially from February (4.5 µg/m3) through April (2.5 µg/m3), suggesting that it is influenced by primarily by winter space heating sources rather than by year-round industrial process or utility emissions. • Fresh Motor Vehicle (MV) Exhaust - which accounted for 10% of the PM2.5 mass and included a very high mass fraction (18%) of BC, suggesting a significant contribution from diesel exhaust. This source also accounted for 81%, 31% and 25% of the measured NO, CO and SO2 respectively. • Aged Motor Vehicle Exhaust - which accounted for 23% of the PM2.5 mass and included a relatively high BC mass fraction of 9% and which accounted for 55% of the total CO Evaluation of a New Approach for Real Time Assessment of Wood Smoke PM Allen et al. Oct. 2004
Page -4-
but only 11% of the NO. The much higher CO:NO ratio in this “aged” source compared to the “fresh” MV suggests general influence from traffic on a city-wide scale, vs. fresh emissions from near the monitoring site. • Secondary Aerosol - which accounted for 17% of the PM2.5 mass and for which the volatile component represented 80% of the total mass. There was virtually no BC, Delta-C or gaseous species associated with this source. Two of the highest daily contributions from this source occurred on 2/20/04 and 3/1/04 - days on which large-scale regional nitrate events have been observed at sites in the northeastern US and Southern Canada from west of the Great Lakes through Northern New England and Southern Quebec. This suggests this source may have a high nitrate content and be influenced by more distant emission sources. Average diurnal PM2.5 mass contributions and percent contributions from the modeled sources are displayed in Figure 1. The motor vehicle sources show a distinct morning rush hour maxima and a smaller afternoon increase, the secondary aerosol source peaks at mid-day, and the wood and oil combustion sources peak at night. Figure 1. Absolute and Percent Source Contributions to Hourly PM2.5 Mass, by hour of day.
The wood smoke, oil and secondary aerosol sources are of similar magnitude on weekdays and weekends, but the fresh and aged motor vehicle sources exhibit distinct day of week differences. As shown in Figure 2, the fresh motor vehicle source shows a substantial reduction in morning rush-hour concentrations on weekends. The aged MV source also shows a weekend reduction in morning peak and mid-day levels compared to weekdays, but also shows an increase in late night concentrations on weekends. The very sharp weekday rush-hour peak, absence of afternoon peak, and high BC, NO and SO2 content of the fresh motor vehicle source are all suggestive of a large and nearby influence of diesel exhaust on this modeled source. The broader, more prolonged weekday morning and afternoon peaks, night-time weekend increases, lower BC, low Evaluation of a New Approach for Real Time Assessment of Wood Smoke PM Allen et al. Oct. 2004
Page -5-
SO2 and high CO:NO ratio for the aged motor vehicle source are all consistent with a more distant (city or valley-wide) influence with a higher contribution from gasoline motor vehicle exhaust. Figure 2. Weekday/Weekend changes in diurnal mobile source influence.
While the modeled mobile source impacts appear responsive to anthropogenic traffic emissions patterns, ambient pollutant concentrations resulting from these and other local emissions sources should also be strongly influenced by local meteorological dispersion conditions - especially during the winter in a northern valley with elevated surrounding terrain. Stable conditions and occasional strong inversions at night dissipate with daytime increases in solar radiation, temperature, wind speed and mixing depth. Figure 3 displays relative changes in the modeled source influences, sorted by various meteorological categories. In each panel of this figure, the concentrations of each individual source are normalized by expressing the source’s average concentration in each meteorological category as a percentage change from its mean concentration. The objective is to show which sources respond most strongly to which changes in local meteorological conditions.
Evaluation of a New Approach for Real Time Assessment of Wood Smoke PM Allen et al. Oct. 2004
Page -6-
Figure 3. Relative source contribution by meteorological category.
Evaluation of a New Approach for Real Time Assessment of Wood Smoke PM Allen et al. Oct. 2004
Page -7-
It can be noted that all sources exhibit increasing concentrations with decreases in wind speed and mixing height and with increases in atmospheric stability. Generally, the concentrations of wood smoke appear to be most responsive to changes in dispersion conditions, while the “secondary aerosol” source, which presumably has a large contribution from more distant source regions, is least responsive to local meteorology. In the lower right panel it can be noted that the coldest temperatures are associated with the largest relative increases in both the wood and oil burning source concentrations. While cold temperature is correlated with and an indicator of poor dispersion conditions, it also leads to increased heating demands and so should uniquely affect concentrations from space heating sources. The fresh MV source also shows a moderately large increase as temperature decreases. This would be consistent with increased cold start operations and vehicle idling times (especially for diesels), and might be further enhanced by a less rapid chemical aging of fresh emissions, consistent with the opposite pattern of increase with temperature exhibited by the aged MV source. Thus the modeled sources’ chemical compositions, their day of week and hourly patterns, and their changing concentrations in response to meteorological conditions are all consistent with the modeled source interpretations. This suggests that Delta-C may indeed be a useful quantitative indicator of wood smoke concentrations in the presence of other strong carbonaceous, sulfur-emitting and secondary aerosol source influences. Figure 4 shows the absolute fine mass Figure 4. Source categories contribution to PM2.5 contributions of the modeled sources by temperature. under different temperature conditions for the February through April measurement period. During this latter half of the 2004 heating season in Rutland, when the temperature was often above freezing, PM2.5 mass concentrations averaged below 13 µg/m3, with wood smoke accounting for about 1/5 of the mass. When temperature was below freezing, fine mass exceeded 15 µg/m3, with wood smoke accounting for about 1/3 of the mass. When temperatures dropped below -10 degrees C, fine mass averaged 25 µg/m3, half of which was contributed by wood smoke. Under worst case conditions, wood smoke alone accounted for up to 10 µg/m3 (daily) and 25 µg/m3 (hourly) of PM2.5 mass.
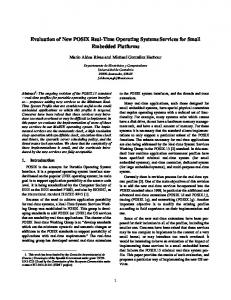
The UNMIX analysis presented here is limited to heating season data. Data were collected beyond this period to include the non-space heating season. Figure 5 is a smoothed 4.5 month time series plot of SO2 and Delta-C hourly data. After about May 12, there is no significant Evaluation of a New Approach for Real Time Assessment of Wood Smoke PM Allen et al. Oct. 2004
Page -8-
signal in either SO2 or Delta-C, consistent with both being driven by local space heating sources. Improved dispersion in the warm weather (fewer winter valley inversions) could also be contributing to the observed seasonal pattern in these pollutants. Figure 5. SO2 and Delta-C 24-hour running average (February through June, 2004).
1.2 15
SO2 (ppb)
1.0
0.8 10
0.6
Effective end of heating season
5
0.4
0.2
0
3
1.4 SO2 Delta-C Woodsmoke PM indicator
Aethalometer "Delta-C" Woodsmoke Indicator (µg/m ) - Not scaled to WS PM
20
0.0 12 15 18 21 24 27 1 4 7 10 13 16 19 22 25 28 1 4 7 10 13 16 19 22 25 28 1 4 7 10 13 16 19 22 25 28 1 4 7 10 13 16 19 22 25 28 Feb Mar Apr May June
February 11 - June 30, 2004
Figure 6 is a smoothed 5-month time series plot of BC and Delta-C hourly data from February to July 2004. The downward trend in Delta-C data is very pronounced, with data after the end of the heating season mid-May showing a clear negative influence of BC on Delta-C. This negative interference is typical of this method in urban areas. It is presumably due to the size of the BC particles being approximately equal to the UV-C channel wavelength of 370 nm and less than the BC channel wavelength of 880nm; the optical absorption measurement principle used by the Aethalometer is only valid for estimation of particle mass when the particles are smaller than the wavelength used. To the extent that this interference is consistent over time, it could be partially corrected for to improve the quality of the Delta-C WS indicator parameter; this would increase the measured Delta-C concentration during periods with high BC concentrations.
Evaluation of a New Approach for Real Time Assessment of Wood Smoke PM Allen et al. Oct. 2004
Page -9-
BC and Delta-C, µg/m
3
Figure 6. BC and Delta-C 24-hour running average (February to July, 2004). 2.3 2.2 2.1 2.0 1.9 1.8 1.7 1.6 1.5 1.4 1.3 1.2 1.1 1.0 0.9 0.8 0.7 0.6 0.5 0.4 0.3 0.2 0.1 0.0 -0.1 -0.2 12 15 18 21 24 27 1 4 7 10 13 16 19 22 25 28 1 4 7 10 13 16 19 22 25 28 1 4 7 10 13 16 19 22 25 28 1 4 7 10 13 16 19 22 25 28 1 4 7 10 13 16 19 Feb Mar Apr May June July
Feb 11 - July 19, 2004
CONCLUSIONS The two-channel Aethalometer Delta-C signal is shown to be a specific indicator of wood smoke-related PM even in the presence of substantial local mobile aerosols and oil burning. An approximate factor of 15 can be used to semi-quantitatively convert Delta-C to WS PM, providing a method to measure WS related PM2.5 in near real-time. Additional confidence in any WS PM estimate can be gained by measuring PM2.5 at the same time. Future work includes running UNMIX on data from the non-space heating season as well as both seasons combined to assess the stability of the mobile source parameters. The model results might be refined by additional pre-processing of the data, including corrections for BC interference on Delta-C and improved methods for correction of drift in the CO baseline. The uncertainty in the WS to PM factor has not yet been quantified, both on a short term basis and across sites, and with respect to local versus aged WS. Additional sites with less local and more regional wood smoke influence would be useful in this respect. Finally, comparison of these results against more traditional (integrated) measures of wood smoke indicators could be done.
Evaluation of a New Approach for Real Time Assessment of Wood Smoke PM Allen et al. Oct. 2004
Page -10-
REFERENCES 1. Song XH, Polissar AV, Hopke PK (2001). “Sources of fine particle composition in the northeastern US.” Atmos. Environ., 35:5277-5286. 2. Polissar AV, Hopke PK, Poirot RL (2001). “Atmospheric aerosol over Vermont: chemical composition and sources”. Environ. Sci. Technol. 35:4604-4621. 3. Poirot RL, Wishinski PR, Hopke PK, Polissar AV (2001). “Comparative application of multiple receptor methods to identify aerosol sources in northern Vermont.” Environ. Sci. Technol. 35:4622-4636. 4. Gao N, Lafferty K, Panday P, Hopke PK, Kim E, Poirot RL (2004). “Sources of fine particulate species in ambient air over Vermont”. These proceedings. 5. Khalil, MAK, Rasmussen RA (2003). “Tracers of wood smoke.” Atmos. Environ. 37:12111222. 6. Jeong CH, Hopke PK , Kim E, Lee DW (2004). “The comparison between thermal-optical transmittance elemental carbon and Aethalometer black carbon measured at multiple monitoring sites.” Atmos. Environ. 38:5193-5204 7. Hansen ADA, Rosen H, Novakov T. (1984). “The Aethalometer - an instrument for the real-time measurement of optical absorption by aerosol particles.” Sci. Total Environ. 36:191. 8. Allen GA, Lawrence J, Koutrakis P (1999). "Field validation of a semi-continuous method for aerosol black carbon (Aethalometer) and temporal patterns of summertime hourly black carbon measurements in southwestern Pennsylvania". Atmos. Environ. 33:817-823. 9. Babich P, Davey M, Allen G, Koutrakis P. (2000). “Method comparisons for particulate nitrate, elemental carbon, and PM 2.5 mass in seven U.S. cities.” J. Air Waste Manage. Asso. 50 (8) 10. Lim HJ, Turpin BJ, Edgerton E, Hering SV, Allen GA, Maring H, Solomon P (2003). “Semicontinuous aerosol carbon measurements: Comparison of Atlanta Supersite measurements”. J. Geophys. Res. 108(D7), 8419. 11. VT Dept. of Env. Cons., “Winter Inversion Event (December 2002)”, http://www.anr.state.vt.us/air/Monitoring/htm/SEDecemberInversion.htm 12. Henry RC (2003). “Multivariate receptor modeling by N-dimensional edge detection.” Chemom. Intell. Lab. Syst. 65:2. 13. FASTNET Website and associated data, software tools and event catalog: http://webapps.datafed.net/dvoy_services/dvoy_book.aspx?path=HOME/Projects/FASTNET 14. Rolph GD (2003). Real-time Environmental Applications and Display sYstem (READY) Website: http://www.arl.noaa.gov/ready/hysplit4.html. NOAA Air Resources Laboratory, Silver Spring, MD.
Evaluation of a New Approach for Real Time Assessment of Wood Smoke PM Allen et al. Oct. 2004
Page -11-