Evaluation of an improved algorithm for producing realistic 3D breast software phantoms: Application for mammography K. Bliznakovaa兲 Department of Medical Physics, School of Medicine, University of Patras, 26500 Rio-Patras, Greece
S. Suryanarayananb兲 and A. Karellasc兲 Department of Radiology and Winship Cancer Institute, Emory University School of Medicine, Atlanta, Georgia 30322
N. Pallikarakis Department of Medical Physics, School of Medicine, University of Patras, 26500 Rio-Patras, Greece
共Received 20 November 2009; revised 31 August 2010; accepted for publication 2 September 2010; published 6 October 2010兲 Purpose: This work presents an improved algorithm for the generation of 3D breast software phantoms and its evaluation for mammography. Methods: The improved methodology has evolved from a previously presented 3D noncompressed breast modeling method used for the creation of breast models of different size, shape, and composition. The breast phantom is composed of breast surface, duct system and terminal ductal lobular units, Cooper’s ligaments, lymphatic and blood vessel systems, pectoral muscle, skin, 3D mammographic background texture, and breast abnormalities. The key improvement is the development of a new algorithm for 3D mammographic texture generation. Simulated images of the enhanced 3D breast model without lesions were produced by simulating mammographic image acquisition and were evaluated subjectively and quantitatively. For evaluation purposes, a database with regions of interest taken from simulated and real mammograms was created. Four experienced radiologists participated in a visual subjective evaluation trial, as they judged the quality of the simulated mammograms, using the new algorithm compared to mammograms, obtained with the old modeling approach. In addition, extensive quantitative evaluation included power spectral analysis and calculation of fractal dimension, skewness, and kurtosis of simulated and real mammograms from the database. Results: The results from the subjective evaluation strongly suggest that the new methodology for mammographic breast texture creates improved breast models compared to the old approach. Calculated parameters on simulated images such as  exponent deducted from the power law spectral analysis and fractal dimension are similar to those calculated on real mammograms. The results for the kurtosis and skewness are also in good coincidence with those calculated from clinical images. Comparison with similar calculations published in the literature showed good agreement in the majority of cases. Conclusions: The improved methodology generated breast models with increased realism compared to the older model as shown in evaluations of simulated images by experienced radiologists. It is anticipated that the realism will be further improved using an advanced image simulator so that simulated images may be used in feasibility studies in mammography. © 2010 American Association of Physicists in Medicine. 关DOI: 10.1118/1.3491812兴 Key words: breast modeling, mammography simulation, evaluation
I. INTRODUCTION Breast cancer is the most common cancer in women. In Europe, one in ten women develops this type cancer in her lifetime, while in the United States, it is the second leading cause of cancer death. Currently, the best method for its early detection before it becomes clinically palpable is x-ray mammography. European studies have shown that breast cancer mortality is reduced by about 37% in women 50–69 yr of age who are subjected to screening mammography,1 while in the United States, this number varies from 28% to 65%.2 The latter is a result of a large study involving a consortium of 5604
Med. Phys. 37 „11…, November 2010
investigators that developed seven statistical models of breast cancer incidence and mortality to investigate the contribution of screening mammography and adjuvant treatment to the reduction of breast cancer mortality in the period from 1975 to 2000. The optimization of digital mammography is of critical importance as we make the transition from film to digital detectors and eventually to tomographic and 3D imaging of the breast. Emerging technologies include tissue perfusion imaging,3 digital breast tomosynthesis,4 and cone beam breast computer tomography.5 The performance of these new
0094-2405/2010/37„11…/5604/14/$30.00
© 2010 Am. Assoc. Phys. Med.
5604
5605
Bliznakova et al.: Improved algorithm for producing realistic breast software phantoms
techniques should be assessed and optimized before clinical deployment. Clinical studies, however, can be expensive and time consuming. Three-dimensional phantoms are needed for the evaluation of image quality and the accurate depiction of fine anatomic detail. However, anatomically realistic physical phantoms are not widely available and the manufacturing of such phantoms is an extremely difficult task with the current technology. The use of computer modeling for the generation of computer or “virtual” phantoms offers an expedient and a potentially more effective alternative to physical phantoms. Simulation and computer modeling offers a cost effective, practical, and flexible alternative approach to design experiments for the assessment and optimization of image quality of forthcoming x-ray breast imaging systems, prior to clinical deployment or for quality assurance purposes. Computer models mimic the anatomy and shape of the female breast and simulate the x-ray projection. Simple mathematical phantoms have been used very effectively for radiation dosimetry, optimization of acquisition geometry, x-ray spectrum, and detector optimization.5–12 The breast is usually modeled in the form of a cylinder, half-ellipsoid, or simply parallelepiped with adjustable size and glandular to adipose tissue ratio. They are simulated as a homogeneous mixture of glandular and adipose tissue surrounded by an adipose layer. Tissue compositions are usually taken from Hammerstein et al.13 More complex phantoms can be generated by simulating 3D breast tissue distribution, obtained by applying the concept of 3D power law noise.14,15 Advanced breast models with 3D realistic breast tissue distribution and anatomical features16–18 have been developed in order to carry out feasibility studies with 2D and 3D x-ray breast imaging techniques, including optimization of image number and dose per image in digital breast tomosynthesis and breast dual energy,10,15,18–20 as well as to perform accurate breast dosimetry,21 evaluate nonrigid mammogram registration techniques,22 calculate the properties of the digital mammograms23 and investigate the effect of digital breast tomosynthesis acquisition parameters on computer-extracted texture features.24,25 These models offer complex breast tissue simulation and allow the generation of realistic synthetic mammograms which resemble the real ones. Recently, Ma et al.18 reported an advanced new breast model suitable for work with general purpose Monte Carlo codes for simulation of x-ray projection images. Synthetic mammograms are calculated utilizing basically two approaches. The most popular approach is to simulate the beam transport through the mammographic system, as the transmitted intensity through the breast is calculated on the basis of exponential attenuation of incident beams.16,17,23,26 This approach produces images quite quickly but is limited to the simulation of primary radiation effects only. In order to account for the photon noise under realistic conditions, quantum noise is added. Monte Carlo simulation programs18,27,28 that simulate the beam interaction including the scattered radiation have been developed. Medical Physics, Vol. 37, No. 11, November 2010
5605
Previously, we described a computer model of the breast that allows simulation of the internal structures under normal and compressed conditions.17,29 This model is limited to low resolution due to computational and methodological limitations. Efforts were focused on the development of a new algorithm for a very realistic mammographic tissue texture generation. This paper reports on the improved methodology for 3D breast model generation and specifically presents a new algorithm for this task. The paper also focuses on the evaluation of the improved breast model for its application in mammographic studies. This has been accomplished by subjective and quantitative evaluation of synthetic mammograms obtained by simulating mammography imaging. In the subjective evaluation, experienced radiologists judged the quality of mammograms synthesized with the new and old methodology for the creation of breast models, while the objective evaluation involved comparison of texture features extracted from simulated and real mammograms as well as with published data. The results indicate that images of breast models, synthesized using the new methodology for mammographic breast texture creation, reach a high degree of similarity to real mammograms.
II. MATERIALS AND METHODS II.A. Breast model
Briefly described, the breast phantom is a composite model of the female breast and includes the breast shape, the mammary duct system, the Cooper’s ligaments, the pectoral muscle, vessels, skin, mammographic texture, and breast abnormalities. The breast surface is modeled as a combination of two geometrical primitives: An elongated semiellipsoid and an elongated semihyperboloid. The duct system is simulated using a network of cylinders, probabilistically arranged in the breast as branches in a treelike arrangement, starting from the nipple and restricted by the external breast contour. The mammographic texture simulates the presence of adipose, fibrous, and connective tissues, as well as other nonglandular tissue types that are not explicitly modeled. Cooper’s ligaments are modeled as a set of thin ellipsoid shells, originating at randomly sampled positions in the breast model, while the pectoralis muscle is approximated as a cone shaped object. Breast abnormalities are modeled with round, ovoid, elongated, and irregular shapes. The lymphatic system is modeled as a set of cylinders, originating at sampled positions in a surface hyperboloid layer and in the medial edge of the semiellipsoid, while the lymph nodes are simulated as bean-shaped objects varying in size from several millimeters to several centimeters in diameter. Blood vessels are simulated in a similar way as the lymph vessels. The skin is represented as a surface layer of thickness 1–2 mm. All geometrical primitives are transformed to voxel values of the final breast matrix. The lymphs, the blood vessels, and the skin are new features introduced in the model. Finally, the mammographic texture that represents breast structures that are not explicitly modeled is synthesized.
5606
Bliznakova et al.: Improved algorithm for producing realistic breast software phantoms Random walks
Empty matrix
RWM
+
Dilation
5606
DM
+
+
Low Pass Filtering FTM
GM
+
Fit to the shape
LPM
+
Gaussian Filtering
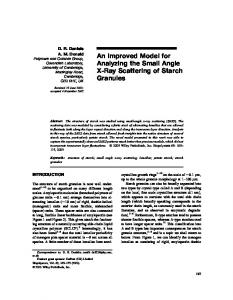
FIG. 1. The main steps in composing the mammographic texture. The images are slices extracted from a breast matrix with size of 75 mm in each direction and voxel dimension of 150 m. The texture matrix was created using the following parameters: Number of random walks Nwalks = 1500, number of steps per walk Nsteps = 2000, increment h = 0.1, and Hurst exponent H = 0.95. Additionally, a 3 ⫻ 3 ⫻ 3 mask was used to perform the low pass filtering and dilation, while the standard deviation 共兲 value for the Gaussian filtering was set to 1.5. For better understanding, the names of the matrices obtained after the steps are related with the imaging operation performed, namely, RWM: Random walk matrix; DM: Dilation matrix; LPM: Low pass filtering matrix; GM: Gaussian matrix; and FTM: Final texture matrix.
The previous approach for mammographic texture simulation used generation of a set of 2D synthetic images from 2D power law noise.17 The 3D mammographic texture was obtained by mapping each image pixel gray-level value into this matrix at a height related to the pixel’s gray-level value, while the other two coordinates were considered the same. The voxel value was obtained by averaging the gray values of the synthetic pixel and the previous value of the matrix voxel. The steps of the new algorithm for generation of mammographic texture are shown in Fig. 1. Initially, the texture matrix is filled with random walks, calculated using the concept of the “fractional Brownian motion 共fBm兲 model.” This was prompted by the fact the fBm has a Gaussian nature that allows long-range correlations and has strong scaling properties and features observed in mammograms.30 A short description of the fBm process is given in the Appendix. The algorithm for the initial filling of the breast matrix with three-dimensional random walks is outlined in Fig. 2. Threedimensional random walks are simulated with coordinates 共xi , y i , zi兲 selected randomly around the nipple origin and anywhere in the breast matrix. Further on, each random walk moves to another voxel that has a position 共xi+1 , y i+1 , zi+1兲, calculated from the voxel positions, determined in the previous stage 共xi , y i , zi兲 as they first are displaced by the addition of a variable obtained from the multiplication of the increment t and a random variable GD共1 , 0兲 with a Gaussian distribution with standard deviation and mean value equal to one and zero, respectively, Medical Physics, Vol. 37, No. 11, November 2010
FIG. 2. Algorithm for random walks generation. Nwalk and Nsteps are the number of three-dimensional random walks and the corresponding random steps per walk.
xi+1 = xi + t ⴱ GD共1,0兲 y i+1 = y i + t ⴱ GD共1,0兲 , zi+1 = zi + t ⴱ GD共1,0兲
t = hH i = 0,1,2, . . . . . . 共Nsteps − 1兲
, 共1兲
where H is a parameter related to the fractal dimension of a fractal object and is called Hurst exponent, h is the step increment in mm, while Nsteps is the number of steps that a random walk may take. The process described by Eq. 共1兲 is repeated until the random walk reaches either the matrix boundary or the end of the number of steps Nsteps. Similarly simulated are all random walks 共Nwalks兲 whose number is assigned by the user. The increment h is by default set to the size of the voxel in one dimension, while H can vary between 0 and 1 共Appendix兲. The matrix obtained from the random walk operations, denoted as random walk matrix
5607
Bliznakova et al.: Improved algorithm for producing realistic breast software phantoms
共RWM兲, may be further subjected to additional 3D imaging morphological operations as dilation and smoothing that aim to improve the realism of the 3D breast tissue distribution in the model. These operations are optional and selected by the user. Three-dimensional dilation is used to dilate the initial 3D texture in the neighborhood and to generate more data. For
w/2
SEDM共x,y,z兲 =
w/2
this purpose, a customized dilation is applied to the 3D walks to obtain the dilated matrix, denoted with DM in Eq. 共2兲 and Fig. 1. The voxels that are already filled are preserved, while the neighbor voxels obtain values, sampled according to Eq. 共2兲. The structuring element SEDM is a cube with a dimension assigned by the user 共by default 3 ⫻ 3 ⫻ 3兲 and defined in the following way:
w/2
兺 兺 兺
RWM共x + i,y + j,z + k兲,
i=−w/2 j=−w/2 k=−w/2
DM共x,y,z兲 =
5607
p2 + RWM共x,y,z兲2 RWM共x,y,z兲 + p
再
SEDM共x,y,z兲 ⬎ 0.9
p = 0,
p 傺 共0,1兲, 0 ⬍ SEDM共x,y,z兲 ⱕ 0.9
冎
共2兲
,
where 共x , y , z兲 is the current voxel coordinate in the dilated matrix, w is the size of the structuring element, and p is a randomly generated value between 0 and 1. Low pass filter is applied with a coefficient of 2 in the central voxel of the structuring element and a value of 1 in the neighboring voxels, in order to smooth the boundaries of the texture. The matrix obtained from this operation is denoted with LPM in Fig. 1 and the process is described by the following equations: w/2
w/2
w/2
1 SELPM共x,y,z兲 = 3 兺 兺 兺 g · DM共x + i,y + j,z + k兲 w i=−w/2 j=−w/2 k=−w/2 LPM共x,y,z兲 =
g = 1,
else
冎
,
共3兲
GM共x = const,y,z兲 LPM共x = const,y,z兲 w/2
g = 2, i = 0, j = 0,k = 0
DM共x,y,z兲 . SELPM共x,y,z兲
In the above equations, the DM should be replaced by the RWM matrix for the case where dilation is not performed. More smoothing is achieved by applying a Gaussian filtering 关Eq. 共4兲兴. Smoother and more blurred breast slices can be generated with higher standard deviation 共兲. This operation is applied for each slice of the breast matrix and may be extended to a 3D case; however, this will not have a significant influence of the final result.
=
再
w/2
冉
共共y + j兲2 + 共z + k兲2兲 exp − 兺 兺 2 ⴱ 2 j=−w/2 k=−w/2
冊
,
共4兲
where the default size of the structuring element is w ⫻ w 共by default 3 ⫻ 3兲. Similar to the previous operations, the numerator of Eq. 共4兲 should be data extracted from the texture matrix obtained after dilation 共DM兲 or random walks 共RWM兲 in case low pass filtering or dilation is not performed. The mammographic texture matrix 共TM兲, obtained as a result of Eqs. 共1兲–共4兲, contains voxels with values in the range 0–1. These values are converted to linear attenuation coefficients for the specified incident photon energy E Medical Physics, Vol. 37, No. 11, November 2010
to obtain the final texture matrix 共FTM兲 using the following relationship: FTM共x,y,z兲 = 共gland共E兲 − adipose共E兲兲 ⴱ
共TM共x,y,z兲 − TMmin兲 共TMmax − TMmin兲
+ adipose共E兲, cm−1 ,
共5兲
where gland and adipose are the linear attenuation coefficients of the glandular and adipose tissues, while TMmin and TMmax are the minimum and maximum values of the whole TM matrix. The voxel values in FTM represent linear attenuation coefficients that may take any value from the linear attenuation coefficient of the adipose tissue to the linear attenuation coefficient of the glandular tissue. Finally, this FTM is mapped to the volume, defined by the breast external surface. The FTM together with the generated duct system, Cooper’s ligaments, breast abnormalities, lymphatic and blood vessels system, pectoralis muscle and skin compose the final breast matrix. Final tissue differentiation is accomplished using the following concept: The matrix voxel values of the final breast matrix that are linear attenuation coefficients are converted into Hounsfield units 共HUs兲 using the relationship
5608
Bliznakova et al.: Improved algorithm for producing realistic breast software phantoms
5608
TABLE I. Attenuation coefficients at 19 keV incident energy. In the same table, the lower and upper limits of the HUs for the simulated tissues are specified.
Tissue
Attenuation coefficient 共cm2 g−1兲
共g cm−3兲
Attenuation coefficient 共cm−1兲
Lower HU
Upper HU
Adipose tissue Glandular tissue Cooper ligaments Breast skin Lymph Pectoralis muscle Blood
0.630 0.772 0.772 0.732 0.935 0.926 0.934
0.95 1.02 1.02 1.09 1.03 1.05 1.06
0.5985 0.7874 0.7874 0.7979 0.9631 0.9723 0.9900
⫺500 ⫺250 ⫺250 ⫺49 31 61 71
⫺251 ⫺50 ⫺50 30 60 70 90
BreastMatrix共x,y,z兲 =
冉
冊
FTM共x,y,z兲 − 1 ⴱ 1000, water共E兲
HU, 共6兲
where water is the linear attenuation coefficient of the water for the incident energy E. This operation is applied for each voxel. The HU data are then divided into six materials groups with lower and higher HU limits specified in Table I. These limits were derived from calculations performed for each tissue in the simulated breast in the range 15–30 keV using Eq. 共6兲. II.B. Simulation of projection images
Projection
images
were synthesized using the Source-to-detector and sourceto-breast phantom entrance plane distances were set equal to 900 and 600 mm, respectively. These distances were chosen for comparison purposes with our previous study. Their choice was not critical since simulated imaging conditions were near ideal. The transport of monochromatic 19 keV beams was simulated through the breast phantoms using analytical relationships for x-ray matter interaction. An antiscatter grid was not included in the simulations. The atomic compositions of the simulated breast tissues are derived from data of the International Commission on Radiation Units and Measurements32 and the International Commission on Radiological Protection33 for the lymphatic system. The attenuation coefficients of the modeled tissues were taken from Hubbell and Seltzer34 and are summarized in Table I. A stationary detector was simulated as a photon counting detector with a resolution of 10 pixels/mm, while the synthetic images, with size of 1200⫻ 1200 pixels, corresponded to craniocaudal 共CC兲 or mediolateral 共MLO兲 views. For all simulations, the incident air kerma at the surface of the breast models was set to 7 mGy. The photon fluence was calculated according to the relationship 31
XRAYIMAGINGSIMULATOR.
Kc,air =
冋 册 en
· E · ⌽,
共7兲
air
where Kc,air is the incident air kerma, E is the energy of the incident photons, ⌽ is the photon fluence, and 关en / 兴air is the mass energy absorption coefficients for air, taken from Hubbell and Seltzer.34 Medical Physics, Vol. 37, No. 11, November 2010
Poisson quantum noise was also added to the original ideal images, using a Gaussian random number generator, with a variance set equal to the mean number of the photons that strike each detector pixel. II.C. Implementation
The software application called BREASTSIMULATOR runs under both Microsoft Windows and Linux operating systems. In order to generate higher resolution matrices, the 64-bit editions must be used. Moreover, in order to increase the speed of breast simulation, the code was parallelized on a Linux cluster using the message passing interface for interprocessor communication implemented through MPICH2.35 Large and medium breast size phantoms are generated with the parallel code. For this purpose, a Dell dual-quad-core workstation with 32 GB RAM and seven slave processors was used. III. EVALUATION The new approach for breast model generation was evaluated subjectively and quantitatively. For this evaluation, a database with regions of interest 共ROIs兲 extracted from synthetic and real mammograms was created. III.A. Database
III.A.1. Clinical images Two sources of clinical data were used to collect real images. Initially, 30 images, digitized at 200 m pixel size, were chosen from the MIAS Mini Database36 that contains images of compressed and uncompressed breasts. The selected 30 images are mammograms taken from women with ten fatty, ten glandular, and ten dense breasts. The breast tissue density classification has been decided by experienced radiologists for each image contained in this database and is included in the readme file. Thirty ROIs with size of 256 ⫻ 256 pixels were extracted from the central part of these mammograms and placed in the database. In addition, digital mammograms of women who had routine screening mammographic examination in Greece were used retrospectively. The images, acquired with GE Senograph 2000D full-field digital detector, were “processed” images obtained at 12-bit per pixel and a pixel pitch of 100 m. One hundred mam-
5609
Bliznakova et al.: Improved algorithm for producing realistic breast software phantoms
FIG. 3. Example of defining ROIs on a mammogram.
mograms taken from 25 patients were used to extract the ROIs for evaluation. Three to four ROIs per image were selected depending on the size of the breast. The size of the ROI was chosen 400⫻ 400 pixels based on literature review.37,38 From these, 300 ROIs, 120 were free of breast abnormities and placed in the database for the purposes of this study. Forty of these ROIs were extracted from mammograms of breasts that were characterized by the radiologists as dense breasts while the rest encompass the fatty and fattyglandular breast density. An example of selection of ROIs from a clinical mammogram is shown in Fig. 3. III.A.2. Synthetic images In order to create a database with synthetic images, several breast phantoms were designed to represent woman breasts with different glandularity. This was calculated by taking into account the percent of the glandular voxels in the
5609
central area of the breast phantom. The creation of fatty, glandular, or dense breasts was influenced by the various combination of the values of the following modeling parameters: The number of walks 共Nwalks兲, the number of steps per walk 共Nsteps兲, the Hurst exponent 共H兲, the increment 共h兲, the number of Cooper elements, and the ducts density. In order to find the range of values assigned to each of these parameters, an extensive simulation work with the new algorithm has been carried out. These simulations included the synthesis of replicating small, medium, and large simulated breast models with different parameters in order to define the set of values of each of these parameters corresponding to the creation of models with different dimension and glandularity. Default values for the creation of various breasts with different density and corresponding dimensions are summarized in Table II. The voxel dimension of the synthesized breast models varied from 0.1 to 0.15 mm, as the former was assigned to small and medium breasts, while the second voxel size was used for large breast models. The breast dimensions correspond to that of the elongated semiellipsoid. Thirty breast phantoms 共ten large, ten medium, and ten small兲 with no pathology included were selected. Simulated projection images of these breast phantoms were obtained at CC and MLO view. Quantum noise was added according to Sec. II B. Examples of simulated mammographic images of fatty, glandular and dense breasts are shown in Fig. 4. In this figure, 共a兲–共d兲 show mammograms of simulated fatty, 共e兲–共i兲 glandular, and 共j兲–共l兲 dense breast models. In images a, b, d, e, f, h, i, and l, parts of the duct tree can be observed, while in 共c兲 and 共l兲, simulated blood and lymph vessels are visible. One hundred twenty ROIs were extracted from these simulated images and placed in the database. The ROIs corresponded to a rectangular area of 400 pixels, located in different areas of the mammograms, similar to the clinical case.
III.B. Subjective evaluation
In the qualitative approach, four radiologists 共two from Greece and two from the United States兲 each with more than 10 yr experience in the field of clinical mammography examination participated. The purpose of this evaluation was to evaluate the realism of the synthetic mammograms obtained from the improved breast model in comparison to mammograms simulated for the evaluation of the previous approach.
TABLE II. Default values for the creation of breast models of different glandularity and dimensions. F: Fatty breast; G: Glandular breast; D: Dense breast matrix size is in three dimensions.
Matrix size
Nwalk
Nsteps
h
H
Breast density
700 1000 1000 1000 1200 1500 1500
1000 300–500 500–1000 5000 500–1000 1000 1000
共1 – 3兲 ⫻ 103 共1 – 3兲 ⫻ 104 共1 – 2兲 ⫻ 104 2 ⫻ 104 2 ⫻ 105 共1.5– 2兲 ⫻ 105 共1 – 1.5兲 ⫻ 105
0.1 0.1, 0.2 0.1 0.1 0.1 0.1 0.1
0.8 0.8, 0.9 0.9, 0.95 0.9 0.9 0.9 0.9
D F G D D G F
Medical Physics, Vol. 37, No. 11, November 2010
Breast size 共mm兲
Breast type
40⫻ 40⫻ 40
Small
50⫻ 50⫻ 80 70⫻ 70⫻ 100
Medium Large
5610
Bliznakova et al.: Improved algorithm for producing realistic breast software phantoms
(a)
(e)
(i)
(b)
(f)
(j)
(c)
(g)
(k)
5610
(d)
(a)
(b)
(c)
(d)
(e)
(f)
(h)
(l)
FIG. 4. Examples of simulated mammograms at CC and MLO view obtained from 关共a兲–共d兲兴 fatty breast models, 关共e兲–共i兲兴 models of glandular breasts, and 关共j兲 and 共l兲兴 dense breast models.
FIG. 5. Examples of simulated mammograms with 关共a兲–共c兲兴 the new and 关共d兲–共f兲兴 the old algorithm for 3D mammographic texture.
III.C.1. Skewness and kurtosis For this evaluation, 15 ROIs extracted from simulated mammograms obtained with the new methodology and 13 ROIs extracted from simulated mammograms obtained with the previous algorithm were mixed and placed in a PowerPoint presentation, with two ROIs per slide. A comparison of simulated images obtained with the new and previous methodology is shown in Fig. 5. The radiologists were asked to evaluate the realism of the simulated ROIs in terms of appearance with grades from 1 to 3. Grade 1 was used for images that are not realistic at all, grade 2 for images of medium realism, and grade 3 for images that look like real mammograms. The images were displayed in a dark room at the radiologists work. In one of the cases, a mammography viewing station was not available. Therefore, in order to conduct the subjective evaluation of the images under the similar conditions, a high quality flat panel PC screen was used. There was no restriction on the viewing time and distance to the screen.
These features characterize the shape and the asymmetry of the histograms showing the distribution of gray values of the pixels in the ROIs. The skewness and kurtosis are the third and the fourth moment distribution about the mean gray value of the pixels in the ROIs. For a ROI containing N pixels, the kth moment mk of the histogram is given by imax
mk =
关hi共i − imean兲k兴 兺 i=0 N
,
k ⬎ 1,
共8兲
imax hi, hi is the number of pixels at gray level i, where N = 兺i=0 imax and imean = 兺i=0 共ihi / N兲 is the mean gray value of the distribution. The normalized third and fourth moments are given by
III.C. Objective evaluation
The quantitative evaluation of the breast model included comparison of four texture features extracted from simulated and real ROIs: Histogram skewness and kurtosis, the exponential parameter  of the power law spectrum, and fractal dimension. Figure 6 shows examples of ROIs extracted from real 共upper row兲 and simulated 共lower row兲 mammograms. All simulated and real ROIs were involved in this study. Medical Physics, Vol. 37, No. 11, November 2010
(a)
(b)
(c)
(d)
(e)
(f)
(g)
(h)
(i)
(j)
(k)
(l)
FIG. 6. Examples of 关共a兲–共f兲兴 real and 关共g兲–共l兲兴 simulated ROIs used in the evaluation.
5611
S=
Bliznakova et al.: Improved algorithm for producing realistic breast software phantoms
m3 m3/2 2
K=
m4 . m4/2 2
共9兲
III.C.2. Power law spectral analysis
冋 冉
M−1 N−1
1 兺 MN a=0
Reviewer 2 Reviewer 3 Reviewer 4
ROIs
Grade 1
Grade 2
Grade 3
New Old New Old New Old New Old
3 12 5 12 1 13 1 8
8 1 10 1 5 0 8 4
4 0 0 0 9 0 6 1
共10兲
P共f兲 = 兩F共k,l兲兩2 , F共k,l兲 =
TABLE III. Results from the radiologists’ evaluation. A three grade scale is used in the evaluation. Grade 1: Images are not realistic at all, grade 2: Images of medium realism, and grade 3: Images look like real mammograms.
Reviewer 1
The power law spectral analysis is based on the power spectrum of real and simulated ROIs. The power spectrum of the ROIs was calculated by integrating the power spectrum density over concentric rings in the 2D frequency plane using the method developed by Heine and Velthuizen.39 The power spectrum 共P共f兲 = B / f ß兲 of an image f共a , b兲 is computed from the discrete Fourier transform
5611
兺 f共a,b兲exp b=0
k = 0,1, . . . ,M − 1
− 2i
ka lb + M N
l = 0,1, . . . N − 1,
冊册
exponent from the power spectrum analysis using the following relationship:42,43
, 共11兲
where k and l are the spatial frequencies in the two directions and M ⫻ N is the image size of f共a , b兲. The concentric rings represent an octave sectioning of the frequency plane. The ring width is half the width of the adjacent ring that covers higher frequency information, as the first octave corresponds to the highest frequency ring. The highest frequency is the Nyquist one. The total power spectrum per concentric ring is further transformed to log2 共total power spectrum兲 and plotted versus the octave number. The plot is almost linear and the data are fitted to a line obtained using linear regression analysis. The slop of the line m is related to exponential parameter  as following: m =  − 2.
8− . 2
共13兲
This method has proved to be accurate and effective across different imaging modalities.44 For comparison purposes with other studies, the fractal dimension was evaluated as well with the conventional boxcounting technique45 described in detail in the Appendix. Five pixel sizes 共兲 were synthesized by averaging the pixels gray levels in squares of 1 ⫻ 1, 2 ⫻ 2, 4 ⫻ 4, 8 ⫻ 8, and 16 ⫻ 16 adjacent pixels. The exposed surface A共兲 was then calculated as described in the Appendix and the fractal dimension was computed from the plot of the log共A共兲兲 versus log共兲.
共12兲
Therefore, this approach of calculating  was preferred to the one that uses equally spaced rings and results in non linear plots. In this study, the number of the concentric rings was five. For example, in case of mammograms with pixel resolution of 0.1 mm, the width of the rings corresponded to 共2.5–5兲, 共1.25–2.5兲, 共0.625–1.25兲, 共0.312–0.625兲, and 共0.156–0.312兲 cycles/mm. The region around the zero frequency 共0–0.156兲 was excluded in the analysis in order to avoid any influence due to the dc component of the power spectrum that usually varies from image to image and depending on the x-ray imaging system used for image acquisition. Before applying Fourier methods to the ROIs, data windowing with a Hanning window was performed.
III.C.3. Fractal dimension The fractal dimension 共FD兲 indicates how rough a surface is. There are several methods to measure the fractal dimension of an image such as variance method and box-counting technique, methods based on fast Fourier transform, thus producing a different estimate of the fractal dimension.40,41 In this study, the fractal dimension was deducted from the  Medical Physics, Vol. 37, No. 11, November 2010
FD =
IV. RESULTS IV.A. Subjective evaluation
The results of the subjective evaluation are summarized in Table III. More than half of the synthetic mammograms obtained with the previous methodology obtained grade 1 by radiologists. The evaluators observed that all images simulated with the old algorithm were blurred and therefore not realistic. There were few images synthesized with the improved algorithm that were rated with grade 1. These cases were commented by the radiologists as having either a high contrast 关as, for example, the ROIs shown in Figs. 6共i兲–6共k兲兴 or wrong anatomy 关Fig. 4共d兲兴. In addition, the radiologists evaluated the whole synthetic mammograms obtained with the two approaches and shared their observation for the realism of the mammograms. Similar to the evaluation of the ROIs, all simulated projections obtained from breast models created with the previous approach were not realistic. Radiologists remarked that simulated projection images obtained with the new algorithm are featured with improved image quality and realistic mammographic texture and concluded that efforts should be directed toward improvements of the mammographic appearance at the edges of the breast model.
5612
Bliznakova et al.: Improved algorithm for producing realistic breast software phantoms
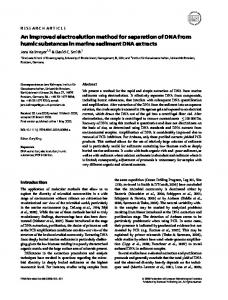
(a) ROI from simulated mammogram:
(b) ROI from digital mammogram:
(c) ROI from mdb007:
β = 2.82, R = 0.98, FD = 0.59, S = 0.37, K = 2.42
β = 2.81, R= 0.98,
β = 2.99,
5612
R = 0.99,
FD = 2.60, S = 0.44,
FD = 2.51,
S = 0.07,
K = 2.30
K = 2.71
FIG. 7. 共a兲 Examples of ROIs and their corresponding calculated  exponent, skewness 共s兲, kurtosis 共k兲, and fractal dimension 共FD兲 from a simulated image; a clinical mammogram obtained with 共b兲 GE Senograph 2000D and 共c兲 taken form MIAS Mini Database mdb007.
IV.B. Objective evaluation
The exponential parameter  of the power law spectrum, the fractal dimension, skewness, and kurtosis were computed for each simulated and real ROI. An example of feature evaluation is depicted in Fig. 7, which shows a comparison Medical Physics, Vol. 37, No. 11, November 2010
between calculated features for ROIs, extracted from simulated 关Fig. 7共a兲兴 and clinical 关Figs. 7共b兲 and 7共c兲兴 mammograms of glandular breasts. The linear trends for the  exponent and histogram distributions for the skewness were compared in Figs. 7共a兲–7共c兲 共the second and third column兲.
5613
Bliznakova et al.: Improved algorithm for producing realistic breast software phantoms
5613
TABLE IV. Results from the quantitative evaluation and comparison with results from literature. Fractal dimension Real Bliznakova et al.a Li et al.c
2.36⫾ 0.10 b 共2.30, 3.00兲d
Li et al.e Li et al.f Bakic et al.g Heine and Velthuizenh Georgsson et al.i Byng et al.j Caldwell et al.k Bochud et al.l Castella et al.m Heine et al.n Turasi et al.o Kontos et al.p This study
共2.3, 2.93兲b 共2.50, 2.93兲b 2.32⫾ 0.10
Skewness
Simulated 2.39⫾ 0.10
b
Real
Simulated
0.02⫾ 0.17
0.06⫾ 0.15
Kurtosis Real
Simulated
Power Spectrum Real
Simulated
2.47⫾ 0.20 2.92⫾ 0.28 共⫺2.0, 2.0兲 2.36⫾ 0.10 2.76⫾ 0.12
共2.34, 2.70兲b 共2.23, 2.54兲b 共2.20, 2.50兲b
共⫺0.30, 0.20兲 −0.10⫾ 0.80
0.10⫾ 0.40
2.50⫾ 1.00
2.60⫾ 0.40 3.02⫾ 0.02 2.94⫾ 0.10
2.71⫾ 0.08 d 共2.45, 2.8兲d 2.51⫾ 0.03d,q 2.62⫾ 0.04d,r 2.54⫾ 0.12b,q 2.67⫾ 0.11b,r
2.55⫾ 0.07d 2.59⫾ 0.18b
−0.22⫾ 0.64q 0.23⫾ 0.49r
0.03⫾ 0.33
3.33⫾ 1.36q 3.41⫾ 0.90r
2.75⫾ 0.48
2.96⫾ 0.05q 2.78⫾ 0.07r
共3.40, 4.0兲 2.92⫾ 0.01
2.90⫾ 0.08
a
j
b
k
Overall, similar linear trends of the log2 共total power spectrum兲 versus the octave number,  exponents and histogram distributions are observed for the ROIs extracted from real and simulated images. The overall quantitative evaluation of simulated images against calculations performed on real images is summarized in Table IV. In the same table, data published in the literature are presented as well. Further, the distributions of the  values calculated from the power spectrum analysis for ROIs extracted from simulated and real mammograms are presented in Figs. 8共a兲–8共c兲 共the first column兲. The mean value and standard deviation for the entire set of simulated images is 具典 = 2.90⫾ 0.08 关Fig. 8共a兲兴, while the mean value and standard deviation, calculated for ROIs extracted from real mammograms acquired with GE Senograph and taken from MIAS MiniDatabase is 具典 = 2.78⫾ 0.07 关Fig. 8共b兲兴 and 具典 = 2.96⫾ 0.05 关Fig. 8共c兲兴, respectively. Additionally, for each image, the correlation coefficient 共R兲 for the least square fit between the log2 共total power spectrum兲 and the octave number was calculated. Histogram distributions of these correlation coefficients for simulated and clinical images are shown in the same figure 共the second column兲. In case of simulated images, the average correlation coefficient is 具R典 = 0.982⫾ 0.009, while for ROIs extracted from mammograms acquired with GE Senograph and taken from MIAS MiniDatabase, this coefficient
corresponds to 具R典 = 0.975⫾ 0.011 and 具R典 = 0.983⫾ 0.001, respectively. Overall, a good agreement between  value for simulated and real data is observed, while the correlation coefficient for all linear fits is higher than 0.975. The results of the power law spectral analysis are also in good agreement compared to the published data by Castella et al.46 for real and simulated images and studies with real images.37,39,47 These results differ from those reported by Bochud et al.48 that are higher compared to the results of this and other published studies. This is attributed to the use of constant ring width approach and that the authors used the linear part of the fit to estimate the  value. The power spectrum analysis was used to calculate the fractal dimensions of simulated and real ROIs. The mean value and the standard deviation of calculated fractal dimension of simulated images 共具FD典 = 2.55⫾ 0.07兲 is in the range of the calculated fractal dimensions obtained for the two real sets of mammograms 具FD典 = 2.51⫾ 0.03 and 具FD典 = 2.62⫾ 0.04, respectively, for the MIAS Mini Database and digital mammograms. Fractal dimension was also calculated with the box-counting technique, showing a good agreement between calculated fractal dimension of simulated 共具FD典 = 2.59⫾ 0.18兲 and clinical images 共具FD典 = 2.54⫾ 0.12 and 具FD典 = 2.67⫾ 0.11兲. In addition, the calculated average fractal dimension for simulated images is in agreement with pub-
Reference 17. Fractal dimension calculated with box-counting technique. c Reference 37. d Fractal dimension calculated with power spectral analysis. e Reference 49. f Reference 50. g Reference 53. h Reference 39. i Reference 51.
Medical Physics, Vol. 37, No. 11, November 2010
Reference 52. Reference 45. l Reference 48. m Reference 46. n Reference 47. o Reference 44. p Reference 25. q Results for mammograms from MIAS MiniDatabase. r Results for digital mammograms.
5614
Bliznakova et al.: Improved algorithm for producing realistic breast software phantoms
5614
(a) simulated 60
35
50
40
15
Frequency
20
30 20
30 25 20
30
20
15
10
10
10
5
40
35
40 Frequency
Frequency
30 25
50
45
50
Frequency
40
10
5
0 2.7
2.8
2.9
Beta
3
3.1
0 0.94
3.2
0.95
0.96 0.97 0.98 Correlation Coefficient, R
0.99
0 -2
1
-1.5
-1
-0.5
0 0.5 Skewness
1
1.5
2
0 0
1
2
3 Kurtosis
50
40
40
30
20
10
10
2.7
2.8
Beta
2.9
3
0 3.1 0.93
4
5
6
80 70
40
30
20
0 2.6
50
60
30
Frequency
60
50
Frequency
60
Frequency
Frequency
(b) digital mammograms
20
50 40 30 20
10
10 0.94
0.95 0.96 0.97 0.98 Correlation Coefficient, R
0.99
1
0 -2
-1.5
-1
-0.5
0 0.5 Skewness
1
1.5
2
0 0
2
4
2
4
Kurtosis
6
8
10
6
8
10
(c) MIAS MiniDatabase 6
10
10
8
4
8
4 3
6
Frequency
6
Frequency
Frequency
Frequency
12
5
8
4
2
1 2.9
2.95
Beta
3
3.05
0 3.1 0.975
6 4
2
2 0 2.85
10
7
12
0.98 0.985 Correlation Coefficient, R
0.99
2
0 -2
-1.5
-1
-0.5
0 0.5 Skewness
1
1.5
2
0 0
Kurtosis
FIG. 8. Distribution of 具典 values, correlation coefficients 具R典 from the linear regression analysis, as well as distribution of skewness and kurtosis for ROIs extracted from 共a兲 simulated images and real mammograms taken from 共b兲 a private patient database and 共c兲 MIAS MiniDatabase.
lished calculations performed on real images using the power spectrum and the box-counting techniques.25,37,49–51 Other published results for the fractal dimension differ slightly from the results of this study.17,44,45,52,53 The calculations for the histogram skewness 共0.03⫾ 0.33兲 are also in the range of the results obtained for clinical images used in this study 共0.23⫾ 0.49 and −0.22⫾ 0.64 for digital mammograms and mammograms taken from the MIAS Mini Database兲. The histograms of the calculated skewness values are shown in Figs. 8共a兲–8共c兲 共the third column兲. Skewness values calculated for clinical images have a wider range of fluctuations compared to simulated images, a fact that has been observed by Bochud et al.48 Good agreement is observed with data published by the same author48 for both simulated and real ROIs 共0.10⫾ 0.40 and −0.10⫾ 0.80兲, as well as with the data provided by Li et al.49 and Byng et al.52 for real images. The histograms of the calculated kurtosis are shown in the last column in Figs. 8共a兲–8共c兲. Similar to the skewness, the kurtosis has more variations in the clinical images compared to simulated images. Data for histogram kurtosis from similar calculations performed by Bochud et al.48 agree well with our calculations. Finally, a two-sample t-test was performed between the results for skewness, kurtosis, and fractal dimension using the new and previous methodology for creation of breast models to identify the difference between the two set of Medical Physics, Vol. 37, No. 11, November 2010
simulated images. Results show that the Pearson’s correlation coefficient 共the p value兲 for the skewness and the fractal dimension was much less than 0.001, while for kurtosis, the p value corresponded to 0.4. V. DISCUSSION The new methodology for generation of 3D mammographic texture, and therefore the 3D breast phantom synthesis, is more flexible compared to the previous methodology and allows the generation of breast models with various glandularity. This algorithm also contributes significantly to the generation of synthetic mammograms that visually and quantitatively approach the real ones. The observer study by radiologists confirmed that the new algorithm for mammographic texture is superior compared to the previous approach. The subjective evaluation of the entire set of synthetic mammographic images suggested that efforts should be directed toward improvements of the mammographic appearance at the edges of the breast model for superior realism. The quantitative analysis suggests that the new methodology generates improved breast models and the texture characteristics obtained from the simulated mammograms are close to those calculated on real mammograms. The results from the two-sample t-test indicated that the new algorithm differs significantly from the previous approach. Generally,
5615
Bliznakova et al.: Improved algorithm for producing realistic breast software phantoms
there is a good coincidence between calculations performed in this study and published data as well.25,37–39,41,46–52 The comparison of extracted texture features from real and simulated mammograms shows that simulated results are between the calculated values for the two real mammogram sets. For example, the power spectrum analysis showed that the average  exponent for simulated images is higher than the average  exponent calculated for real images acquired with GE Senograph 2000D. This is attributed to the presence of noise in the real images coming from the scattered radiation and detector characteristics. From the other side, the average  exponent for simulated images is lower than the one calculated for real images from MIAS Mini Database. This is explained with the resolution of the images. Simulated images are generated with higher resolution and images with higher resolution exhibit slightly higher fractal dimension than those characterized by lower resolution due to the influence of small details. Difference between various fractal dimensions published in the literature are eventually due to the use of different approach in the calculation of this parameter 共for example, the use of variance techniques53兲, the image acquisition system, the mammographic view at which images are acquired, or the limited number of images used in the study.17,44,45,52 Results for the skewness calculated from simulated images are between the calculated skewness from clinical data from the two different sources. The data from the MDB were acquired from ten fatty, ten glandular, and ten dense breasts. Regions of interest with more dense and glandular tissue yield negative skewness as calculated from Eqs. 共8兲 and 共9兲, while ROIs with more fatty breast tissue are characterized with positive skewness values. Therefore, the skewness values obtained from images taken from MIAS Mini Database are negative. In case of digital mammograms, the ROIs contained predominantly fatty and fatty-glandular tissue; therefore, the mean value for the skewness is positive. From the other hand, the almost zero mean value of the skewness calculated for simulated images indicates equally distributed fatty and dense mammographic densities from the selected ROIs. There are several applications where BREASTSIMULATOR can be successfully used, including digital breast tomosynthesis, breast cone beam computed tomography, and subtraction mammography to mention but a few. However, there are still several issues that require further development and adjustment in order to achieve better results and these mainly concern the x-ray image simulation chain. For the purposes of improving and testing the algorithm for creation of 3D breast models, the simulated mammograms were obtained with monochromatic incident beams, ideal detector, and simulation of primary radiation only. These are therefore the main limitations of the conducted study and were prompted by the large size of the breast matrices. Simulation of Cooper ligaments and other fine breast tissue structures require the use of large matrices with a voxel size in the order of 50 m. This will guarantee their visualization in the mammograms and will contribute considerably to the synthesis of more realistic mammographic images. Due to the large size Medical Physics, Vol. 37, No. 11, November 2010
5615
of these matrices, the use of Monte Carlo techniques to simulate in detail the x-ray interactions in the breast models is not efficient. Further on, modeling of detector characteristics and propagation of x rays in the detector would further complicate the current work, which at this stage is addressing the improvement and test of the proposed algorithm. For the purposes of this work, the analytical method for image simulation31 is fast and flexible and therefore convenient for accomplishing the tests and optimization operations. Undoubtedly, the simulation of x-ray interactions in the whole imaging chain 共x-ray source, breast model, and detector兲 will result to the inclusion of noise mainly in the form of x rays scattered in the breast model and detector noise. This may further improve the realism of the simulated images and influence slightly the qualitative and quantitative evaluations. In the latter case, it is expected that the inclusion of scattered radiation from the breast model and the introduction of the detector model will result in lower  values 共and therefore higher values for the fractal dimension as in real images39,41 and will better match the computed texture features with digital mammograms. The improved algorithm for creation of breast models is currently used in a feasibility study that aims to compare the performance of three novel detectors for digital mammography. In this study, a Monte Carlo code54 is exploited to simulate x-ray interactions in the breast models and in the detectors. In addition, clinical conditions are simulated taking into account acquisition geometry and typical mammography x-ray spectra. These additional studies will further improve the computer models of the female breast and x-ray imaging chain and will establish the practical importance of this software model in carrying out feasibility studies in the field of breast x-ray imaging. VI. CONCLUSIONS This paper described an improved methodology for generating realistic computer generated breast phantoms and its extensive evaluation for research purposes in mammography. The observer study with radiologists as observers and the feature measures suggest that the algorithm for creation of 3D breast models has been improved in terms of simulation of female breast models with improved realism. The use of these models with x-ray imaging simulation contributes to the simulation of mammograms with improved realism. The application of such anthropomorphic phantoms that closely resemble the breast anatomy and reflects the radiographic properties of the breast tissue may be suitable for the design and evaluation of new digital mammography systems and with further adaptations potentially for tomosynthesis and dedicated breast computed tomography systems. ACKNOWLEDGMENTS The contributions by Sankar Suryanarayanan and Andrew Karellas were supported in part by the National Institutes of Health 共NIH兲 Grant No. R01-EB002123, Grant No. R01EB004015 from the National Institute of Biomedical Imag-
5616
Bliznakova et al.: Improved algorithm for producing realistic breast software phantoms
5616
ing and Bioengineering 共NIBIB兲, and from the Georgia Cancer Coalition. The contents are solely the responsibility of the authors and do not necessarily represent the official views of the NIH, NIBIB, or the Georgia Cancer Coalition. The authors would like also to thank Dr. George Karatzas for providing mammograms of women who underwent routine screening mammographic examination in Greece and his fruitful suggestions and comments.
height equal to the pixel’s gray value, thus obtaining a collection of adjacent “skyscrapers.” The area of the surface is obtained by sum of the area of the roofs plus the sum of the areas of the exposed lateral sides of the skyscrapers
APPENDIX: FRACTAL ANALYSIS OF IMAGES
where I共x , y兲 is the height of a “column,” found for a particular value of by averaging the values stored in adjacent image array elements to produce pixels with a side length of . The area A共兲 is recalculated for different sizes of by averaging adjacent pixels together in order to obtain new images with varying pixel size . The fractal dimension D is then related to the slope of a plot of log兵A共兲其 versus log兵其.
I. Fractional Brownian motion fBm, introduced by Mandelbrot in 1977,55 is a generalization of the classical Brownian motion that is also called a random walk. Shortly described, the fBm model regards naturally occurring rough surfaces as the end results of random walks and utilizes a random iteration algorithm to produce fractal patterns.56 In fBm, the change or increment from one moment to the next is random and normally distributed, so the present is not correlated with the past. A single parameter H 苸 共0 , 1兲, called Hurst exponent, characterizes fBm. A fBm is a stochastic process X共t兲 having increments X共t + h兲 − X共t兲 that are normally distributed with mean zero and standard deviation = hH, i.e., the mean and the variance are 具X共t + h兲 − X共t兲典 = 0, 具关X共t + h兲 − X共t兲兴2典 ⬇ 兩t + h − t兩2H .
共A1兲
t + h and t are two arbitrary points in the space. The Hurst exponent is related to the fractal dimension of a fractal object and provides an indication of how rough a surface is and is given with the following relationship: FD = 2 − H.
共A2兲
A small Hurst exponent is related to a higher fractal dimension and a rougher surface. A larger Hurst exponent is related to a smaller fractional dimension and a smoother surface. Various models of fBm simulation have been reported in the literature such as Poison faulting, Fourier spectrum, midpoint displacement, successive random additions, and summing band-limited noises. The approach we followed to generate fBm is related to an algorithm called successive random additions. This approach has four basic advantages: Simplicity, flexibility 共for implementation and control兲, easy user understanding, and easy to implement. II. Fractal Analysis The fractal dimension of image surface can be calculated as A共兲 = 2−D ,
共A3兲
where A共兲 is the area of the surface measured with a square of side , is a scaling constant, and D is the surface’s fractal dimension. The area A共兲 is calculated using the technique suggested by Caldwell et al.45 Each pixel in the twodimensional image is considered as a skyscraper with the length and width equal to the pixel dimensions and the Medical Physics, Vol. 37, No. 11, November 2010
A共兲 = 兺 2 + 兺 兵兩I共x,y兲 − I共x + 1,y兲兩 x,y
x,y
+ 兩I共x,y兲 − I共x,y + 1兲兩其,
a兲
共A4兲
Author to whom correspondence should be addressed. Electronic mail:
[email protected]; Telephone: ⫹30-2610-996112; Fax: ⫹30-2610992496. b兲 Present address: Philips Healthcare, Andover, Massachusetts 01810. c兲 Present address: Department of Radiology, University of Massachusetts Medical School, Worcester, Massachusetts. 1 A. H. Olsen et al., “Breast cancer mortality in Copenhagen after introduction of mammography screening: Cohort study,” BMJ 330, 220–222 共2005兲. 2 D. A. Berry et al., “Effect of screening and adjuvant therapy on mortality from breast cancer,” N. Engl. J. Med. 353, 1784–1792 共2005兲. 3 S. Akashi-Tanaka, T. Shien, S. Tsukagoshi, S. Funabasama, K. Miyagawa, K. Terada, M. Yoshida, T. Hojo, T. Kinoshita, and N. Moriyama, “Whole-breast volume perfusion images using 256-row multislice computed tomography: Visualization of lesions with ductal spread,” Breast Cancer Res. Treat. 16, 62–67 共2009兲. 4 L. T. Niklason et al., “Digital tomosynthesis in breast imaging,” Radiology 205, 399–406 共1997兲. 5 B. Chen and R. Ning, “Cone-beam volume CT breast imaging: Feasibility study,” Med. Phys. 29, 755–770 共2002兲. 6 D. R. Dance, “Monte Carlo calculation of conversion factors for the estimation of mean glandular breast dose,” Phys. Med. Biol. 35, 1211–1219 共1990兲. 7 D. R. Dance, C. L. Skinner, and G. A. Carlsson, “Breast dosimetry,” Appl. Radiat. Isot. 50, 185–203 共1999兲. 8 J. M. Boone, T. R. Nelson, K. K. Lindfors, and J. A. Seibert, “Dedicated breast CT: Radiation dose and image quality evaluation,” Radiology 221, 657–667 共2001兲. 9 G. Ullman, M. Sandborg, D. R. Dance, M. Yaffe, and G. A. Carlsson, “A search for optimal x-ray spectra in iodine contrast media mammography,” Phys. Med. Biol. 50, 3143–3152 共2005兲. 10 I. Sechopoulos, S. Suryanarayanan, S. Vedantham, C. D’Orsi, and A. Karellas, “Computation of the glandular radiation dose in digital tomosynthesis of the breast,” Med. Phys. 34, 221–232 共2007兲. 11 J. L. Ducote and S. Molloia, “Quantification of breast density with dual energy mammography: A simulation study,” Med. Phys. 35, 5411–5418 共2008兲. 12 I. Sechopoulos, S. Vedantham, S. Suryanarayanan, C. D’Orsi, and A. Karellas, “Monte Carlo and phantom study of the radiation dose to the body from dedicated CT of the breast,” Radiology 247, 98–105 共2008兲. 13 G. R. Hammerstein, D. W. Miller, D. R. White, M. E. Masterson, H. Q. Woodard, and J. S. Laughlin, “Absorbed radiation dose in mammography,” Radiology 130, 485–491 共1979兲. 14 X. Gong, S. J. Glick, B. Liu, A. A. Vedula, and S. Thacker, “A computer simulation study comparing lesion detection accuracy with digital mammography, breast tomosynthesis, and cone-beam CT breast imaging,” Med. Phys. 33, 1041–1052 共2006兲. 15 I. Sechopoulos and C. Ghetti, “Optimization of the acquisition geometry in digital tomosynthesis of the breast,” Med. Phys. 36, 1199–1207 共2009兲. 16 P. R. Bakic, M. Albert, D. Brzakovic, and A. D. Maidment, “Mammogram synthesis using a 3D simulation. I. Breast tissue model and image acquisition simulation,” Med. Phys. 29, 2131–2139 共2002兲.
5617
Bliznakova et al.: Improved algorithm for producing realistic breast software phantoms
17
K. Bliznakova, Z. Bliznakov, V. Bravou, Z. Kolitsi, and N. Pallikarakis, “A three-dimensional breast software phantom for mammography simulation,” Phys. Med. Biol. 48, 3699–3721 共2003兲. 18 A. K. Ma, S. Gunn, and D. G. Darambara, “Introducing DeBRa: A detailed breast model for radiological studies,” Phys. Med. Biol. 54, 4533– 4545 共2009兲. 19 L. Zhou, J. Oldan, P. Fisher, and G. Gindi, “Low contrast lesion detection in tomosynthetic breast imaging using a realistic breast phantom,” in Proceedings of SPIE Medical Imaging Conference, 2006, Vol. 6142, pp. 61425A. 20 K. Bliznakova, Z. Kolitsi, and N. Pallikarakis, “Dual-energy mammography: Simulation studies,” Phys. Med. Biol. 51, 4497–4515 共2006兲. 21 D. R. Dance, R. Hunt, P. R. Bakic, A. D. Maidment, M. Sandborg, G. Ullman, and G. Alm Carlsson, “Breast dosimetry using high-resolution voxel phantoms,” Radiat. Prot. Dosim. 114, 359–363 共2005兲. 22 F. J. Richard, P. R. Bakic, and A. D. Maidment, “Mammogram registration: A phantom-based evaluation of compressed breast thickness variation effects,” IEEE Trans. Med. Imaging 25, 188–197 共2006兲. 23 R. A. Hunt, D. R. Dance, P. R. Bakic, A. D. Maidment, M. Sandborg, G. Ullman, and G. A. Carlsson, “Calculation of the properties of digital mammograms using a computer simulation,” Radiat. Prot. Dosim. 114, 395–398 共2005兲. 24 D. Kontos, C. Zhang, N. V. Ruiter, P. R. Bakic, and A. D. Maidment, “Evaluating the effect of tomosynthesis acquisition parameters on image texture: A study based on an anthropomorphic breast tissue software model,” in Proceedings of the International Workshop on Digital Mammography 共IWDM 2008兲, 2008, pp. 491–498. 25 D. Kontos, P. R. Bakic, A. K. Carton, A. B. Troxel, E. F. Conant, and A. D. Maidment, “Parenchymal texture analysis in digital breast tomosynthesis for breast cancer risk estimation: A preliminary study,” Acad. Radiol. 16, 283–298 共2009兲. 26 R. Highnam, M. Brady, and B. Shepstone, “A representation for mammographic image processing,” Med. Image Anal. 1, 1–18 共1996兲. 27 D. R. Dance, “The Monte Carlo calculation of integral radiation dose in xeromammography,” Phys. Med. Biol. 25, 25–37 共1980兲. 28 D. E. Peplow and K. Verghese, “Digital mammography image simulation using Monte Carlo,” Med. Phys. 27, 568–579 共2000兲. 29 Ch. Zyganitidis, K. Bliznakova, and N. Pallikarakis, “A novel simulation algorithm for soft tissue compression,” Med. Biol. Eng. Comput. 45, 661– 669 共2007兲. 30 A. E. Burgess, F. Jacobson, and P. F. Judy, “Human observer detection experiments with mammograms and power-law noise,” Med. Phys. 28, 419–437 共2001兲. 31 D. Lazos, Z. Kolitsi, and N. Pallikarakis, “A software data generator for radiographic imaging investigations,” IEEE Trans. Inf. Technol. Biomed. 4, 76–79 共2000兲. 32 International Commission on Radiation Units and Measurements, “Tissue Substitutes in Radiation Dosimetry and Measurement,” ICRU Report No. 44, 1989. 33 International Commission on Radiological Protection, “Report of the Task Group on Reference Man,” ICRP Publication No. 23 共Pergamon, Oxford, 1975兲. 34 J. H. Hubbell and S. M. Seltzer, “Tables of x-ray mass attenuation coefficients and mass energy-absorption coefficients 1 keV to 20 MeV for elements Z = 1 to 92 and 48 additional substances of dosimetric interest,” NIST Report No. 5632, 1995. 35 http://www-unix.mcs.anl.gov/mpi/mpich2/ 共accessed 28 March 2007兲. 36 J. Suckling et al., The Mammographic Image Analysis Society Digital Mammogram Database, Exerpta Medica International Congress Series 1069, 375–378 共1994兲.
Medical Physics, Vol. 37, No. 11, November 2010
37
5617
H. Li, M. L. Giger, O. I. Olopade, and M. R. Chinander, “Power spectral analysis of mammographic parenchymal patterns for breast cancer risk assessment,” J. Digit Imaging 21, 145–152 共2008兲. 38 H. Li, M. L. Giger, Z. Huo, O. I. Olopade, L. Lan, B. L. Weber, and I. Bonta, “Computerized analysis of mammographic parenchymal patterns for assessing breast cancer risk: Effect of ROI size and location,” Med. Phys. 31, 549–555 共2004兲. 39 J. J. Heine and R. P. Velthuizen, “Spectral analysis of full field digital mammography data,” Med. Phys. 29, 647–661 共2002兲. 40 Q. Huang, J. R. Lorch, and R. C. Dubes, “Can the fractal dimension of images be measured?,” Pattern Recogn. 27, 339–349 共1994兲. 41 J. F. Veenland, J. L. Grashius, F. van der Meer, A. L. Beckers, and E. S. Gelsema, “Estimation of fractal dimension in radiographs,” Med. Phys. 23, 585–594 共1996兲. 42 A. E. Burgess, “Mammographic structure: Data preparation and spatial statistics analysis,” in Proceedings of Medical Imaging 1998 Conference: Image Processing, San Diego, CA; Proceedings of the Society of PhotoOptics Instrumentation Engineers Conference, Bellingham, WA, 1998, Vol. 3661, pp. 642–653. 43 M. Aguilar, E. Anguiano, and M. A. Pancorbo, “Fractal characterization by frequency analysis: II. A new method,” J. Microsc. 172, 233–238 共1993兲. 44 G. D. Tourassi, D. M. Delong, and C. E. Floyd, “A study on the computerized fractal analysis of architectural distortion in screening mammograms,” Phys. Med. Biol. 51, 1299–1312 共2006兲. 45 C. Caldwell, S. Stapleton, D. Holdsworth, R. Jong, W. Weiser, G. Cooke, and M. Yaffe, “Characterisation of mammographic parenchymal pattern by fractal dimension,” Phys. Med. Biol. 35, 235–347 共1990兲. 46 C. Castella, K. Kinkel, F. Descombes, M. P. Eckstein, P. E. Sottas, F. R. Verdun, and F. O. Bochud, “Mammographic texture synthesis: Secondgeneration clustered lumpy backgrounds using a genetic algorithm,” Opt. Express 16, 7595–7607 共2008兲. 47 J. J. Heine, S. R. Deans, R. P. Velthuizen, and L. P. Clarke, “On the statistical nature of mammograms,” Med. Phys. 26, 2254–2265 共1999兲. 48 F. O. Bochud, C. K. Abbey, and M. P. Eckstein, “Statistical texture synthesis of mammographic images with clustered lumpy backgrounds,” Opt. Express 4, 33–42 共1999兲. 49 H. Li, M. Giger, O. Olopade, A. Margolis, L. Lan, and M. Chinander, “Computerized texture analysis of mammographic parenchymal patterns of digitized mammograms,” Acad. Radiol. 12, 863–873 共2005兲. 50 H. Li, M. Giger, O. Olopade, and L. Lan, “Fractal analysis of mammographic parenchymal patterns in breast cancer risk assessment,” Acad. Radiol. 14, 513–521 共2007兲. 51 F. Georgsson, S. Jansson, and Ch. Olsén, “Fractal analysis of mammograms,” in Proceedings of the 15th Scandinavian Conference, Aalborg, Denmark, 2007, pp. 92–101. 52 J. W. Byng, N. F. Boyd, E. Fishell, R. A. Jong, and M. J. Yaffe, “Automated analysis of mammographic densities,” Phys. Med. Biol. 41, 909– 923 共1996兲. 53 P. R. Bakic, M. Albert, D. Brzakovic, and A. D. Maidment, “Mammogram synthesis using a 3D simulation. II. Evaluation of synthetic mammogram texture,” Med. Phys. 29, 2140–2151 共2002兲. 54 D. Lazos, K. Bliznakova, Z. Kolitsi, and N. Pallikarakis, “An integrated research tool for x-ray imaging simulation,” Comput. Methods Programs Biomed. 70, 241–251 共2003兲. 55 B. Mandelbrot, The Fractal Geometry of Nature 共Freeman, New York, 1983兲. 56 F. Biagini, Y. Hu, B. Oksendal, and T. Zhang, Stochastic Calculus for Fractional Brownian Motion and Applications 共Springer-Verlag, London, 2008兲.