Automation in Construction 20 (2011) 1143–1155
Contents lists available at ScienceDirect
Automation in Construction j o u r n a l h o m e p a g e : w w w. e l s ev i e r. c o m / l o c a t e / a u t c o n
Evaluation of image-based modeling and laser scanning accuracy for emerging automated performance monitoring techniques Mani Golparvar-Fard a,⁎, Jeffrey Bohn b,1, Jochen Teizer b,1, Silvio Savarese c,2, Feniosky Peña-Mora d,3 a
Charles E. Via Department of Civil & Environmental Engineering and Myers-Lawson School of Construction, Virginia Tech, 200 Patton Hall, Blacksburg, VA, 24061, United States School of Civil and Environmental Engineering, Georgia Institute of Technology, 790 Atlantic Dr. N.W., Atlanta, GA, 30332-0355, United States Electrical and Computer Engineering, University of Michigan, Ann Arbor, MI 48109-2122, United States d The Fu Foundation School of Engineering and Applied Science and Morris A. and Alma Schapiro Professor of Civil Engineering and Engineering Mechanics, Earth and Environmental Engineering, and Computer Science, Columbia University, 510 S.W. Mudd Bldg, 500 W. 120th St., New York, NY 10027, United States b c
a r t i c l e
i n f o
Article history: Accepted 11 April 2011 Available online 31 May 2011 Keywords: Progress monitoring Image-based modeling Structure from motion Laser scanning Computer aided design Construction field imagery Range point clouds As-built modeling
a b s t r a c t Accurate and rapid assessment of the as-built status on any construction site provides the opportunity to understand the current performance of a project easily and quickly. Rapid project assessment further identifies discrepancies between the as-built and as-planned progress, and facilitates decision making on the necessary remedial actions. Currently, manual visual observations and surveying are the most dominant data capturing techniques but they are time-consuming, error-prone, and infrequent, making quick and reliable decision-making difficult. Therefore, research on new approaches that allow automatic recognition of as-built performance and visualization of construction progress is essential. This paper presents and compares two methods for obtaining point cloud models for detection and visualization of as-built status for construction projects: (1) A new method of automated image-based reconstruction and modeling of the as-built project status using unordered daily construction photo collections through analysis of Structure from Motion (SfM); (2) 3D laser scanning and analysis of the as-built dense point cloud models. These approaches provide robust means for recognition of progress, productivity, and quality on a construction site. In this paper, an overview of the newly developed automated image-based reconstruction approach and exclusive features which distinct it from other image-based or conventional photogrammetric techniques is presented. Subsequently the terrestrial laser scanning approach carried out for reconstruction and comparison of as-built scenes is presented. Finally the accuracy and usability of both of these techniques for metric reconstruction, automated production of point cloud models, 3D CAD shape modeling, and as-built visualizations is evaluated and compared on eight different case studies. It is shown that for precise defect detection or alignment tasks, image-based point cloud models may not be as accurate and dense as laser scanners' point cloud models. Nonetheless image-based point cloud models provide an opportunity to extract as-built semantic information (i.e., progress, productivity, quality and safety) through the content of the images, are easy to use, and do not need add burden on the project management teams by requiring expertise for data collection or analysis. Finally image-based reconstruction automatically provides photo alignment with point cloud models and enables image-based renderings which can remarkably impact automated performance monitoring and asbuilt visualizations. © 2011 Elsevier B.V. All rights reserved.
1. Introduction Accurate and rapid assessment of progress, productivity, and quality control/quality assurance (QC/QA) is critical to successful project man-
⁎ Corresponding author. Tel.:+1 540 231 7255; fax: + 1 540 231 7532. E-mail addresses:
[email protected] (M. Golparvar-Fard),
[email protected] (J. Bohn),
[email protected] (J. Teizer),
[email protected] (S. Savarese),
[email protected] (F. Peña-Mora). 1 Tel.: + 1 404 894 8269; Fax: + 1 404 894 2278. 2 Tel.: + 1 734 647 8136; Fax: + 1 217 265 8039. 3 Tel.: + 1 212 854 6574; Fax: + 1 217 265 8039. 0926-5805/$ – see front matter © 2011 Elsevier B.V. All rights reserved. doi:10.1016/j.autcon.2011.04.016
agement. These assessments provide an opportunity to understand the current as-built status of a project efficiently, identify discrepancies between as-built and as-planned progress, and aid in deciding on remedial actions. Despite the importance of site assessment, within the Architectural, Engineering, Construction, and Facility Management (AEC/FM) industry, this process has not yet been completely automated, nor has accuracy measurement benchmark been firmly established. Current manual practice for collecting data on as-built status of a project is still time-consuming and labor intensive [1]. For example, on a 200,000 S.F. construction project with 11 bid-packages, on average 20– 25 daily construction reports are filled out and collected on a daily basis. Processing of such data is a difficult task due to its labor-intensive nature
1144
M. Golparvar-Fard et al. / Automation in Construction 20 (2011) 1143–1155
and the necessary level of competency with required processing techniques [2], [3]. In some cases a field engineer spends half to a full-day worth of work every day to process such a data and compare it with his/ her own or a superintendent's observations. Furthermore, techniques that are used to document and report the as-built status are visually complex and need to be improved to minimize the time required for describing them in contractor coordination meetings [3]. For example a drywall contractor may report in their daily construction report that Framing has been conducted on a particular day without explicitly indicating the location or the scope of the work. Such lack of accurate and detailed information occasionally requires more time to be spent in coordination meetings to discuss and explain the as-is status of a project. In addition, the formats of these reports (e.g., text-oriented daily construction reports, S progress curves, and bar charts) may not accurately and visually represent the physical progress. There is a need for proper geometrical representations that facilitate control decisionmaking tasks. Overall, the large amount of data collected, processed and represented creates management issues in reading, processing, visualizing and storing the information in a seamless and an efficient way. In recent years, significant progress towards automating detection and visualization of as-built status of a project has been achieved. These methods include image-based sensing technologies (i.e., collecting large numbers of time-lapsed and daily site photographs using digital cameras) and 3D remote sensing technologies (i.e., robotic total stations, Global Positioning Systems (GPS), Radio Frequency Identification (RFID), bar codes, Ultra-Wide Band (UWB) and laser and distance ranging—LADAR). Among these 3D remote sensing technologies, laser scanning has a better potential for applications in the construction industry as it can holistically address all of the listed inefficiencies associated with the current practice of progress monitoring (i.e., data collection, analysis and representation), through collection and analysis of the data and finally using the same data for representation of the current status of a project. Despite high accuracy of laser scanners and dense reconstruction of the as-built models, as reported in several cases [4], [5], [6], and [7], a set of limitations and challenges in implementation may reduce the observed benefits by practitioners. These limitations include discontinuity of the spatial information, mixed pixel phenomenon [5], scanning range, and sensor calibration. For example, moving objects in line-of-sight of an optical sensing instrument would create occlusions on the targeted object and create additional problems for the management team which must manually fix the superfluous noise. Compounding these issues, as the distance between the scanned objects increases, the level of details returned for the captured components can be reduced. Furthermore, the data collection process is time consuming, requiring sufficient knowledge of surveying theory, multiple individuals, and expensive and delicate components in an often rugged environment. The raw scanning data only contains Cartesian coordinate information of the scanned scene and does not carry any semantic information, such as knowing which point belongs to what as-built structural component (similar to other 3D remote sensing technologies). Recent research efforts address these inefficiencies associated with the stand-alone application of laser scanners. One example is presented in El-Omari and Moselhi [9] wherein a new approach for progress data collection uses an integrated 3D laser scanning and photogrammetry technique. The method is shown to be less timeconsuming with higher cost savings compared to the stand-alone application of laser scanners. The suggested approach also minimizes access limitations of scanner placement by integrating photogrammetry data with laser scanner point cloud; yet the processing time required for each scan can be considerable and the registration of images and 3D point cloud needs further adjustments. Also in this method, site images taken from arbitrary viewpoints are not automatically aligned with the 3D point cloud; rather the common points between laser scanner's 3D points with images are manually selected and matched. Considering large size of construction photo
collections, manual selection and matching of common points between the data sources may challenge effective application of these systems. Bosche et al. [8] and Bosche and Hass [4] presented another example of such research efforts wherein a new approach for automated recognition of 3D CAD objects from 3D laser scanned scenes is presented. In their earlier work, the as-planned 3D CAD model is converted to a point cloud model. Using point recognition metrics, correspondences between as-planned and as-built models are identified and recognition of the progress is returned. Recent work of Bosche et al. [8] introduces an object surface recognition metric that shows high precision/recall on object recognition performance of a steel structural building. However none of the current methods take advantage of utilizing construction site photographs that are collected on a daily basis and are readily available on almost all construction sites. Even in morerecent photogrammetric or hybrid geometry and image-based reconstruction techniques such as [10], [11] and [12], photographs are taken in supervised manners (e.g., calibrated cameras) and feature selection, stereo-matching and image-based modeling steps are all conducted in interactive ways, so significant manual interventions by a user is required to facilitate 3D reconstruction of the buildings. The frequency for site inspections and the amount of required supervision for these techniques makes their applications less attractive. Recent advancements in automated feature detection and matching techniques [13] allow photographs that are even randomly taken to be matched and used for reconstruction purposes [3], [14], [15], and [16]. These approaches as outlined in [3] provide a potential opportunity to automatically reconstruct as-built scenes from photos that are randomly taken on construction sites and visualizing those through integrated representation of as-built point cloud models and georegistered site imagery. Before complete utilization of these emerging and automated image-based reconstructed point cloud models for progress monitoring, their accuracy and usability needs to be evaluated against the laser scanning point cloud models. A comparison of point cloud models automatically generated from site photographs with point cloud models from high precision laser scanners can provide such an evaluation. This paper presents a comparison between two recent methods namely automated image-based reconstruction using Structure-from-Motion (SfM) techniques and terrestrial laser scanning for generating as-built models as an underlying basis for performance monitoring and defect detection. Eight sets of 3D spatial models, four from real-world construction projects and four from laboratory settings are generated using (1) laser scanning, and (2) imagebased reconstruction technique using daily construction photo collections. In this paper, daily construction photographs refer to uncalibrated images that are casually collected by field engineers with specific applications for management of progress, productivity or quality of the construction. In these photologs, calibration information; i.e., intrinsic parameters (i.e., focal length, distortion) as well as extrinsic parameters (i.e., location and orientation) of the camera at the time images were captured are not known. Based on the experiments conducted, both approaches generated 3D CAD surfaces. For complete as-built model generation and visualization, as well as progress monitoring, the 3D CAD models and their reconstructed surfaces are compared for accuracy and usability. This paper begins by introducing the reader to the two techniques used in this research. First, we briefly overview the specific features which differentiates our developed image-based reconstruction technique from other image-based modeling and conventional photogrammetry techniques. Subsequently the limitations associated with each of these methods are discussed. Next, the research methodology including experimental plan, data collection, and data processing is explained. Results of the conducted experiments for processing and visualization of as-built scenes as well as accuracy of each method are presented followed by conclusions and future work.
M. Golparvar-Fard et al. / Automation in Construction 20 (2011) 1143–1155
2. Background In this section, previous works that have led to the application of daily construction photo collections and laser scanners for generating and visualizing as-built point cloud models of construction sites are presented. Next, the benefits and barriers of each of these approaches are discussed. 2.1. Image-based reconstruction using daily site photo collections and analysis of structure from motion (SfM) The most widespread and easy-to-use method of obtaining data for monitoring project controls is simply having a project engineer or superintendent take photographs of construction progression using inexpensive and readily available digital cameras. Another trend using automated time-lapse or videotaping construction cameras has also been useful in project management/controls and documentation of construction projects [17], [18]. Automated cameras allow users to know the current project status at customizable time intervals and field-of-view, taking advantage of remote controllable camera hardware via broadcast or cellular internet connection. Using these cameras, time-lapse videos of construction activities can be created and analyzed for post-action productivity. Although such images are easy to obtain, inexpensive, and easily understandable, automated or semi-automated detection of progress from site images is challenging [3]. Time-lapsed photos only show activities that are (1) unobstructed by secondary activities or equipment (i.e., by machines, scaffolding) and (2) in the camera's field-of-view. These factors limit the application of time-lapse images, since once the envelope of the building is in place, it is impossible to track progress inside the building from the same camera's viewing point. In addition, different lighting conditions, weather, and site conditions make it difficult to use timelapse photography for performing consistent image analysis [18], [19]. In such cases Golparvar Fard et al. [3] and Leung et al. [20] suggest the installation of multiple cameras on the job site. Yet multiple fixed cameras come at greater expense and cannot overcome all limitations of occlusion, obstruction, weather, and dynamic site conditions. Given the benefits and limitations of time-lapse photography and webcams, this research suggests application of unordered daily construction photo collections. In this paper, unordered daily construction photo collections refer to photos that are taken from different locations in the same day. The suggested methodology can also work with unordered photo collections captured during several days in which the visual appearance of the site is not significantly changed. Usually key project stakeholders (i.e., construction managers, ownerrepresentatives, and subcontractors) collect large numbers of these images at almost no cost. Such large and already existing visual data enables as-built 3D reconstruction and visualization, and may increase quick and easy communication and recognition of critical issues among project stakeholders. Nonetheless, automated analysis of daily construction photographs is not easy. These images are usually not organized according to the locations they are taken from. They are not calibrated with respect to known coordinates and vary widely under various illumination, resolution, and image quality. They typically focus on detailed activities that are constantly changing in the work environment and/ or may be taken in a panoramic manner. Therefore, they may not carry enough information from the perspective of tracking site progress which is essential for global reconstruction of the as-built scene. In addition to these problems, capturing entirety of progress on dynamic construction sites where in construction work crews and machinery are constantly moving is problematic. Hence, developing computer visualization and image processing techniques that can operate effectively with these data sets is a major challenge. Within the presented research scope, a key challenge is image registration (i.e., finding distinctive features within images and matching those within a
1145
common 3D coordinate system). Substantial progress has been done in this area by the computer vision community over the last decade [10], [14], [21], [22], [23], [24], and [25] but many challenges are still unsolved, specifically with respect to applications of Structure-fromMotion (SfM)—approaches that aim to recover camera parameters, pose estimates, and sparse 3D scene geometry from a sequence of images [21]—for fully automated generation of as-built construction point cloud models. Many of such works still depend on using interactive methods for manual feature detection and matching (e.g., [11] and [12]) or calibrating cameras for data collection (e.g., [26] and [27]). These interactive techniques can successfully reconstruct building models, however they add new tasks to the project management team by requiring manual supervision on the as-built reconstruction. Given the usual frequency of progress monitoring observations, application of these techniques may become unattractive. To address such inefficiencies, this paper looks into techniques that can automatically reconstruct as-built scenes from already available unordered construction photo collections. In Section 3.1, the state-ofthe-art steps towards automated image-based generation and visualization of as-built models using these images are presented. Results of reconstructing and localizing the as-built scene and registering progress imagery with the as-built model are also presented. 2.2. Three-dimensional laser scanning Laser scanning construction sites for progress monitoring has a number of unrealized benefits that are lacking in traditional methods (i.e., total stations, GPS). Laser scanning can be conducted in a number of ways including aerial, mobile, or more traditional, terrestrial based. This research focuses on terrestrial data capture due to the nature of the experiments which require close range and high precision measurements, availability of technology in the construction industry, and ease of integration with other existing technologies. Laser scanning is based on time-of-flight (TOF) measurements to collect range (x, y, and z) and intensity (reflectivity) to distinct points in a scene. A laser scanner returns data as a point cloud, visualized through commercially available software. Users can interact and manipulate so called dense range point data allowing for construction of as-built conditions in a virtual environment [7]. A unique feature of laser scanning over traditional surveying is the ability to manipulate and view data in a full degree of freedom environment. Laser scanners allow for wide range measurements at high resolution, and are generally not limited by ambient conditions during operation [7]. Developing technology is focusing on semi/fully automated integration of laser scan data with CAD models and other visualization technologies [5]. An observed characteristic of laser scanned scenes is the resulting density and standardization of the generated point cloud models. Laser scanners can output extremely high resolution models, but at a much larger file size and processing time. The data is considerably accurate, though it is dependent on a number of factors including object distance from scanner, target surface reflectivity, and measurement angle [26]. More sophisticated laser scanners have higher accuracy, though at a much greater cost. On the other hand, laser scanning has a number of limitations that impede implementing the technology alone in construction projects. Laser scanning takes significant time to complete a full scan, and depending on the size of the construction site, can take a crew of two people days (for large scale hi-resolution shots). Much like fixed automated cameras, laser scanners can only return data for objects that are within line-of-sight of the scanner and thus many occlusions occur, which is why multiple station locations are used [7]. Scanners cannot be utilized during inclement weather (e.g., rainfall). Laser scanners also require significant power, which is not always available on a construction site. According to Boehler and Marbs [28], in certain cases laser scanning can be less accurate than photogrammetry or image-based reconstruction techniques, though the metric for this
1146
M. Golparvar-Fard et al. / Automation in Construction 20 (2011) 1143–1155
claim through comparison of point cloud models automatically generated from SfM analysis and those of laser scanning will be established later in the paper. Although laser scanning is currently cost prohibitive, though the technology is becoming less expensive and more widespread, in particular since commercial providers and government entities have begun to realize its return-on-investment (ROI) compared to conventional surveying methods. As the technology continues to grow, cost should decrease and adoption increase. For these reasons, comparison of their application to image-based reconstruction technique is essential.
2.3. Combining site photographs with laser scanned scenes The current status of remote sensing technology allows the argument that no single remote sensing method alone solves the needs of the AEC industry to build as-built models or to track construction progress. Instead, some studies such as [2] and [9] recommend a combined approach of remote sensing technology. Photo collections and laser scanning are complementary technologies to use in combination because of the similarities in outputted data. Both can produce data in Cartesian coordinates (x, y, and z) which can be easily modeled in a same virtual environment. Laser scanning can capture a comprehensive and dense Cartesian-based data set that photo collections may not. Additionally, site photos allow capture of dynamic events on construction sites (i.e., moving crews and equipment) at high update rates which can be complementary to the detailed and static range data that laser scanners collect from fixed objects. Using site images does not add any burden or new tasks to project management, since daily construction photographs are already being collected. In addition, computer vision and/or image processing techniques that are applied on registered site photographs can add additional information that is essential to decision makers, such as information to work task progress, productivity, quality, site logistics, and safety. Nonetheless, before applying image processing techniques, 3D geometrical reconstruction of the site and autocalibration of site imagery is necessary. This further motivates the application of image-based reconstruction technique presented in this paper.
3. Overview on the as-built data capturing methodology In the following sections, SfM and laser scanning methods for capturing as-built conditions are explained.
3.1. Image-based as-built modeling using daily construction photo collections and structure from motion technique This section briefly explains the steps that are required to generate as-built scenes using daily construction photo collections. The complete technical detail of this approach is not part of the scope of this paper and is already covered in other works [3], [14], [15], and [29]. A brief summary of key components of the method which differentiates our work from others follows. In the computer vision society, the described problem is defined as Structure from Motion (SfM). SfM studies both structure (i.e., three-dimensional structure of the environment) as well as the motion (i.e., motion of the camera within the scene). Such systems require accurate information of calibration information; i.e., both extrinsic (i.e., relative location and orientation), and intrinsic (i.e., focal length and distortion) parameters for each images taken on the construction site. Nonetheless, the photo registration method used in this research approach relies on data extraction from digital images alone [3]. The approach neither relies on GPS and wireless location tracker nor on pre-calibrated cameras for detecting location, orientation of the photographer and/ or geometry of the photographed objects. Rather such information is automatically computed from the images themselves. Fig. 1 represents the steps that were implemented in this work towards solving this problem. These state-of-the-art steps are presented as follows: 3.2. Steps for image-based reconstruction The steps towards reconstruction of the as-built scene are presented in the following: 3.2.1. Automated feature detection and correspondence The first step to use site images for reconstruction is to find distinct features on each image, which can be automatically matched across a subset of images. Despite significant research on feature detection and matching, only recently have researchers implemented successful methods in extracting and detecting salient regions (in image/scale space) invariant with respect to scale, orientation and affine transformations. The features need to be highly distinctive, in the sense that a single image can be correctly matched with high probability against a large database of images. Mikolajczyk et al. [30] reviewed recently developed view-invariant local image descriptors and experimentally compared their performances. In the approach and implemented system used in this research Lowe's SIFT features—Scale
Data
Pr ocess
Incremental Structure from Motion
Feature Detection
Site photo collection
Pairwise Matching
Correspondence Estimation
Bundle Adjustment
3D as-built point cloud D4AR viewer Camera configurations
Fig. 1. Schematic representation for steps of incremental Structure from Motion (SfM) followed from left to right (SfM graphics extended from [29], [38]).
M. Golparvar-Fard et al. / Automation in Construction 20 (2011) 1143–1155
a
1147
b
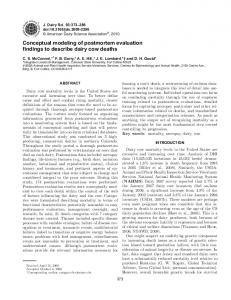
Fig. 2. The SIFT (Scale-Invariant Feature) detectors shown over the initial reconstruction pair. A total of (a) 7238 and (b) 9745 SIFT features were detected.
Invariant Feature Transforms [13] is applied. This applied has been widely used in the computer vision community over the past few years and achieves good performances over an acceptable range of viewpoint changes. Recent methods have taken advantage of these properties [15], [16], [31], and [32]. Fig. 2 shows the SIFT features detected in an initial reconstruction image pair (explained later) from one of our experimental databases. Once features have been detected throughout the dataset, it is necessary to know how many of the detected features match in each image pair. In this work, features are automatically matched using a nearest neighborhood matching scheme. Since the number of features is large, a k–d tree matching scheme [33] is used to reduce the computation cost for matching. This is particularly effective when the dimension of the data set is large. Fig. 3 shows the SIFT feature points across the same image pair used in Fig. 2 and visualizes some of these matches through connecting these features by solid lines. Due to potential inaccuracies in feature matching especially because of similar or symmetrical appearance in building components, some false matches may also form. Due to the sensitivity of the reconstruction algorithm to these false matches, a fundamental matrix [21] within a RANSAC (random sample consensus) [34] iterative method is fit to each matching image pair. The fundamental matrix helps remove false matches as it enforces corresponding features to be consistent under change in the view point. Fig. 3 shows 14 SIFT features (out of a total of 849) that are consistently matched after fitting a fundamental matrix. Fig. 4 schematically presents the configuration of an image pair and the fundamental matrix that is used to remove false matches. The fundamental matrix F is a 3 × 3 matrix which relates corresponding points in a stereo image pair. In an epipolar geometry with homogeneous image coordinates—the intrinsic projective geometry
a
between two views of any stereovision configuration—Q L and Q R are corresponding points (the feature points that are detected and matched), FQ L represents an epipolar line on which the corresponding point of Q L (Q R) must line on the other image, and finally EL and ER are the epipoles which are the projection centers of the other camera (EL and ER). The epipolar geometry means that for all pairs of corresponding points: Q RT FQ L = 0. Fitting the estimated fundamental matrix for each image pair removes false matches that are not consistent with the estimated epipolar geometry. 3.2.2. Structure from motion (SfM) Once the correspondence between a set of feature points across a subset of daily site images are known, extrinsic (rotation and translation) and intrinsic (focal length and distortion) camera parameters for estimating the 3D location of each SIFT feature will be recovered. The recovered parameters should be consistent, in that the re-projection error (i.e., the sum of distances between the projections of each set of 3D corresponding feature points and its corresponding image features) is minimized. This minimization problem can be formulated as a non-linear least squares problem and solved using bundle adjustment [35]. In this work, before formulating this non-linear least square problem, extrinsic and intrinsic parameters of a single image pair is estimated to initialize the reconstruction (third step 3 in Fig. 1). Bundle Adjustment as other algorithms for solving non-linear problems is prone to fail by converging in local minima as opposed to global minima, hence it is strongly suggested by many researchers (e.g., [15], [36]) to start with a good initial image pair and good estimates for camera parameters in the automatically chosen pair. This initial pair for SfM should have a large number of matches, but also have a large baseline, so that the initial scene can be robustly
b
Fig. 3. A total of 849 SIFT features were matched in this image pair. For visibility, only 14 of these matched features are shown.
1148
M. Golparvar-Fard et al. / Automation in Construction 20 (2011) 1143–1155
Q(x,y,z,1)
QL(UL,VL,1)
OL
EL
QR(UR,VR,1)
ER
OR
Fig. 4. A schematic representation of the epipolar geometry for an image pair.
reconstructed. An image pair that is poorly described by a homographic transformation satisfies this condition. Homographic transformation is represented by a projective transformation matrix (homography matrix) that maps points from one image plane to another image plane [21]. The homography between all image pairs using RANSAC was found with an outlier threshold of 0.4% of the maximum of the image width and height. Stored was the percentage of feature matches that are inliers to the estimated homography. The initial image pair automatically selected was the pair with the lowest percentage of inliers, but with at least 100 matches (as experienced in [15]). The experiments conducted shows that the selection of the initial pair is not sensitive to the threshold used for fitting the homography matrix. Since in this work, the initial pair selection heuristics requires a minimum of 100 matching feature points, changing the threshold for identifying the outliers will not be have a significant on how the initial pair is selected. The camera parameters for this pair are estimated using Nistér's five point algorithm [36], and then the feature points visible in the image pair are triangulated. A two-frame bundle adjustment for this initial pair was performed. Next, all images that were taken by the cameras contribute to this optimization task. The camera that examines the largest number of estimated sets of associated correspondence across a subset of images was chosen, and initializes the new camera's extrinsic parameters using the Direct Linear Transform (DLT) technique [21] within a RANSAC procedure. For this RANSAC step, an outlier threshold of 0.4% of maximum of image width or height was applied. Focal length for each image was extracted from the EXIF (Exchangeable Image file format) tags of JPEG images (file type of almost all digital cameras) and was used to initialize the focal length of the new camera and estimate the intrinsic camera matrix [15]. Starting from this initial set of parameters, the incremental bundle adjustment algorithm allows any new camera and observed SIFT feature points to change while the rest of the model is kept fixed. In this approach, points that were observed by the new camera are automatically added into the optimization algorithm. The algorithm adds a SIFT feature point if it is observed by at least one existing recovered camera, and if triangulating the point gives a wellconditioned estimate of its location. The condition is satisfied when considering all pairs of rays that could be used to triangulate that point, and finding the pair of rays with the maximum angle of separation. If its maximum angle is larger than a threshold, then the point is triangulated [15]. Once new points have been added, another global bundle adjustment refined the entire as-built reconstructed scene. The minimum error solution used the sparse bundle adjustment library [35]. This procedure is repeated for all cameras until no remaining camera observes enough reconstructed 3D points to be reliably reconstructed. Overall only a subset of the images that satisfy all constraints may be used for reconstruction. For example if images with significantly wide baselines or minimal overlaps are used or even cases where some none-related photos exist in the dataset, those
images may not be used for reconstruction. Obviously this subset is not selected beforehand, but is automatically determined by the algorithm and the implemented system. The outcome of the implemented SfM algorithm is two folds: (1) 3D Cartesian coordinates of all 3D points reconstructed. Each 3D as-built point will be associated with a color which is averaged out from all images that this point falls into their view frusta; (2) A set of intrinsic and extrinsic camera parameters for each image. We use these two sets of information to visualize the as-built point cloud and camera frusta. For this purpose, camera parameters are used to render the location and viewpoint of each camera's frustum and superimpose the image texture on the frustum's frontal surface. The visualization component of this system called D4AR—4D Augmented Reality is implemented in C++ using DirectX 9.0 graphics library. In this visualization system, users can navigate through the photos and observe the integrated photo and point cloud model both from real and synthetic perspectives (real perspective: rendering of the integrated scene from a camera viewpoint; synthetic perspective: rendering of the integrated scene from all other viewpoints in the 3D environment). The results of experiments using the D4AR system to visualize the sparse as-built site as well as the camera configurations are explained in the experiment section. In summary, the presented approach takes a set of unordered photos and automatically reconstructs a 3D point cloud model and visualizes the model along with the photos registered in the same environment. 3.3. Laser scanning For this research, eight experiments were conducted to obtain datasets from different environmental settings, as both photographs and laser scanning data are affected by their surroundings. The experimental objects used include a single object cuboidal masonry block (scanned both indoor and outdoor) and two structural concrete columns (located on exterior and interior of the construction site) which enable accuracy of the 3D laser scanning and image-based 3D reconstruction be considered at two different scales. In addition by scanning the same object both at indoor and outdoor, the accuracy differentials between laser scanning and image-based 3D reconstruction under different lighting conditions can be calculated. All objects were scanned so that all visible faces were captured. For each masonry block, 3″ × 3″ targets were affixed to the sides and top to be used in (1) post-processing for scene reconstruction (only for laser scanning case) and (2) determining three-dimensional accuracy. This method is more robust than previous research efforts from [9] that attempted to combine laser scans and photos from one face of an object. In addition, this research scanned objects on actual construction sites, allowing for realistic data collection in scenarios faced by surveyors. This experiment enables accuracy of image-based and laser scanner point cloud models to be measured and compared. 4. Description of experimental setup To obtain digital images for the photo collection, a commercially available Nikon D-80 set at 10 megapixel resolution was used. Table 1 Technical data for Nikon D-80 (used in experiments). Type of camera Effective pixels (millions) Image size (pixels) Picture angle (mm) Shutter speed (sec)
Single-lens reflex digital 10.2 3872 × 2592 [L], 2896 × 1944 [M], 1936 × 1296 [S] Equivalent in 35 [135] format is approx. 1.5 × lens focal length Electronically-controlled vertical-travel focal plane shutter; 30 to 1/4000
M. Golparvar-Fard et al. / Automation in Construction 20 (2011) 1143–1155
1149
Fig. 5. Experimental setup of scanning traverse.
Between 50 and 200 images were taken for each experimental object. Images were taken at a high speed exposure level to aid in fast photo image capture. A realistic scenario was created in which photo takers (e.g., superintendents, construction managers, and owner's representatives) experience on walk-through on construction sites. All images were taken with an aperture (ISO) of 400 and a resolution of 3872 horizontal and 2592 vertical pixels. Photos were taken immediately before the setup of the laser scanner in order to capture the “as-is” status of the under study site and its components. For each object, a circular path was traversed, with images being shot at approximately every meter to minimize occlusions while maintaining the random distribution of the photos in the scene. Depending on the size and location of the components, different numbers of photos were needed. Technical data on camera is shown in Table 1. A commercially available hi-resolution laser scanner (Leica ScanStation 2) was used to obtain laser range point data of the same scene. For each object, a 3-point survey traverse was used with scan data taken from each location. As in traditional surveying, each scan station includes both a foresight (following scan point) and backsight (previous scan point). Each location produces a standalone individual point cloud model of a scene that, when combined with other point cloud models from multiple field-of-views, can create a complete 3D point cloud model. Although fully-automated registration methods can match individual point cloud models of a scene to one scan world (a true 3D view of a complete scene), to obtain the highest possible accuracy, this research used highly reflective targets that were placed on the foresight and backsight. This was done in order to automatically register the scan stations during data analysis (this step was only used for laser scanned point cloud registrations and not for image-based reconstruction technique). A typical experimental setup is shown in Fig. 5. Technical data for the laser scanner that was used in this research is shown in Table 2.
Experimental data from laboratory and field experiments are shown in Table 3. For each experiment, both hi-resolution and low resolution laser scans were performed at each station. For example, at all scan locations a low resolution scan was completed in 360° to capture the entire scene. Next, a hi-resolution scan focused specifically on the masonry block. Once the experimental objects were scanned, the laser scanning point cloud models were registered using commercially available software (Leica Geosystem Inc. Cyclone 6.0 and Cloudworx). The registration process of laser scanning point cloud models is mostly manual, but algorithms in the software use the location of the reflective targets to tie scans together. The algorithms used to register the scene are propriety with Leica and are not in the scope of this research. Fig. 6 shows two experimental results of the laser scanned columns both at exterior and interior. 4.1. Obtaining progress photo collection During the conducted experiments, approximately 50 to 200 images with a resolution of 3872 × 2592 were collected. In order to validate application of the presented algorithm under different ambient conditions, experiments were both conducted indoors and outdoors. Taking these images on a circular path guaranteed minimal occlusion and random distribution of the images in the scene. Four of these image subsets were collected from the masonry block at outdoor and indoor settings. To evaluate the robustness of the imagebased approach to different image resolutions, the resolution of indoors and outdoors images were synthetically reduced to 60% of their original resolution (2323 × 1555 and 1936 × 1296). Lowering the resolution of the images also lessened the computation time required
Table 3 Laser scanning experimental data. Pictures Weather taken (#) conditions
Table 2 Technical data for Leica ScanStation 2. Instrument type Laser type Scan rate (points/s) Field of view (degrees) Scanning optics Modeling surface precision (mm)
Pulsed, dual-axis compensated Green Up to 50,000 H: 360°, V: 270° Single mirror, panoramic 2
1. Masonry block 382 (indoors) 2. Masonry block 376 (outdoors) 3. Column(exterior at 80 construction site) 4. Column(interior at 54 construction site)
Scans Number Time to (#) of points* complete (h)
Indoor
3
961,793 2
Sunny, bright Sunny, bright Indoor
2
816,039 1.5
3
1,324,118 2
3
719,320 2
* Number of points scanned for the object, not the entire scene.
1150
M. Golparvar-Fard et al. / Automation in Construction 20 (2011) 1143–1155
Column @ exterior
Column @ interior
a
b
Fig. 6. Laser scanned point clouds for (a) a column at exterior; and (b) a column at interior.
a
b
c
d
e
f
Fig. 7. Experimental setup for photography of the block: Images taken at an indoor laboratory environment (first row), Images taken outdoors (second row).
a
b
c
d
e
f
Fig. 8. Two subsets of photographs taken from a column and its periphery at a construction site: Images taken indoors (first row), Images of an exterior column (second row).
M. Golparvar-Fard et al. / Automation in Construction 20 (2011) 1143–1155
1151
Table 4 As-built site photography and SfM experimental data and results.
Total # of images # of used images Lighting Condition Original image resolution Processed image resolution # of points recovered Recall++ Computation time
Exp. 1+
Exp. 2
Exp. 3
Exp. 4
Exp. 5
Exp. 6
Exp. 7
Exp. 8
72 53 Lab. lighting 3872 × 2592 2323 × 1555 110,351 1 29 min
72 53 Lab. lighting 3872 × 2592 3872 × 2592 204,861 1 45 min
376 242 Sunny, bright 1936 × 1296 1162 × 778 80,560 1 5 h 12 min
376 242 Sunny, bright 1936 × 1296 1936 × 1296 204,861 0.94 7 h 03 min
80 80 Sunny, bright 3872 × 2592 2323 × 1555 19,553 0.71 49 min
80 80 Sunny, bright 3872 × 2592 3872 × 2592 38,739 0.71 1 h 13 min
54 54 Temp. lighting 3872 × 2592 2323 × 1555 14,018 0.41 10 min
54 54 Temp. lighting 3872 × 2592 3872 × 2592 42,854 0.41 18 min
+ Experiments (1) and (2) Masonry block (interior); (3) and (4) Masonry block (exterior); (5) and (6) Concrete column (Construction site—outdoors); (7) and (8) Concrete column (Construction site—indoors). ++ Recall = Number of images registered/Number of images used.
to generate point cloud models. Figs. 7 and 8 show the images from both indoor and outdoor experimental configurations. Table 4 shows the results of the conducted experiments. The results are benchmarked on a computer with 2.93 GHz Intel® Core2 Extreme CPU, 4.00 GB of RAM, and a Windows 32-bit platform. Figs. 9, 10 and 11 show image-based renderings of the conducted experiments using the developed D4AR system. 5. Accuracy measurements and methods In these experiments, laser scanning and image-based point clouds were modeled in separate 3D environments. Registration of the laser scanning point clouds collected from different locations took about 10 s. Since in these experiments laser scanning targets were used, the registration process was completely automated. In the case of imagebased reconstruction, registration was not required as the point cloud was completely reconstructed in one fully automated step. To measure and compare accuracy, in both point clouds the masonry block and the exterior column were extracted from the rest of the points. Overall the laser scanning and image-based point cloud models generated minimal noise and thus the only required modification involved removing the surrounding environment points that did not belong to the masonry block or the column. Next, a semi-automated step selects the remaining points of the masonry block and forms a CAD object. In order to facilitate shape comparisons, the images collected from the laser scanning device
were superimposed on the point cloud model. This is done using a proprietary algorithm created by Leica Geosystems Inc. In presence of a minimum required number of points, this algorithm can automatically generate and apply simple geometric shapes, such as columns, blocks, pipes to the point cloud model. As this research focused on basic construction objects, this algorithm fits well into the scope of this work. Ongoing research is working on automating this task [4] and on optimizing the SfM point cloud models for higher quality reconstructions [37]. Leica claims that the accuracy for fitting objects to point cloud models is 2 mm which for general project progress monitoring seems to be sufficient. Three different views of the returned laser scanned data for the masonry block and three views of the return column (exterior case) are shown in Fig. 12. Part (a) shows a digital photo of the masonry block. Targets have been placed on the block to aid in laser scanning point cloud calibrations. These targets were only used for the laser scanning scenario and they were not used for calibration of the images in the SfM algorithm. Part (b) of Fig. 12 shows a high density laser scan point cloud model of the block and the resulting CAD object produced, while Fig. 12 (c) shows the block with a photo overlay from the laser scanner's integrated camera. The same method of generating CAD shape surfaces was applied to the image-based point clouds. It is important to note that in the case of using the SfM algorithm on the collected unordered image collections, a lower density (number of points in the point cloud) was obtained. In order to automatically fit a single 3D object to represent the block, a
a
b
c
d
e
f
Fig. 9. Snapshots of the D4AR system—visualizing indoor laboratory setup as well as outdoor setup for photography of the masonry block at high resolution. From left to right, images show the reconstructed scene, the scene through a camera viewpoint (frustum) as well as the camera frustum showing the image.
1152
M. Golparvar-Fard et al. / Automation in Construction 20 (2011) 1143–1155
a
b
c
e
d
f
Fig. 10. Snapshots of the D4AR—visualizing the point cloud of a column and its periphery at the construction site (high resolution images were used and large points are used for rendering). (a), (c) Point cloud, (b), (e) point cloud visualized through two camera frusta and (e), (f) the same camera viewpoints of (b), (e) with images overlaid on the frontal surface of the frusta.
a
b
c
Fig. 11. Snapshots of the D4AR—visualizing the point cloud of a column at interior and its periphery at the construction site (high resolution images were used and large points are used for rendering). From left to right: (a) Point cloud, (b) point cloud visualized through one camera frustum and (3) the same camera viewpoint of (b) with the image overlaid on the frontal side of the frusta.
M. Golparvar-Fard et al. / Automation in Construction 20 (2011) 1143–1155
a
b
1153
c
Fig. 12. (a) Actual image of masonry block, (b) returned point cloud over fitted CAD object, (c) point cloud with masonry block images overlaid.
dense dataset was required; however in two of our experiments the returned points were not at the necessary density level required by the algorithm to automatically fit a single object to represent the masonry block and thus the system was not able to automatically fit a 3D object. Thus in those cases, for each face of the block individual surfaces were semi-automatically created. The surfaces were subsequently constrained to one another to create intersections, representing the block edges. From these lines, Cartesian distances were measured. Since the SfM reconstructed scene needs to be upgraded to the proper scale, in other words transformed from metric to a Euclidean space, the comparison of the ratios for each dimension (x, y and z) was used instead of a volumetric comparison. Using this ratio allows the linear accuracy (which is useful for alignment controls) to be evaluated and compared to the true measurements of the objects (obtained using standard tape measuring tools). Table 5 displays a comparison of the ratios for each dimension (x, y, and z). As observed in Table 5 neither of the used approaches (laser scanning or image-based reconstruction) is completely accurate. The accuracy of these ratios in some of the cases when the image-based point cloud model is used is less than the accuracy of the point cloud model generated by the laser scanner (e.g., see experiments #2 and #3, or experiments #11 and #12 in Table 5). With the experienced accuracy, the applicability of this algorithm for fitting as-built CAD objects on image-based point cloud models may be reduced. Especially for some cases where precise alignments are required, the application of the image-based point cloud model may not be favorable. In contrary to this, within a certain tolerance of perpendicularity (e.g., during post-disaster rapid assessments), image-based
point cloud models can still be favorably used to measure deviations. It was also observed that the ratios in each experiment were slightly larger than the controlled ratio. In the case of laser scanner, this was most likely due to superfluous points that were not removed in the post-processing of data. Had these points been removed, the ratio difference would have been smaller (e.g., see experiments #2). In the case of image-based point cloud models, this was most likely due to the synthetically reduced quality of the photographs, the small number of photographs used, the SIFT feature detection technique, as well as the thresholds used in feature detection and bundle adjustment steps (e.g., see experiments #3). In a case where high resolution photographs and/or other feature detection methods are used and the thresholds are less penalizing (as experienced in this study), the number of detected SIFT features, as well as the quality and density of the photo generated point cloud models are higher. Figs. 13 and 14 show the image-based point cloud models as well as the CAD surface that are generated for the masonry block and the exterior concrete column. Table 6 qualitatively summarizes the advantages/disadvantages associated with using SfM point cloud models (along with still photographs) compared to laser scanning point cloud models. Overall it seems for high precision tasks such as measuring defects or precise alignment of a certain structural or mechanical elements [39], using laser scanners or conventional surveying methods offer valid and practical approaches. For applications where an overall knowledge of project status or even status of a post-disaster site is more important than a detailed and accurate measurement, the use of image-based reconstruction and site photographs becomes very handy since
Table 5 SfM and laser scanning accuracy ratio comparisons. #
1 2 3 4 5 6 7 8 9 10 11 12 13 14 15 16 17 18
Object
Block (outdoor)
(indoor)
Concrete Column (outdoor)
(indoor)
Data source
Actual Laser Photolog Laser Photolog Laser Photolog Laser Photolog Actual Laser Photolog Laser Photolog Laser Photolog Laser Photolog
#1 #2 #1 #2
#1 #2 #1 #2
Measured values X/Y
|Δ|
|δ|⁎1
Y/Z
|Δ|
|δ|⁎2
X/Z
|Δ|
|δ|⁎3
0.327 0.322 0.317 0.322 0.320 0.332 0.330 0.332 0.332 0.220 0.223 0.198 0.223 0.214 0.229 0.233 0.229 0.230
– 0.004 0.010 0.004 0.007 0.005 0.003 0.005 0.005 – 0.004 0.021 0.004 0.006 0.009 0.013 0.009 0.010
– 1.22% 3.05% 1.22% 2.14% 1.53% 0.92% 1.53% 1.53% – 1.81% 9.54% 1.81% 2.72% 0.04% 0.06% 0.04% 0.04%
3.060 2.966 2.743 2.966 2.834 3.010 2.758 3.010 3.010 4.556 4.587 5.085 4.587 4.809 4.530 4.612 4.530 4.570
– 0.094 0.317 0.094 0.226 0.050 0.302 0.050 0.050 – 0.031 0.530 0.031 0.253 0.026 0.056 0.026 0.014
– 3.07% 10.36% 3.07% 7.38% 1.66% 9.86% 1.66% 1.66% – 0.68% 11.63% 0.68% 5.55% 0.57% 1.22% 0.57% 0.31%
1.000 0.956 0.870 0.956 0.921 1.000 0.909 1.000 1.000 1.000 1.025 1.004 1.025 1.001 1.010 0.997 1.010 0.999
– 0.044 0.130 0.044 0.079 0.000 0.091 0.000 0.000 – 0.025 0.004 0.025 0.001 0.010 0.003 0.010 0.001
– 4.40% 13.00% 4.40% 7.90% 0.00% 9.10% 0.00% 0.00% – 2.50% 0.40% 2.50% 0.00% 0.01% 0.00% 0.01% 0.00%
⁎ |δ| = |Δ/Φactual| where in (1)Φ = X =Y , in (2) isΦ = Y =Z , or in (3) is Φ = X =Z .
1154
M. Golparvar-Fard et al. / Automation in Construction 20 (2011) 1143–1155
a
b
c
Fig. 13. (a) Points of masonry block reconstructed from the photo collection, (b) reconstructed shape surface, and (c) reconstructed shape edges.
a
b
c
Fig. 14. (a) Rendered photo of the column automatically registered with the point cloud; (b) point cloud from the same viewpoint without the image; (c) reconstructed shape.
Table 6 Qualitative summary of comparing SfM point cloud models and still photographs vs. laser scanning point cloud model.
Cost
Laser scanning point cloud
SfM cloud + still photographs
Data collection cost Data processing cost (Registration)
8~16 man-hours * O**(s)
Technology implementation cost
O(10,000~130,000 USD)
0~1 man-hour O(min ~ h) on a single machine+ O(min) with parallel computing Cost of a consumer camera O(100~500 USD) None Point cloud = 1~100 MB(s) per experiment Photographs = 0.1~1 GB per experiment High/Sparse to normal *** Fully automated • Progress monitoring data collection • Quality Control • Remote visual inspection • Remote decision making • Static/dynamic progress visualization • Rapid/Comprehensive emergency building assessment • Site logistics visualization • Construction crew and machinery productivity analysis • Static/Dynamic safety analysis No No
Level of automation Storage space
Manual intervention for noise reduction/removal Point cloud = 1~2 GBs per experiment
Accuracy/Resolution Alignment of photos with point cloud model Applications
Very High/Dense Manual • Progress monitoring data collection • Quality Control • Alignment/Defect inspection • Static progress visualization • Comprehensive emergency building assessment • Static safety analysis
Need for training to operate Add new project management task
Yes Yes, both for collection and processing laser scanning data
* May require two workers simultaneously operating it. ** Order of. *** Could be dense if either the number of photographs is increased or high resolution photographs are used. + Computation time on a single machine is an exponential function of the number of photographs used.
process of generating point cloud models is fully automated. Although an image-based point cloud model is less accurate compared to a laser scanner point cloud model, yet it provides the opportunity of automatically visualizing the as-built scene through geo-registered site photographs with much less effort and no cost. The joint representation of the point cloud and imagery models in addition to the possibility of extracting semantic information from these georegistered imagery is an improvement to existing photogrammetric
techniques or manual alignment of photos with laser scanner point cloud models. Such an integrated visualization can certainly facilitate remote decision makings. 6. Conclusions This paper presents a new image-based 3D reconstruction approach based on Structure-from-Motion (SfM) and compares it application
M. Golparvar-Fard et al. / Automation in Construction 20 (2011) 1143–1155
with a laser scanner. Eight sets of 3D spatial models, four on actual construction projects and four in laboratory settings were generated. These spatial models were further analyzed to generate 3D CAD surface models. As a stepping stone for a complete as-built model visualization and progress monitoring, these models were compared for accuracy and usability. It is demonstrated that in both laboratory and actual field experiments, the accuracy of using the image-based point cloud models is less than the point cloud generated by the laser scanner, while both approaches allow the as-built environment to be visualized from different viewpoints. In addition, the presented image-based reconstruction approach, automatically overlays hi-resolution photographs to 3D point cloud models. Applying this technique and utilizing existing site photographs for progress monitoring, productivity measurement, as well as QC/QA and safety monitoring, provides project management with a remarkable opportunity on visualization of the as-built data. In order to fully automate the monitoring process, as-planned models need to be properly registered with as-built point cloud models. Such registration allows pose of the searched objects in the as-built model to be known a priori and significantly improves progress monitoring. Particularly when registration of as-planned Building Information Models is considered, benefits are amplified. Such an augmented environment can be used for automatic data collection, processing and reporting. More questions remain to be addressed and additional research is required for algorithms that fully-automatically extract conventional or parametric CAD objects from laser scanners or imagebased point cloud models. Optimizing the SfM algorithms for generating higher-quality point cloud models with less computational costs must be further investigated as well. Acknowledgements Authors like to thank Turner Construction Co. and Leica Geosystems Inc. for their contributions to this research project. This work was partially funded by the National Science Foundation grants CMMI0800500, CMS-0324501, CMS-0427089 and CMMI-0800858. Any opinions, findings, and conclusions or recommendations expressed in this paper are those of the authors and do not necessarily reflect the views of the National Science Foundation or the companies mentioned above. References [1] Y. Cho, C. Haas, K. Liapi, S. Sreenivasan, A framework for rapid local area modeling for construction automation, Automation in Construction 11 (6) (2002) 629–641. [2] Z. Zhu, I. Brilakis, Comparison of civil infrastructure optical-based spatial data acquisition techniques, Journal of Computing in Civil Engineering 261 (88) (2007) 737–744. [3] M. Golparvar-Fard, F. Peña-Mora, S. Savarese, D4AR- A 4-dimensional augmented reality model for automating construction progress monitoring data collection, processing and communication, Journal of Information Technology in Construction, Special issue in Next Generation Construction IT (14) (2009) 129–153. [4] F. Bosche, C. Haas, Automated retrieval of 3D CAD model objects in construction range images, Automation in Construction 17 (4) (2008) 499–512. [5] S. Kiziltas, B. Akinci, E. Ergen, P.O. Tang, Technological assessment and process implications of field data capture technologies for construction and facility/ infrastructure management, Journal of Information Technology in Construction, Special issue Sensors in Construction and Infrastructure Management (13) (2008) 134–154. [6] J. Teizer, C. Kim, C. Haas, K. Liapi, C. Caldas, Framework for real-time threedimensional modeling of infrastructure, Geology and Properties of Earth Materials, Transportation Research Board National Research Council, Washington, 2005, pp. 177–186. [7] E. Jaselskis, Z. Gao, Pilot study on laser scanning technology for transportation projects, Proc., the Mid-Continent Transportation Research Symposium, Ames, Iowa, August, 2003. [8] F. Bosche, C. Haas, B. Akinci, Automated recognition of 3D CAD objects in site laser scans for project 3D status visualization and performance control, ASCE, Journal of Computing in Civil Engineering 23 (6) (2009) 311–318. [9] S. El-Omari, O. Moselhi, Integrating 3D laser scanning and photogrammetry for progress measurement of construction work, Automation in Construction 18 (1) (2008) 1–9. [10] P. Debevec, C. Taylor, J. Malik, Modeling and rendering architecture from photographs: a hybrid geometry- and image based approach, Proc., SIGGRAPH, 1996, pp. 11–20.
1155
[11] D.G. Aguilera, J.G. Lahoz, Laser scanning or image-based modeling? A comparative through the modelization of San Nicolas Church, Proc., ISPRS Commission V Symposium of Image Engineering and Vision Metrology, 2006. [12] F. Dai, M. Lu, Photo-based 3D modeling of construction resources for visualization of operations simulation: case of modeling a precast façade, Proc: IEEE Winter Simulation Conference, 2008, pp. 2439–2446. [13] D. Lowe, Distinctive image features from scale-invariant feature points, International Journal of Computer Vision 60 (2) (2004) 91–110. [14] N. Snavely, S. Seitz, R. Szeliski, Finding path through the world's photos, Proceedings of ACM Transactions on Graphics (SIGGRAPH 2008) 27 (3) (2008) 11–21. [15] S. Snavely, S. Seitz, R. Szeliski, Modeling the world from internet photo collections, International Journal of Computer Vision (2007). [16] M. Brown, D. Lowe, Unsupervised 3D object recognition and reconstruction in unordered datasets, Proc., International Conference on 3D digital imaging and modeling, 2005, pp. 56–63. [17] M. Golparvar Fard, F. Peña-Mora, Application of visualization techniques for construction progress monitoring, Proceedings of the ASCE International Workshop on Computing in Civil Engineering, Pittsburgh, PA 261 (27) (2007) 216–223. [18] J.S. Bohn, J. Teizer, Benefits and barriers of construction project monitoring using hiresolution automated cameras in print, ASCE Journal of Construction Engineering and Management (2009)http://dx.doi.org/10.1061/(ASCE)CO.1943-7862.0000164. [19] M. Golparvar-Fard, F. Peña-Mora, C. Arboleda, S. Lee, Visualization of construction progress monitoring with 4D simulation model overlaid on time-lapsed photographs, ASCE Journal of Computing in Civil Eng., Special Issue on Graphical 3D Visualization in AEC 23 (6) (2009) 391–404. [20] S. Leung, S. Mak, B. Lee, Using a real-time integrated communication system to monitor the progress and quality of construction works, Automation in Construction 17 (6) (2008) 749–757. [21] R. Hartley, A. Zisserman, Multiple View Geometry, Cambridge University Press, Cambridge, UK, 2004. [22] M. Pollefeys, L. van Gool, M. Vergaumen, F. Verbiest, K. Cornelis, J. Tops, R. Koch, Visual modeling with a hand-held camera, International Journal of Computer Vision 59 (3) (2004) 207–232. [23] C. Engels, H. Stewénius, D. Nistér, Bundle adjustment rules, Photogrammetric Computer Vision (PCV) (2006). [24] O. Faugeras, B. Mourrain, On the geometry and algebra of the point and line correspondences between N images, Proc., Fifth International Conference on Computer Vision, 1995, pp. 951–960. [25] B. Triggs, P. McLauchla, R. Hartley, A. Fitzgibbon, Bundle Adjustment—A Modern Synthesis, Proc., ICCV International Workshop on Vision Algorithms. SpringerVerlag, 1999, pp. 298–372. [26] A. Akbarzadeh, J.-M. Frahm, P. Mordohai, B. Clipp, C. Engels, D. Gallup, P. Merrell, M. Phelps, S. Sinha, B. Talton, L. Wang, Q. Yang, H. Stewenius, R. Yang, G. Welch, H. Towles, D. Nistér, M. Pollefeys, Proc: Third International Symposium on 3D Data Processing, Visualization and Transmission, 3DPVT, 2006. [27] W. Zhao, D. Nistér, S. Hsu, Alignment of Continuous Video onto 3D Point Clouds, IEEE Transactions on Pattern Analysis and Machine Intelligence (PAMI) 27 (8) (2005) 1305–1318. [28] W. Boehler, A. Marbs, Investigating laser scanner accuracy. institute for spatial information and surveying technology, University of Applied Sciences, Mainz, Germany, 2003. [29] M. Golparvar-Fard, F. Peña-Mora, S. Savarese, Sparse reconstruction and georegistration of daily site photographs for representation of as-built construction scene and automatic construction progress data collection, Proc., International Symposium on Automation and Robotics in Construction, Austin, TX, 2009. [30] K. Mikolajczyk, T. Tuytelaars, C. Schmid, A. Zisserman, J. Matas, F. Schaffalitzky, T. Kadir, L. van Gool, A comparison of affine region detectors, International Journal of Computer Vision 65 (½) (2005) 43–72. [31] J. Niebles, H. Wang, L. Fei-Fei, Unsupervised learning of human action categories using spatial–temporal words, Proc., British Machine Vision Conference (BMVC), 2006. [32] S. Savarese, L. Fei-Fei, 3D generic object categorization, localization and pose estimation, Proc., IEEE International Conference in Computer Vision (ICCV).— Brazil, 2007. [33] S. Arya, D. Mount, N. Netanyahu, R. Silverman, A. Wu, An optimal algorithm for approximate nearest neighbor searching fixed dimensions, Journal of the ACM 45 (6) (1998) 891–923. [34] M. Fischler, R. Bolles, Random sample consensus: a paradigm for model fitting with applications to image analysis and automated cartography, Communications of the ACM 24 (6) (1981) 381–395. [35] M. Lourakis, A. Argyros, The design and implementation of a generic sparse bundle adjustment software package based on the Levenberg–Marquardt algorithm (Technical Report 340), Inst. of Computer Science-FORTH, Heraklion, Crete, Greece, 2004, Available from, www.ics.forth.gr/~lourakis/sba. [36] D. Nistér, An efficient solution to the five-point relative pose problem, IEEE Transactions on Pattern Analysis and Machine Intelligence (PAMI) 26 (6) (2004) 756–770. [37] M. Goesele, N. Snavely, B. Curless, H. Hoppe, S. Seitz, Multi-view stereo for community photo collections, Proc., IEEE International Conference in Computer Vision (ICCV).—Brazil, 2007. [38] D. Nistér, A. Davison, Real-time motion and structure estimation from moving cameras, Tutorial at CVRP, 2005. [39] F. Boukamp, B. Akinci, Automated reasoning about construction specifications to support inspection and quality control, Automation in Construction 17 (1) (2007) 90–106.