The International Journal of Pavement Engineering and Asphalt Technology (PEAT) ISSN 1464-8164. Volume: 14, Issue: 2, December 2013, pp.11-35
EVALUATION OF TEST METHODS AND SELECTION OF AGGREGATE GRADING FOR TYPE III APPLICATION OF MICRO-SURFACING Masoud Robati, M.Eng, PhD Student ,École de technologie supérieure (ÉTS), Montreal, Canada,
[email protected] Alan Carter, B. Ing., M. Eng., Ph.D., Professor (ÉTS), Daniel Perraton, M. Sc., Ph.D., Professor (ÉTS)
doi: 10.2478/ijpeat-2013-0001
ABSTRACT Micro-Surfacing is a polymer modified, binder emulsion based, dense graded, cold mixed, and quick setting, asphalt resurfacing material. Type III application of microsurfacing is used as the rut fill materials for highly trafficked roads. As of now, International Slurry Surfacing Association (ISSA) mix design guideline is the widely used standard to design micro-surfacing mixtures. The research described in this paper intended to suggest modifications to the actual ISSA mix design procedure to accurately select aggregate grading for type III micro-surfacing mixtures. To do this, a sensitivity analysis was performed in order to study the effect of aggregate gradation, and binder emulsion residue on five micro-surfacing mixture design tests, including Loaded wheel test (ISSA TB 109), Wet track abrasion test (ISSA TB 100), modified cohesion test (ISSA TB 139), vertical displacement test (ISS TB 109, Method-A), and Mixing time test (ISSA TB 113). The second part of study consisted mainly of establishing a limit for the aggregate gradation used in type III application of micro-surfacing, which gives higher resistance to rutting as it is the main property of type III micro-surfacing. In order to do this, the resistant of different micro-surfacing mixtures against rutting was evaluated, and modified specifications were suggested to select aggregate grading for type III microsurfacing.
1. INTRODUCTION Pavement preservation is defined as a program employing a network-level, long-term strategy that enhances pavement performance by using an integrated, cost-effective set of practices that extend pavement life, improve safety, and meet motorist expectations (FHWA, 2005). Actions used for pavement preservation include routine maintenance, preventive maintenance (PM), and corrective maintenance (Uzarowski et al, 2007). Transportation agencies use chip seal, slurry seal, micro-surfacing, cape seal, fog seal, etc. Micro-surfacing was developed in an attempt to form a thicker slurry seal that could be used in wheel paths, and ruts in order to avoid long rehabilitation work on high traffic roads. To do this, high quality aggregates, and advanced binder emulsions were incorporated in order to reach a stable product, which is applied in multi-stone thickness, Page | 11 Unauthenticated | 96.22.13.112 Download Date | 5/12/14 3:03 AM
The International Journal of Pavement Engineering and Asphalt Technology (PEAT) ISSN 1464-8164. Volume: 14, Issue: 2, December 2013, pp.11-35
and provide rutting resistance. Micro-surfacing was also pioneered in Germany, in the late 1960s and early 1970s (International Slurry Surfacing Association, 2011). Microsurfacing was the result of combining highly selected aggregates, and binder emulsion modified with incorporating special polymers. The binder emulsion also includes emulsifiers that allowed the aggregate-binder emuslion product to remain stable even when applied in multi-stone thicknesses. Micro-surfacing was introduced in the United States in 1980, as a cost-effective way to treat the surface wheel-rutting problem and a variety of other road surface problems (International Slurry Surfacing Association, 2011). Micro-surfacing is applied in double layer for addressing surface irregularities. Moreover, micro-surfacing has variety of applications where fast traffic times are of concern. It also can apply on concrete bridge decks, airports runways and night works.
2. BACKGROUND Several mix design guidelines have already been developed to design micro-surfacing mixtures. International Slurry Surfacing Association (ISSA), Texas Transportation Institute (TTI), American Socitey for Testing and Materials (ASTM), and California Departement of Tansport (Caltrans) developed their own mix design procedures for micro-surfacing. However, ISSA A-143 (ISSA A-143, 2005) guideline, and specification is the most widely used mix design procedure for micro-surfacing. The components of the mixture are tested first. Based on this standard, aggregate gradation for the micro-surfacing mixture has to conform to one of the two gradations given in Table 1. It should be noted that Type III aggregate gradation is coarser, and more appropriate for application of micro-surfacing to fill rut on road areas with high traffic loading. Table 1. ISSA Type II and III aggregate gradation for Micro-surfacing (ISSA A143, 2005) Sieve Size In 3/8 No. 4 No. 8 No. 16 No. 30 No. 50 No. 100 No. 200
mm 9.500 4.750 2.360 1.180 0.600 0.300 0.150 0.075
Proportion Passing (% by mass) Type II Type III 100 100 90-100 70-90 65-90 45-70 45-70 28-50 30-50 19-34 18-30 12-25 10-21 7-18 5-15 5-15
Page | 12 Unauthenticated | 96.22.13.112 Download Date | 5/12/14 3:03 AM
Stockpile Tolerance,% +/- 5 +/- 5 +/- 5 +/- 5 +/- 4 +/- 3 +/- 2
The International Journal of Pavement Engineering and Asphalt Technology (PEAT) ISSN 1464-8164. Volume: 14, Issue: 2, December 2013, pp.11-35
ASTM D 6372-99a (ASTM, 1999) is the most widely used procedure for the design of micro-surfacing. This mix design procedure recommends exactly the same aggregate grading with that of suggested by ISSA (REfrence??). Texas Transportation Institute (TTI) recommended a new mix design procedure for micro-surfacing in early 1994 (TTI, 2005). Following a study on the reliability of determining mixture quality of microsurfacing with the ISSA mix design procedure for micro-surfacing, they developed a new mix design procedure which is somewhat different from ISSA and ASTM mix design procedures. Similar to other ISSA and ASTM procedures, the components of the mixture are tested first. The gradations proposed by TTI are shown in Table 2. Table 2. TTI Type II and III aggregate gradation for Micro-surfacing (TTI, 2005) Sieve Size In 3/8 No. 4 No. 8 No. 16 No. 30 No. 50 No. 100 No. 200
Mm 9.500 4.750 2.360 1.180 0.600 0.300 0.150 0.075
Proportion Passing (% by mass) Type II Type III 100 100 98-100 99-100 75-90 45-65 50-75 25-46 30-50 15-35 18-35 10-25 10-21 7-18 5-15 5-15
Stockpile Tolerance (%) +/- 5 +/- 5 +/- 5 +/- 5 +/- 3 +/- 3 +/- 3 +/- 2
It should be noted from Table 2 that the aggregate gradation recommended by TTI design procedure for micro-surfacing is different from the gradations recommended by ISSA and ASTM. These aggregate gradations are finer for sieve sizes 3/8 in to #16 than those used in ASTM and ISSA methods. Caltrans developed a single mix design procedure for both slurry seal and microsurfacing (CALTRANS, 2004). Caltrans research team considers that the procedures are the same for both slurry seal and micro-surfacing systems. Similar to other mix design procedures, the components of the mix are tested first. Aggregate gradation, binder emulsion, and their chemical characteristics has to conform to ISSA specification for slurry seal and micro-surfacing. Other countries such as Germany, France, United Kingdom, and South Africa have had experience with Slurry Seal and Micro-surfacing systems, and have developed specific guidelines for their specific use. Transport Quebec from Canada developed its own mix design procedure for micro-surfacing. However, among all these guidelines, ISSA and ASTM are commonly used mix design guidelines worldwide.
Page | 13 Unauthenticated | 96.22.13.112 Download Date | 5/12/14 3:03 AM
The International Journal of Pavement Engineering and Asphalt Technology (PEAT) ISSN 1464-8164. Volume: 14, Issue: 2, December 2013, pp.11-35
3. OBJECTIVE The first objective of this study was to examine the effect of aggregate gradation, and binder emulsion residue on the properties of micro-surfacing mixtures. Three different aggregate gradations and three levels of binder emulsion residues were used in the first part of this study to formulate different micro-surfacing mixtures. The gradations were selected within the ISSA gradation size limit for type III micro-surfacing to fill rutting distresses on surface pavement of roads located at areas subjected to high traffic loading. The goal was to formulate, and evaluate a micro-surfacing mixture with maximum resistance to rut permanent deformation. The second objective of this study was to recommend specification to select aggregate grading for type III micro-surfacing. The goal was to evaluate the effect of aggregate grading on properties of micro-surfacing mixtures, and to modify the existing ISSA specification to select aggregate gradation for type III micro-surfacing mixture as high quality rut filling materials.
4. MATERIALS USED IN STUDY All the materials used in the sample preparation represent typical materials utilized for micro-surfacing projects in Quebec. The aggregates used in the study were Ray-Car (0-5 mm), obtained from Montreal, Quebec, with same gradation satisfies type III requirements for aggregate gradation of ISSA mix design guideline. Virgin aggregates was washed through sieve #200 to remove all their filler content and dried in an oven to a constant weight for a period of 24 hours. The temperature of oven was set at 60°C to dry virgin aggregates. Materials were then cooled at room temperature and screened through sieves number 3/8 (9.5 mm), 4 (4.75 mm), 8 (2.5 mm), 18 (1.25 mm), 16 (0.63 mm), 30 (0.6 mm), 50 (0.315), 100 (0.16 mm), and 200 (0.08 mm) respectively to obtain desired UG, MG, and LG gradations within the maximum and minimum aggregate gradation limits suggested by ISSA for type III Micro-surfacing application. Filler were obtained from DJL Construction Company in Montreal, Quebec. In all micro-surfacing mixtures prepared in this study, desired amount of commercial filler were added to aggregates in order to obtain desire aggregate gradation. All the mix components such as amount of added water, binder emulsion residue, aggregate, and Portland cement were selected based on a new mix design procedure developed by writer (Robati, 2011). Figure1 and table 4 show the gradation curves, and ISSA standard for the aggregates used in this study. The first gradation, MG, follows the middle of maximum and minimum aggregate gradation limits suggested by ISSA for Type III Micro-surfacing application and is considered as mid-range aggregate gradation. The second gradation, UG, follows the between the middle and upper limit of the type III gradation band for micro-surfacing. The third gradation, LG, was selected between the middle, and the lower limit of the type III gradation. Using these three gradations, it was possible to provide better handling, and control of the micro-surfacing mixture properties. The total aggregate surface area was calculated using specific factors recommended by ISSA in Table 3. Page | 14 Unauthenticated | 96.22.13.112 Download Date | 5/12/14 3:03 AM
The International Journal of Pavement Engineering and Asphalt Technology (PEAT) ISSN 1464-8164. Volume: 14, Issue: 2, December 2013, pp.11-35
Table 3. Factors Used in Calculating Surface Area of Slurry Seal Aggregate (ISSA TB 111, 2011) Sieve No & Size
Surface Area Factors
in
Mm
ft2/lb
m2/kg
3/8 No. 4 No. 8 No. 16 No. 30 No. 50 No. 100 No.200
9.500 4.750 2.360 1.180 0.600 0.300 0.150 0.075
2 2 4 8 14 30 60 160
0.41 0.41 0.82 1.64 2.87 6.14 12.29 32.77
Table 4. Gradations of the aggregates used in this study Sieve No & Size
% Passing by Weight
in
Mm
UG
MG
LG
Type III
Stockpile Tolerance,%
3/8 No. 4 No. 8 No. 16 No. 30 No. 50 No. 100 No.200
9.500 4.750 2.360 1.180 0.600 0.300 0.150 0.075
100 91 69 49 36 26 17 12.5
100 88 63 44 33 23 14 10
100 84 56 38 29 19 10 7.5
100 70-90 45-70 28-50 19-34 12-25 7-18 5-15
− +/- 5 +/- 5 +/- 5 +/- 5 +/- 4 +/- 3 +/- 2
11
9.2
7.4
−
−
Total Aggregate Surface Area (m²/kg)
Page | 15 Unauthenticated | 96.22.13.112 Download Date | 5/12/14 3:03 AM
The International Journal of Pavement Engineering and Asphalt Technology (PEAT) ISSN 1464-8164. Volume: 14, Issue: 2, December 2013, pp.11-35
100
Passing Percentage (PP%)
90 80
70
Max
60
50 40
Min
30 20 10 0 0.01
0.1
1
10
Sieve Sizes (milimetres) Minimum Limit
Maximum Limit
Upper Gradation (UG)
Lower Gradation (LG)
Mid-range Gradation (MG)
Figure 1. Upper, Lower, and Middle aggregate gradation curves (0-5 mm size) The binder emulsion type used in all cases is a special cationic quick setting, low viscous binder emulsion, with a hard base binder, which is modified with styrene butadiene rubber (SBR) polymer in the form of latex liquid. CQS-lHP is the commercial name of this binder emulsion, which was bought from McAsphalt Industries Limited in Montreal. In designing micro-surfacing mixtures base on ISSA specifications, the residual binder content of the emulsion must be more than 62.0%. CQS-1HP binder emulsion used in this study has 65.1% residual binder content, according to test results provided by McAsphalt Engineering Services. Other properties of CQS-1HP binder emulsion have been listed in Table 5. As it can be seen from table 5, the binder emulsion used in this study is considered as a low viscous emulsion, which has high ability of coating the aggregates. This specially designed binder emulsion break and set quickly in contact with aggregate surface area, so that, the road surface treated with micro-surfacing mixture can be open to the traffic in less than an hour after repair. The CQS-1HP binder emulsion can be used for slurry seal, Type II and III micro surfacing as the pavement preservation and surface treatment methods.
Page | 16 Unauthenticated | 96.22.13.112 Download Date | 5/12/14 3:03 AM
The International Journal of Pavement Engineering and Asphalt Technology (PEAT) ISSN 1464-8164. Volume: 14, Issue: 2, December 2013, pp.11-35
Table 5. CQS-1HP Binder Emulsion properties from supplier Tests
Results
ISSA Specifications min
max
Viscosity @ 25°C (SSF)
28.0
20
100
Sieve (%)
0.04
-
0.10
Coating Test (%)
90.0
80.0
-
65.1
62.0
-
Residue by Distiliation to 204.4°C (% by mass) Particle Charge Settlement, 5 day,%
Positive
Positive
0.9
-
5
63
57
-
1825
650
-
75
40
90
1.10+
0.4
-
Tests on Residue Softening Point by R 7 B (°C) Kinematic Viscosity @ 135°C (mm²/sec) Penetration @ 25°C, 100 g, 5 sec (1/10 mm) Ductility @ 25 °C (m)
5. EXPERIMENTAL DESIGN (DEPENDENT AND CONTROLLED VARIABLES) The first part of this study reports the findings of a detailed laboratory investigation concerning the effect of aggregate gradation, and binder emulsion residue on the design parameters, and properties of micro-surfacing mixtures. To do this, one aggregate type, three different aggregate gradations (UG, MG, and LG), and three level of binder emulsion residue were involved in the study in order to formulate nine different microsurfacing mixtures. Emulsified binder was kept constant to only investigate the effect of aggregate gradation, and binder emulsion on the properties of micro-surfacing mixtures. No Portland cement additives were used in mixtures. The second part of study consisted mainly of establishing a limit for the aggregate gradation used in Type III micro-surfacing, which gives higher resistance to rutting. To do this, the resistant of prepared mixtures against rutting is evaluated. Table 6 and 7, show the experimental design used in phase one and two of this study. A multilevel factorial design was selected. The aggregate gradation’s materials were treated as qualitative factor while the other remaining factors were quantitative.
Page | 17 Unauthenticated | 96.22.13.112 Download Date | 5/12/14 3:03 AM
The International Journal of Pavement Engineering and Asphalt Technology (PEAT) ISSN 1464-8164. Volume: 14, Issue: 2, December 2013, pp.11-35
Table 6. Design of Experiment (DOE), Factors involved in study Levels of Factors
Factors 1
2
3
A: Aggregate gradation
UG
MG
LG
B: Binder Emulsion Residue (%)
7.6
8.1
8.6
Table 7. Design of Experiment (DOE), Responses involved in study Test
Responses
ISSA TB
Wet track abrasion loss, 1-hour & 6-day soaked
100
Cohesion at 30 min and 60 min
139
Vertical and lateral deformation by LWT Sand adhesion by loaded wheel tester (LWT) Percent moisture retained in samples Mix time
147-A 109 113
Tables 8 shows, the proportions of each of 9 micro-surfacing mixture formulations used in first part of study. Table 8. Mix design formulation used for different tests Mixture No.
Aggregate Gradation
Binder Emulsion Residue (%)
1 2 3 4 5 6 7 8 9
MG LG UG MG LG UG MG LG UG
7.64 7.64 7.64 8.13 8.13 8.13 8.62 8.62 8.62
Added Water Content (%) 9 9 9 9 9 9 9 9 9
Table 9, represent a sample of mix design formulation used to prepare micro-surfacing mixture with MG gradation, and 12.5% binder emulsion.
Page | 18 Unauthenticated | 96.22.13.112 Download Date | 5/12/14 3:03 AM
The International Journal of Pavement Engineering and Asphalt Technology (PEAT) ISSN 1464-8164. Volume: 14, Issue: 2, December 2013, pp.11-35
Table 9. A sample of mix design formulation used for micro-surfacing mixture prepared using MG gradation, and 12.5% binder emulsion Mix components
Wet track abrasion test
Loaded Wheel Test
Modified cohesion test
Percentage (%) Aggregate Binder emulsion Portland Cement Water
100 12.5 0 9
Aggregate Binder emulsion Portland Cement Water
700 87.5 0 63
100 12.5 0 9
100 12.5 0 9
500 62.5 0 45
300 37.5 0 27
Weight (gr)
6. DESCRIPTION OF ISSA MIXTURE DESIGN TESTS EVALUATED The International Slurry Surfacing Association design technical bulletin A143 (ISSA A143, 2005), published in May 2005, contains guidelines for the laboratory evaluation of micro-surfacing mixture designs. The tests examined in this study include ISSA TB 139, 100, 147 (Method A). Generally, apparatus, materials, sample preparation, and testing procedures are the same as those expressed in the International Slurry Surfacing Association design technical bulletin A143, published in May 2005. 6.1 Modified Cohesion Test The cohesion test (ISSA TB 139, 2005) is used to classify micro-surfacing mixture to slow or fast setting systems. It also can be used to establish baseline formulations of binder emulsion, water, aggregate, and cement additives suitable for further testing. In other words, suitable binder emulsion-water combination is selected based on results obtained after 30 and 60 min of curing at room temperature, 25°C (77°F). The minimum values required are 1.2 kilogram-meters for the 30 minutes test, 2 kg-m for 60 min. Figure 2.a shows the modified cohesion tester used in this study. The 30-min modified cohesion test results is used to evaluate setting (flocculation) properties of microsurfacing mixtures, while, the 60-min cohesion values can be considered as evaluation of traffic time (i.e., early rolling traffic time occurs at a torque level of 2 kg-m). In this study, five identical specimens of each micro-surfacing formulation were mixed and casted in 10 mm x 60 mm diameters ring mold centered on the roofing felt squares and allowed to cure at room temperature. Torque measurement was made at suitable time intervals such as 30, 60, 90, 150, 210, and 270 minutes after casting. Figure 2-a shows the cohesion tester.
Page | 19 Unauthenticated | 96.22.13.112 Download Date | 5/12/14 3:03 AM
The International Journal of Pavement Engineering and Asphalt Technology (PEAT) ISSN 1464-8164. Volume: 14, Issue: 2, December 2013, pp.11-35
6.2 Wet Track Abrasion Test Wet track abrasion test (WTAT) (ISSA TB 100, 2005) is a field simulation test to measure the wearing qualities of micro-surfacing mixture under wet abrasion conditions. Wet track abrasion test establishes the minimum binder emulsion content necessary to prevent excessive raveling of cured micro-surfacing mixture. This test was conducted after curing the samples at l40°F (60°C) for one day. The sample was then soaked in the water for 1 h at ambient temperature. Figure 2.b shows the wet track abrasion machine used in this study. After completing the abrasion cycle, the specimen was removed from the pan and washed off debris with slow running water. The specimen was then placed in an oven at l40°F (60°C) to dry to a constant weight, and allowed to reach temperature and weighted. The difference between this new weight and the weight in grams obtained from before placing the sample in 77°F (25°C) water bath was reported as the abrasion loss of the specimen. Wet track abrasion test were performed on 1-hour soaked sample to determine susceptibility to moisture exposure. Figure 2-b shows the WTAT tester. 6.3 Loaded Wheel Test, Sand Adhesion Loaded wheel test (ISSA TB 109, 2005) measures the resistance of mixture against flushing under heavy traffic. This test establishes the maximum binder emulsion content necessary to prevent flushing of cured micro-surfacing mixtures. The mixture is compacted by means of a loaded, rubber tired, reciprocating wheel. The measured parameter is the sand adhesion, which is an indirect measure of the amount of excess binder in the mix. Figure 5.3 shows the loaded wheel test machine used in this study. The sample is prepared and oven dried at l40°F (60°C) for one day and allowed to be cold at room temperature for 1-hour. The sample was compacted using 1000 cycles of the 125 lb (56.7 kg) loaded wheel. The sample was weighed after compaction and the weight was recorded. Two hundred grams of fine Ottawa sand (ASTM Designation C-I09 graded standard) and metal strip were heated to 180°F (82.2°C) was uniformly spread over the sample surface, and sample was again compacted using the same load for 100 cycles. The specimen was removed from unit, and disassembled over a waste container and gently tapped to remove the un-adhered sand. The sample was again weighted, and new weight recorded. The difference between this new weight and the weight in grams obtained from after completion of 1000 cycles of the 125 lb (56.7 kg) loaded wheel was reported as the sand that had adhered to the specimen, which is an indirect measure of the amount of excess binder in the mixture. The temperature at which the tests have been performed must be reports as well. This test was conducted at 25°C that correspond to moderate traffic. Figure 2-c shows the LWT tester. 6.4 Multilayer Loaded Wheel Test Vertical & Lateral Displacement Multilayer Loaded Wheel test (Method A) (ISSA TB 147, 2005) measures the amount of compaction or displacement characteristics of micro-surfacing under simulated rolling traffic compaction. Because micro-surfacing can be used for filling ruts, it should have proper resistance against vertical and lateral deformations under heavy traffic. This test also establishes the minimum binder emulsion content necessary to prevent excessive Page | 20 Unauthenticated | 96.22.13.112 Download Date | 5/12/14 3:03 AM
The International Journal of Pavement Engineering and Asphalt Technology (PEAT) ISSN 1464-8164. Volume: 14, Issue: 2, December 2013, pp.11-35
deformation of micro-surfacing mixture. When a series of specimens, containing a different range of binder emulsion contents are tested, optimum emulsion content for rutting resistance can be determined at the minimum vertical and lateral displacements. The sample preparation and test procedure is exactly the same as for the loaded wheel test (sand adhesion). The only difference is the sample is room cured for 24 hours after the emulsion was broken at a temperature of l40°F (60°C). The mold specimen with nominal thickness of 12.7 mm was used in this study which represents the maximum limit for rutting on the road surface. The width and height of the specimen was measured (in the wheel path and at the mid-point of specimen length) before and after 1000 cycles of the 125 lb (56.7 kg) loaded wheel compaction. In this study, the width and height of the specimen were measured after 1000 cycles of the 125 lb (56.7 kg) loaded wheel compaction. It has been found that unconfined vertical deformation that exceeds 10% respectively is not satisfactory for compacted, multi-layer applications according to the recommendations of ISSA TB 147 (Method A). Multilayer Loaded Wheel Test Vertical & Lateral Displacement was conducted at 25°C.
(a )
(b )
(c )
Figure 2. Micro-surfacing equipment used in this study. (a): Modified cohesion tester, (b): Wet track abrasion tester, (c): Loaded wheel tester.
Page | 21 Unauthenticated | 96.22.13.112 Download Date | 5/12/14 3:03 AM
The International Journal of Pavement Engineering and Asphalt Technology (PEAT) ISSN 1464-8164. Volume: 14, Issue: 2, December 2013, pp.11-35
7. RESULTS AND DISCUSSION Analysis of results was conducted using Analysis of Variance (ANOVA) by STAT Graphic software (version 10). Output of ANOVA is a model including independent variables (Factors), and dependent variable (Responses). In this model, those independent variables affecting the dependent variables are determined by ANOVA at a specified confidence level. ANOVA uses the correlation (R²) to predict the future outcomes of the model on the basis of the other related information. Outputs of ANOVA used in this study are ANOVA table, standardized Pareto chart, main effect plot, and estimated response. ANOVA table show the statistical calculation of R², the sum of squares, the mean of squares, and the F-value. Standardized Pareto chart evident the standardized effect of each effect group on the results. The red line on standardized Pareto chart represents the estimated critical F-value. The main effect plot and the estimated response tabulate the actual effect of factors involved in study on the results. 7.1 Direct effects of binder emulsion and aggregate gradation on the test responses Figure 3 to 9 show the plots of raw data for the effect of binder emulsion and aggregate gradation on the test responses. As can be seen from Figure 3 showing the change with binder emulsion residue, and the aggregate gradation in the mixture has a profound influence on the adhered sand to the sample. To take into account the effect of aggregate gradation, the total aggregate surface area of UG, MG, and LG gradations were already calculated (Table 3). The total aggregate surface area represents the only variation between UG, MG, and LG gradations. Figure 3 shows that, when the amount of binder emulsion residue increased in the mixes, more sand adhered tended to the sample, which inversely shows higher risk of a flushed surface (rich binder) for the micro-surfacing mixture. An inverse trend was observed when the total aggregate surface area was increased from 7.4 to 11 m²/kg, for the mixtures prepared using LG and UG aggregate gradations, respectively. As the total amount of aggregate surface area increased, the amount of adhered sand decreased, indicating lower risk of flushing for mix. Figure 4 shows the plot of raw data for Wet Track Abrasion test results (1-hour soaked samples). By increasing the amount of binder emulsion residue, aggregate loss decreased. As it also can be seen from this figure, when the amount of total aggregate surface area increased, the aggregate loss of sample also increased. In the case of mixes prepared using LG aggregate gradation, when the binder emulsion residue increased in the mix, the aggregate loss increased. This is due to presence of high amount of free binder emulsion in mix, which is not adsorbed by the surface of aggregates, and postponed the set and curing of the mix.
Page | 22 Unauthenticated | 96.22.13.112 Download Date | 5/12/14 3:03 AM
Sand adhered (g/m²)
The International Journal of Pavement Engineering and Asphalt Technology (PEAT) ISSN 1464-8164. Volume: 14, Issue: 2, December 2013, pp.11-35
600 550 500 450 400 350 300 250 200 150 100 7.6
8.1
8.6
Binder Emulsion Residue (%) Upper Gradation (UG)
Middle Gradation (MG)
Lower Gradation (LG)
Aggregate Loss (g/m²)
Figure 3. Plot of raw data for Loaded Wheel Test 400 350 300 250 200 150 100 50 0
7.6
8.1
8.6
Binder Emulsion Residue (%) Upper Gradation (UG)
Middle Gradation (MG)
Lower Gradation (LG)
Figure 4. Plot of raw data for WTAT 1-Hour Soaked The primary purpose of LWT and WTAT are to, respectively, determine maximum and minimum limit for adding binder emulsion in the mixture. LWT and WTAT are used in ISSA TB 111 (ISSA TB 111, 2005), and ISSA TB 143 (ISSA TB 143) mix design procedures for slurry seal and micro-surfacing in order to determine the optimum binder content for mix. In the above mentioned guidelines, the WTAT will be performed at 1hour and 6-day soak periods followed by tests using the LWT to determine the excess binder at different temperatures. Finally, the optimum binder content is selected by evaluating the abrasion loss in the WTAT, and the binder content versus pick up from the loaded wheel tester. However, when designer prepare trial mixtures with different amount of binder emulsion, the sensitivity of test results to the binder change is more in the case of LWT than that of Page | 23 Unauthenticated | 96.22.13.112 Download Date | 5/12/14 3:03 AM
The International Journal of Pavement Engineering and Asphalt Technology (PEAT) ISSN 1464-8164. Volume: 14, Issue: 2, December 2013, pp.11-35
WTAT. In other words, the consistency for wet track abrasion test results is poor, which may lead to inaccurate selection of optimum binder content using ISSA TB 111 and ISSA TB 143 mix design procedures.
Moisture Retained in LWT Samples (%)
Figure 5 and 6 show the plot of raw data for results of Relative Moisture Retained in samples of LWT and WTAT. The results showed that the relative proportion retained moisture after 24 hours curing, expressed as percent by weight of the initial available moisture (initial added moisture + water portion of binder emulsion) ranges between 1.96 and 3.16% for LWT samples, and 1.13 and 1.47% for WTAT samples. Also, in the case of micro-surfacing mixtures prepared using UG, MG, and LG aggregate gradations, the relative retained moisture in LWT samples after 24 hours curing increased as the amount of binder emulsion residue increased. This brings a big error in calculating the amount of optimum binder for micro-surfacing mixtures using LWT, because, the test results are not only sensitive to the changing of the binder, but also, are sensitive to the retained moisture in the sample. Primary reason for the inconsistency of loaded wheel test (Sand Adhesion) results is the galvanized steel materials used in fabricating the specimen mounting plates in the loaded wheel test prevent moisture evaporation from mixture during the breaking process of the emulsion. Retained moisture in loaded wheel Test specimens was higher than that of retained moisture in Wet Track abrasion Test specimens, which uses saturated roofing felt materials in fabricating the specimen mounting plates. It was also observed that, as the amount of binder emulsion residue increased in the mixtures, there is an optimum amount of moisture retained in the WTAT sample. While, by increasing the amount of binder emulsion residue, it was observed that the moisture content of system increased in the case of LWT sample. 3.4 3.2 3 2.8 2.6 2.4 2.2 2 7.6
8.1
8.6
Binder Emulsion Residue (%) Upper Gradation (UG)
Middle Gradation (MG)
Lower Gradation (LG)
Figure 5. Plot of Raw data for Retained Moisture in LWT
Page | 24 Unauthenticated | 96.22.13.112 Download Date | 5/12/14 3:03 AM
Moisture Retained in WTAT Samples (%)
The International Journal of Pavement Engineering and Asphalt Technology (PEAT) ISSN 1464-8164. Volume: 14, Issue: 2, December 2013, pp.11-35
1.9 1.8 1.7 1.6 1.5 1.4 1.3 1.2 1.1 1 7.6
8.1
8.6
Binder Emulsion Residue (%) Upper Gradation (UG)
Middle Gradation (MG)
Lower Gradation (LG)
Figure 6. Plat of raw data for Retained Moisture in WTAT Figure 7 and 8 show the plot of raw data for 30 and 60-min cohesion test results. Modified cohesion test results at 30 and 60 min show that, when the binder emulsion residue increased, there observed an optimum amount of 30-min and 60-min cohesions, for the mixes prepared using MG aggregate gradation. In the case of mixes made with UG aggregate gradation, when the binder emulsion residue increased, the cohesion increased. For mixes made with LG aggregate gradation, when the amount of binder emulsion residue increased, the cohesion of mix slightly decreased. This is the reason why the aggregate loss increased, when the binder emulsion residue increased for the case of mixes prepared with UG aggregate gradation shown in Figure 4. The cohesion of micro-surfacing mixtures is an important property that can be used to select different mix proportions. Normally, the micro-surfacing mix proportions are selected, so that, the 30 and 60 minutes’ cohesions of mixture reach to the maximum amounts. For the design to be accepted, the amount of 30 and 60-min cohesion must be, respectively, higher than 1.2 and 2 kg-m. In this study, the micro-surfacing mix prepared using MG aggregate gradation and 8.1% binder emulsion residue, plus that of prepared with UG aggregate gradation and 8.6% binder emulsion residue had maximum amount of 30-min and 60-min cohesion. However, further testing was required to find the optimum mix proportions with regard to the rutting resistance, which is the main property, required of Type III micro-surfacing mixtures in areas with high traffic.
Page | 25 Unauthenticated | 96.22.13.112 Download Date | 5/12/14 3:03 AM
Cohesion at 30 min (kg-m)
The International Journal of Pavement Engineering and Asphalt Technology (PEAT) ISSN 1464-8164. Volume: 14, Issue: 2, December 2013, pp.11-35
2 1.8 1.6 1.4 1.2 1 0.8 0.6 0.4 0.2 0 7.6
8.1
8.6
Binder Emulsion Residue (%) Upper Gradation (UG)
Middle Gradation (MG)
Lower Gradation (LG)
Cohesion at 60 min (kg-m)
Figure 7. Plot of Raw data for Cohesion test at 30 min
2.5 2 1.5
1 0.5 0 7.6
8.1
8.6
Binder Emulsion Residue (%) Upper Gradation (UG)
Middle Gradation (MG)
Lower Gradation (LG)
Figure 8. Plot of Raw data for Cohesion test at 60 min Figure 9 shows the plot of raw data for mixing time test results. Mixing Time test results show that effect of aggregate gradation is more significant than that of binder residue effect. The result of mixing time ranges from 64 to 686 s. as it can be seen from figure 9, in the case of mixes prepared using LG aggregate gradation, mixing time increased more than other mixes. This is due to presence of higher free asphalt emulsion in the mix compared with mixes made with UG and MG gradation, which postpones breaking of binder emulsion, reduces the properties of mix
Page | 26 Unauthenticated | 96.22.13.112 Download Date | 5/12/14 3:03 AM
Mixing Time (s)
The International Journal of Pavement Engineering and Asphalt Technology (PEAT) ISSN 1464-8164. Volume: 14, Issue: 2, December 2013, pp.11-35
800 700 600 500 400 300 200 100 0 7.6
8.1
8.6
Binder Emulsion Residue (%) Upper Gradation (UG)
Middle Gradation (MG)
Lower Gradation (LG)
Figure 9. Plot of raw data for Mixing time test Based on ISSA mix design guideline, for design to be accepted, mixing time of mixture must be more than 120 second (2 minutes). It was observed that, mixes prepared with LG aggregate gradation provided long mixing time before the mixture broke. This is mainly due to very low aggregate surface area of mixes prepared with LG gradation. 7.2 Analysis by mixture materials When analysis all the data together, it came that the binder emulsion and total aggregate surface area have high influences on the test responses (Figure 3 to 9). The mixture materials such as binder emulsion residue and aggregate surface area are discontinuous factors; therefore, it was necessary to perform the analysis by materials to better investigate the effect of these two factors on the test responses. Figures 10 to 15 show the significant effect of binder emulsion residue and aggregate surface area on the test results. The Letter “A” in the figures represent the effect of aggregate surface area on the test responses, while, the letter “B” represent the effect of binder emulsion residue. If there is interaction between the effect of aggregate surface area and binder emulsion residue, the effect of this interaction on the test results is shown by the letter “AB”. The letters “AA” and “BB” represent, respectively, the squares of the effect of the aggregate surface area and binder emulsion residue on the test results. Figure 10 to 13; show the significant effect of binder emulsion residue and total aggregate surface area on the result of loaded wheel test, wet track abrasion test, and retained moisture on both LWT and WTAT samples. The interesting fact is that the effect of interaction between the effect of aggregate surface area and binder emulsion residue is also significant, which makes it difficult for the designer to select the optimum amount of binder emulsion residue using LWT and WTAT. The other interesting fact is that the effect of aggregate surface area on the test
Page | 27 Unauthenticated | 96.22.13.112 Download Date | 5/12/14 3:03 AM
The International Journal of Pavement Engineering and Asphalt Technology (PEAT) ISSN 1464-8164. Volume: 14, Issue: 2, December 2013, pp.11-35
results was observed to be higher than that of the effect of binder emulsion residue for all the mixture tests (Figure 10 to 15). The reason for this is because of the interaction between binder emulsion and aggregate surface area in the micro-surfacing mixtures. During the flocculation (setting) and coalescence (curing) of the binder emulsion, total aggregate surface area plays an important role. In the breaking of CQS-1HP grade binder emulsion, free emulsifier adsorbs onto the (oppositely charged) aggregate surface area, which neutralizes some charge on the surface of binder molecules, causing the binder molecules to eventually set on the aggregate surface area (Figure 16). Too low aggregate surface area in relation to the binder emulsion molecules can actually reverse the charge on the minerals and so inhibit the setting of the emulsion. Also too high aggregate surface area causes the charge on the emulsion droplets to be quickly destroyed by pH changes; then, the binder emulsion molecules very quickly set and curing of the system begins to occur at a slower rate. Therefore, the aggregate surface area for a mixture like micro-surfacing should be selected carefully. The total amount of aggregate surface area is highly dependent of the filler content of the aggregates.
Figure 10. Pareto chart (Loaded Wheel Test)
Figure 11. Pareto chart (Wet Track Abrasion 1-Hour soaked)
Page | 28 Unauthenticated | 96.22.13.112 Download Date | 5/12/14 3:03 AM
The International Journal of Pavement Engineering and Asphalt Technology (PEAT) ISSN 1464-8164. Volume: 14, Issue: 2, December 2013, pp.11-35
Figure 12. Retained Moisture (Loaded Wheel test samples)
Figure 13. Pareto chart (Retained Moisture WTAT samples 1-Hour Soaked)
Figure 14. Pareto chart (Cohesion test at 30 min)
Figure 15. Pareto chart (Cohesion test at 60 min)
Figure 16. Possible stages in the setting of a cationic emulsion (Delmar R., 2013)
8. RESULT SUMMARY As has been shown, the impact of the amount of binder emulsion residue, and the aggregate gradation to micro-surfacing mixture properties are quite important. A Page | 29 Unauthenticated | 96.22.13.112 Download Date | 5/12/14 3:03 AM
The International Journal of Pavement Engineering and Asphalt Technology (PEAT) ISSN 1464-8164. Volume: 14, Issue: 2, December 2013, pp.11-35
summary of the results presented in the previous sections is shown in table 10. Total aggregate surface area, and its square have a significant effect on the results of loaded wheel test, wet track abrasion test, mixing time test, and moisture retained in LWT and WTAT. As for modified cohesion test (30-min and 60-min), binder emulsion residue has a significant effect on the test results. It is important to note that those results are valid only for the different materials used in this study. If one uses another type of emulsion which reacts differently with another type of aggregates, the results may vary. The results are also only valid in the range of added binder emulsion and aggregate gradation used in this study. On the other hand, the different values that were used are commonly used and are the quantities that give overall optimum results. Table 10. Results summary for all tests done on micro-surfacing shown in this study Significant effect of Aggregate surface Area (A)
Binder Emulsion Residue (B)
Loaded wheel test (LWT)
yes1
yes
Wet track abrasion (1 hour soaked)
yes1
yes
yes1
yes
yes1
yes1
Modified cohesion at 30 minutes
yes
no
Modified cohesion at 60 minutes
yes1
no
Test
Relative moisture retained (LWT samples) Relative moisture retained (WTAT samples)
1
Trend
B ↑ : adhered sand ↑ A ↑: adhered sand ↓ B ↑: aggregates loss ↓ A ↑: aggregates loss ↑ B ↑: moisture ↑ A ↑: moisture ↓ B ↑ : Presence of an optimum moisture A ↑: moisture ↑ B ↑: Presence of an optimum cohesion A ↑: Presence of an optimum cohesion B ↑: Presence of an optimum cohesion A ↑: Presence of an optimum cohesion
Significant effect of aggregate surface area and its square amount
9. RESISTANCE TO RUTTING Because the Type III aggregate gradation is used to fill rut distresses on the surface of roads with high traffic volume, it is necessary to select the aggregate gradation that
Page | 30 Unauthenticated | 96.22.13.112 Download Date | 5/12/14 3:03 AM
The International Journal of Pavement Engineering and Asphalt Technology (PEAT) ISSN 1464-8164. Volume: 14, Issue: 2, December 2013, pp.11-35
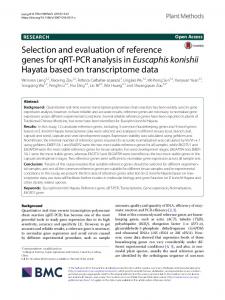
provides maximum resistance to rut permanent deformation. Rut distress under vehicle wheels can be due to insufficient structural support of layers under the binder surface layer, or also, can be a reason of inaccurate material selection in the mix design process of binder surface layer. Type III application of micro-surfacing can be used to fill the rut depth of up to 13 mm to recover the binder surface to its original situation, and improve the life of pavement up to 7 years. However, the micro-surfacing materials such as binder emulsion, aggregate gradation, and other mix proportions should be accurately selected, so that the micro-surfacing mixture can resist against rutting during its predicted 7 year service life on the surface of the road. Multi-layer Loaded Wheel Test Vertical & Lateral Displacement (Method A-ISSA TB 109) test was used in this study to measure the resistance of micro-surfacing mixtures against rutting. This test also establishes the minimum binder emulsion content necessary to prevent excessive deformation of microsurfacing mixture. As was already been shown, the micro-surfacing mixtures prepared using MG aggregate gradation and 8.1% emulsion residue, plus that of prepared with UG aggregate gradation and 8.6% binder emulsion residue, had higher amounts of 30 and 60min cohesion compare to other micro-surfacing mixtures. Figure 17 shows that the mixture made by MG aggregate gradation and 8.1% binder emulsion residue had higher resistance to rutting deformation compare with the one consist of UG aggregate gradation and 8.6% binder emulsion residue. For the micro-surfacing design to be accepted, the vertical displacement at the center of the sample should be less than 10% of the thickness of the sample at the same place. Figure 17 also shows that, using vertical displacement test, the optimum amount of binder emulsion residue can be determined for the mixture. 19.7
Vertical Displacement (%)
20 15
Vertical Displacement Test Results 18.4 16.5 13.6
10 ISSA Limit (Vertical Displacement)
12.3 8.5
9.6
11
7.5
5 0 UG - 7.6 UG - 8.1 UG - 8.6 MG - 7.6 MG - 8.1 MG - 8.6 LG - 7.6 LG - 8.1 LG - 8.6
Aggregate Gradation - Binder emulsion residue Percentage (%)
Figure 17. Plot of Raw data for vertical displacement test results In the case of micro-surfacing mixtures prepared with MG aggregate gradation and different levels of binder emulsion residue, there observed an optimum amount of binder, in which the mixture shows its maximum resistance to rutting. It must be noted that the goal of performing vertical displacement test was to understand the role of aggregate gradation on the resistance of micro-surfacing mixtures. So, in all the prepared microPage | 31 Unauthenticated | 96.22.13.112 Download Date | 5/12/14 3:03 AM
The International Journal of Pavement Engineering and Asphalt Technology (PEAT) ISSN 1464-8164. Volume: 14, Issue: 2, December 2013, pp.11-35
surfacing mixtures for this test, 1% Portland cement was used in the sample. Normally, 1 to 2% Portland cement is added to micro-surfacing mixtures to improve the properties of mixture.
10. SELECTION OF AGGREGATE GRADATION FOR MICROSURFACING MIXTURES The design of micro-surfacing mixture is a process that requires the proper proportioning of materials to satisfy the mechanical properties, and filed performance. As discussed earlier, the total aggregate surface area plays an important role in the mixture properties such as cohesion, adhesion, abrasion, and resistance to rutting. Current micro-surfacing mix design standards, such as ISSA, provides the material specification for different application of micro-surfacing mixture. Figure 18 shows the recommended aggregate gradations for Type II and III of micro-surfacing.
Figure 18. ISSA micro-surfacing mix design guide for selection of aggregates (ISSA A-143, 2005) In this study three different aggregate gradations were selected within the grading range recommended by ISSA mix design standard for type III application of micro-surfacing. The selected aggregate gradations were close together, while, the variation in microsurfacing mixture design results were significant due to changing the total aggregate surface area. Therefore, it is essential to recommend a narrow limit for aggregate gradation of Type III micro-surfacing mixtures. Based on the detailed laboratory observations in this study, the micro-surfacing mixtures prepared using mid-range (MG) aggregate gradation recommended by ISSA mix design standard for Type III application of micro-surfacing shown improved properties and performances. The micro-surfacing mixtures prepared using UG aggregate gradation shown good mixture properties and performances compare to those of prepared with MG and UG aggregate gradations. It was concluded that the modified maximum and minimum limit for aggregate grading of Type III application of micro-surfacing to fill rut on the surface of road located in area with high traffic should be within the UG and LG aggregate gradations studied in this study. The maximum limit of grading is recommended to be on the UG aggregate Page | 32 Unauthenticated | 96.22.13.112 Download Date | 5/12/14 3:03 AM
The International Journal of Pavement Engineering and Asphalt Technology (PEAT) ISSN 1464-8164. Volume: 14, Issue: 2, December 2013, pp.11-35
gradation, while, the minimum limit of grading is suggested to be between MG and LG aggregate gradation to optimize the micro-surfacing mixture properties and performances. Table 11 and figure 19 represent the modified mix aggregate grading recommended to select aggregate grading of Type III application of micro-surfacing. Table11. Modified and recommended aggregate grading for Type III microsurfacing Sieve No & Size Mm
3/8 No. 4 No. 8 No. 16 No. 30 No. 50 No. 100 No.200
9.5 4.5 2.36 1.18 0.6 0.3 0.15 0.075
Passing Percentage (%)
in
100 90 80 70 60 50 40 30 20 10 0 0.01
% Passing by Weight Type III PERCENT PASSING 100 75 ─ 85 55 ─ 65 35 ─ 45 25 ─ 30 15 ─ 20 12 ─ 14 9 ─ 13
Stockpile Tolerance,%
0.1
− +/- 2 +/- 2 +/- 2 +/- 2 +/- 1 +/- 1 +/- 1
1
10
Sieve Sizes (milimetres) ISSA Max Limit Recommended Max Limit
ISSA Min Limit Recommended Min Limit
Figure 19. Modified and recommended aggregate grading for type III application of Micro-surfacing 11.
CONCLUSION
The overall goal of this study was to improve the performance of Type III microsurfacing mixtures to fill rut deformation of roads located in areas with high traffic volume through the development of a modified specification for selecting aggregate gradation. This was achieved through a two parts experimental program. In the first part, Page | 33 Unauthenticated | 96.22.13.112 Download Date | 5/12/14 3:03 AM
The International Journal of Pavement Engineering and Asphalt Technology (PEAT) ISSN 1464-8164. Volume: 14, Issue: 2, December 2013, pp.11-35
the influence of aggregate gradation and binder emulsion residue was studied and the sensitivity of different tests was evaluated. Then, in the second part, a modification to ISSA mix design standard for selecting aggregate grading for Type III application of micro-surfacing was suggested. Based on statistical analysis of the findings, the following conclusions are submitted: 1) Total amount of aggregate surface area of different aggregate gradations used to prepare micro-surfacing mixtures in this study appears to have a profound influence on the results of loaded wheel test, wet track abrasion tests, modified cohesion test, and retained moisture in LWT and WTAT samples. When the aggregate surface area increased in the mixture, the adhered sand in LWT decreased, while, the aggregate loss in WTAT increased with a lower rate. 2) The sensitivity of the test results of loaded wheel test to increase of the binder emulsion residue in the micro-surfacing mixtures was observed to be higher that of wet track abrasion test. This indicates that using LWT and WTAT to select optimum binder emulsion is not an accurate process in ISSA mix design procedure to design micro-surfacing mixtures. 3) The use of galvanized steel as specimen mounting plates in loaded wheel test do not allow water to evaporate through the curing process of mixture. Study of relative moisture retained in loaded wheel test samples after 24-hours curing show that as the binder emulsion residue increased, the retained moisture in samples was increased and subsequently the amount of sand adhered in loaded wheel test increased. Results of relative moisture retained in wet track abrasion test after 24-hours curing evident that as the binder emulsion increased, there observed an optimum amount of relative moisture retained in WTAT samples, which was mixed, cast, and poured out onto the roofing felt pad. The micro-surfacing mixtures prepared using MG aggregate gradation in this study had higher resistance to rutting deformation compare with those of prepared using UG and LG aggregate gradation. This shows the importance of accurately selecting aggregate gradation for Type III micro-surfacing mixtures. The modified aggregate grading suggested by this study shows to have maximum resistance to rutting, and is suited to be used in preparing micro-surfacing mixtures as rut filling materials on the surface of roads located at areas with high traffic volume.
REFERENCES ASTM. 1999. Standard Practice for Design. Testing and Construction of MicroSurfacing. ASTM Book of Standards, D6372-99a. West Conshohocken (Pa.): American Society for Testing and Materials. CALTRANS. 2004. « PHASE I REPORT. Slurry Seal / Micro-Surface Mix Design Procedure (Contract 65A0151) ». Online. 140 pages.. Accessed 12 Jan 2013. Delmar R. Salomon « Binder Emulsion Technology ». Online. . Accessed 20 Jan 2013. FHWA. 2005. Memorandum on Pavement Preservation Definitions. International Slurry Surfacing Association. 2011. . Accessed 15 Jan 2013. ISSA. (revised) May 2005. Recommended Performance Guidelines for Micro-surfacing. Design Technical Bulletins, A-143. Annapolis (Md.): International Slurry Surfacing Association. ISSA. (revised) May 2005. Outline Guide Design Procedure for Slurry Seal. 2nd revision. Design Technical Bulletins, 111. Annapolis (Md.): International Slurry Surfacing Association. ISSA. (revised) May 2005. Test Method to Classify Emulsified Binder/Aggregate Mixture Systems by Modified Cohesion Tester Measurement of Set and Cure Characteristics. 2nd revision. Design Technical Bulletins, 139. Annapolis (Md.): International Slurry Surfacing Association. ISSA. (revised) May 2005. Test Method for Wet Track Abrasion of Slurry Surfaces. 4nd revision. Design Technical Bulletins, 100. Annapolis (Md.): International Slurry Surfacing Association. ISSA. (revised) May 2005. Test Method for Measurement of Excess Binder in Bituminous Mixtures by Use of a Loaded Wheel Tester and Sand Adhesion. 3nd revision. Design Technical Bulletins. 109, Annapolis (Md.): International Slurry Surfacing Association. ISSA. (revised) May 2005. Test Method for Measurement of Stability and Resistance to Compaction. Vertical and Lateral Displacement of Multilayered Fine Aggregate Cold Mixes. 1nd revision. Design Technical Bulletins, 147. Annapolis (Md.): International Slurry Surfacing Association. ISSA. (revised) May 2005. Mixing Time Test. 2nd revision. Design Technical Bulletins, 102. Annapolis (Md.): International Slurry Surfacing Association. Robati M., December 2011. « Evaluation of A Modification of Current Micro-surfacing Mix Design Procedures ». In partial fulfillement of the requirements for a master’s degree in construction engineering, Montréal, École de technologie supérieure, 175 p. TTI. (revised) April 2005. The Evaluation of Micro-Surfacing Mixture Design Procedures and Effects of Material Variation on the Test Responses. « Research Report of Texas Transportation Institute », 1289-1. Texas (Tx.): Texas A&M University, College Station. Uzarowski. L.. et I. Bashir. 2007. « A Rational Approach for Selecting the Optimum Binder Pavement Preventive and Rehabilitation Treatments–Two Practical Examples from Ontario ». In Annual Conference of the Transportation Association of Canada. (Saskatoon).
Page | 35 Unauthenticated | 96.22.13.112 Download Date | 5/12/14 3:03 AM
The International Journal of Pavement Engineering and Asphalt Technology (PEAT) ISSN 1464-8164. Volume: 14, Issue: 2, December 2013, pp.36-52
COMPARISON STUDY BETWEEN LIME APPLICATION METHODS ON HMA ASPHALT CONCRETE IN IRAQ Amjad H. K. Albayati, Assist prof. Transportation. Engineering, University
[email protected] Ahmed M. M. Alani, M.Sc Candidate Transportation Engineering, University of Baghdad
of
Baghdad,
doi: 10.2478/ijpeat-2013-0002
ABSTRACT Iraq has been experiencing tremendous development in the national infrastructure road network over the last decade. Iraqi economic growth in rural areas has been triggered by good and safe roads and a good highways network system. Studies have shown that climate, traffic conditions, characteristics of the asphalt binder and the aggregate are the main factors that can contribute to premature pavement failures. The ability of hydrated lime to improve the fatigue and rutting resistance of Hot Mix Asphalt (HMA) as well as moisture sensitivity, has led to observed improvement in the field of lime modified HMA pavements, and significant decreases in maintenance and repair costs of the highway network. In this study, the mechanistic properties of asphalt concrete mixes modified with hydrated lime as a partial replacement for limestone dust mineral filler were evaluated. Four replacement rates were used; 1, 1.5, 2, and 3 percent by weight of aggregate beside two kinds of addition methods, namely dry and wet. Asphalt concrete mixes were prepared at their optimum asphalt content and then tested to evaluate their engineering properties which include moisture damage, resilient modulus, and permanent deformation and fatigue characteristics. These properties have been evaluated using indirect tensile strength, uniaxial repeated loading and repeated flexural beam tests. The experimental results, in general, showed that the mixes modified with hydrated lime were found to have improved fatigue and permanent deformation characteristics, also showing lower moisture susceptibility and higher resilient modulus. The use of 1.5 percent of hydrated lime in the wet addition method as a replacement for limestone dust mineral filler has shown a significant improvement in asphalt concrete behavior and has added to the local knowledge the possibility of producing more durable mixtures with higher resistance to distress.
BACKGROUND The related mechanisms and reactions involved in the change of the performance of limemodified HMA mixtures are not totally understood. Nevertheless, when hydrated lime is added to HMA, a portion of the lime forms insoluble salts with the highly polar molecules of the asphalt, which could otherwise react in the mix to form water-soluble soaps that promote stripping (National Lime Association 2003). Dispersion of the tiny 36 | P a g e Unauthenticated | 96.22.13.112 Download Date | 5/12/14 3:03 AM
The International Journal of Pavement Engineering and Asphalt Technology (PEAT) ISSN 1464-8164. Volume: 14, Issue: 2, December 2013, pp.36-52
hydrated lime particles throughout the mix makes it stiffer and tougher, reducing the likelihood that the bond between the bitumen binder and the aggregate will be broken mechanically. Furthermore, a portion of the hydrated lime can reduce the viscositybuilding polar components in the asphalt binder and thus improve the long-term oxidative aging characteristics of HMA (Huang et al. 2002). The structure of hydrated lime consists of differently sized proportions. The smaller fraction of lime increases binder film thickness, enhances binder viscosity, and improves binder cohesion leading to increased adhesion between the aggregates and binder, which reduces mixture segregation (Mohammad et al 2000). The larger fraction performs as filler and increases the indirect tensile strength and resilient modulus as well as improving (i.e., decreasing) both the indirect tensile creep slope and the fatigue slope (with higher number of cycles to failure of HMA) (Kennedy and Ping 1991; Mohammad et al 2000; Sebaaly 2006). It has also been reported that the addition of lime to HMA improves its resistance to rutting (Little and Epps 2001; AlSuhaibani 1992; Shahrour and Saloukeh 1992). Hydrated lime replacement for limestone or baghouse dust has gained a considerable recognition due to its efficient effects on both pavement performance and cost, manifesting its benefits in decreasing maintenance and repair in current and newly constructed pavement sections. (Sebaaly et al. 2003) conducted research to quantify the improvements of pavement performance with the inclusion of lime. Performances of HMA mixtures from the northwestern part of Nevada were evaluated both in the laboratory and in the field. In the laboratory evaluation, both lime treated and untreated sections were sampled and then evaluated through laboratory tests. On the other hand, pavement performance data from a pavement management system (PMS) were used to assess field performance of lime treated and untreated sections. The study showed that lime treatment on HMA mixtures significantly improved their moisture resistance and resistance to multiple freeze-thaw cycles compared to untreated HMA mixtures. From the long-term pavement performance data it was also evident that under similar environmental and traffic conditions, lime treated mixtures provided better performance with less maintenance and rehabilitation activities. Again, the analysis of the impact of lime on pavement life indicated that lime treatment extended the performance life of HMA pavements by an average of 3 years which represented an average increase of 38% in the expected pavement life. Various ways to add hydrated lime, i.e., into the drum, as mixed filler, dry to the damp aggregate, as lime slurry, with or without marination could be implemented. No definitive evidence demonstrates that one method is more effective than the other. In general, contractors and (or) transportation departments have adopted one or more of three popular techniques, in dry, wet, and slurry states. The three techniques along with a brief description of each one are listed in Figure 1 (Button and Epps 1983).
37 | P a g e Unauthenticated | 96.22.13.112 Download Date | 5/12/14 3:03 AM
The International Journal of Pavement Engineering and Asphalt Technology (PEAT) ISSN 1464-8164. Volume: 14, Issue: 2, December 2013, pp.36-52
MATERIAL CHARACTERIZATION The materials used in this work, namely asphalt cement, aggregate, and fillers were characterized using routine types of test and results were compared with state corporation for roads and bridges specifications (SCRB, R/9 2003). Asphalt cement The asphalt cement used in this work is of 40-50 penetration grade. It was obtained from the Dora refinery, south-west of Baghdad. The asphalt properties are shown in Table (1) below. Table 1. Properties of asphalt cement Property
ASTM designation
Penetration grade 40-50 Test results
1-Penetration at 25C,100 gm,5 sec. (0.1mm) 2- Rotational viscosity at 135◦C (cP.s) 2- Softening Point. (◦C) 3-Ductility at 25 C, 5cm/min,( cm) 4-Flash Point, (◦C) 5-Specific Gravity 6- Residue from thin film oven test - Retained penetration,% of original - Ductility at 25 C, 5cm/min,( cm)
D-5 D4402 D-36 D-113 D-92 D-70 D-1754 D-5 D-113
45 523 49 >100 290 1.041
SCRB specification 40-50 …… …… >100 Min.232 ……
59.5 80
>55 >25
Aggregate The aggregate used in this work was crushed quartz obtained from Amanat Baghdad bituminous concrete mix plant located in Taji, north of Baghdad; its source is Al-Nibaie quarry. This aggregate is widely used in Baghdad city for asphaltic mixes. The coarse and fine aggregates used in this work were sieved and recombined in the proper proportions to meet the wearing course gradation as required by SCRB specification (SCRB, R/9 2003). The gradation curve for the aggregate is shown in Figure (2). Routine tests were 38 | P a g e Unauthenticated | 96.22.13.112 Download Date | 5/12/14 3:03 AM
The International Journal of Pavement Engineering and Asphalt Technology (PEAT) ISSN 1464-8164. Volume: 14, Issue: 2, December 2013, pp.36-52
performed on the aggregate to evaluate their physical properties. The results together with the specification limits as set by the SCRB are summarized in Table (2). Tests results show that the chosen aggregate met the SCRB specifications.
Figure 2. Aggregate gradation Table 2. Physical properties of aggregates Property Coarse aggregate 1. Bulk specific gravity 2. Apparent specific gravity 3. Water absorption,% 4. Percent wear by Los Angeles abrasion ,% 5. Soundness loss by sodium sulfate solution,% 6. Fractured pieces, % Fine aggregate 1. Bulk specific gravity 2. Apparent specific gravity 3. Water absorption,% 4. Sand equivalent,%
ASTM designation
Test results
SCRB specification
C-127
2.614 2.686 0.441
…… …… ……
C-131
17.5
30 Max
C-88
3.4 98
12 Max 90 Min
C-127
2.664 2.696 0.724 57
…… …… …… 45 Min.
D-2419
Filler The filler is a non-plastic material passing sieve No.200 (0.075mm). In this work, the control mixes were prepared using limestone dust as mineral filler at a content of 7 percent, this content representing the mid-range set by the SCRB specification for the type IIIA mixes of wearing course. Mixes in which the limestone dust was partially replaced by a hydrated lime were also prepared. The replacement percentages were 1.0, 1.5, 2, and 3% by total weight of aggregate. The limestone dust and hydrated lime were obtained from a lime factory in Karbala governorate, south east of Baghdad. The chemical composition and physical properties of the fillers are presented in Table (3) below:
39 | P a g e Unauthenticated | 96.22.13.112 Download Date | 5/12/14 3:03 AM
The International Journal of Pavement Engineering and Asphalt Technology (PEAT) ISSN 1464-8164. Volume: 14, Issue: 2, December 2013, pp.36-52
Table 3. Properties of fillers Filler type
Limestone Dust Hydrated Lime
Chemical Composition ,%
Physical Properties
CaO
SiO2
Al2O3
MgO
Fe2O3
SO3
L.O.I
Specific gravity 2.41
Surface area* (m2/kg) 499
% Passing sieve No. 200( 0.075) 49
3872
2.23
-
0724
-
0740
4.72
56.1
1.38
0.72
0702
0.12
0.21
9073
47.8
248
48
* Blain air permeability method (ASTM C204)
EXPERIMENTAL WORK Lime addition techniques and specimen fabrication In this study two methods were used in applying the hydrated lime into the aggregate. The dry lime was applied directly, heated and mixed with aggregate prior to asphalt introduction and this seems to be the simplest method for lime application technique and is called in this study the dry method. Meanwhile in the wet method dry aggregate blends were moisturized with an addition of 3.0% water by weight of total aggregates; dry hydrated lime at a different rate by total dry weight of aggregate was then mixed with the wet aggregates for 10 minutes to produce evenly distributed lime-water films on the aggregate surfaces. The lime-treated aggregates were then oven dried for four hours to eliminate all water prior to the addition of the asphalt binder. Each mixture was designed with the same blend of aggregates in order to keep aggregate angularities and mineralogical characteristics constant. The only variable in the mixtures was the replacement rates of hydrated lime (1.0, 1.5, 2.0, and 3%). Consequently, in order to determine the optimum percent of asphalt cement in bituminous concrete mixtures, a triplicate number of specimens for each asphalt content by Marshall Mix design method (ASTM D6926-2010a) were prepared. Nine mixes were prepared for this purpose, four mixes using the dry method, four mixes using the wet method and one as a control mix with zero hydrated lime content. The Marshall Test results showed that 4.9% is the optimum percent for bituminous concrete mixtures. The specimens prepared for this study, had a diameter of 100mm and height of 63 mm for Marshall and tensile strength ratio (ASTM- D-4867-96). Specimens were compacted using Marshall standard compaction procedures with 75 blows per face, except that for tensile strength the number of blows was less in order to produce HMA with targeted air voids between 68%. A Superpave Gyratory Compactor (AASHTO 2004) was also used to fabricate HMA specimens with 50 gyrations of samples 101.1 mm in diameter and 203.3mm in height to quantify the effect of hydrated lime on rutting potential. Also compacted beam specimens 76 mm x 76 mm x 381 mm were produced by means of static compaction using a "double plunger" arrangement, using a compressive machine, and pressed under the gradual application of a static load for 2 minutes according to (ASTM-D1074-96) to promote homogeneity; the mixture is generally "rodded" prior to compaction, and the mold is made "free floating" by using a "double plunger" arrangement. 40 | P a g e Unauthenticated | 96.22.13.112 Download Date | 5/12/14 3:03 AM
The International Journal of Pavement Engineering and Asphalt Technology (PEAT) ISSN 1464-8164. Volume: 14, Issue: 2, December 2013, pp.36-52
Indirect tensile test The moisture susceptibility of the bituminous concrete mixtures was evaluated according to (ASTM- D-4867-96). The result of this test is the indirect tensile strength (ITS) and tensile strength ratio (TSR). In this test, a set of specimens was prepared for each mix according to Marshall Procedure and compacted to 7±1 % air voids using different numbers of blows per face, varying from 34 to 49 (targeted air voids content were prepared to voids is not meant to mimic the actual field conditioning process but to accelerate the moisture damage in a manner that can be measured under laboratory conditions). The set consists of six specimens and was divided into two subsets, one set (control) was tested at 25°C and the other set (soaked) was subjected to one cycle of freezing and thawing then tested at 25°C. The test is shown below in Figure 3. It involved loading the specimens with compressive load at a rate of 50.8mm/min acting parallel to and along the vertical diametral plane through 0.5 in. wide steel strips which are curved at the interface with the specimens. These specimens failed by splitting along the vertical diameter. The indirect tensile strength calculated according to (Eq.1) of the soaked specimens (ITSc) is divided by that of the control specimens (ITSd), which gives the tensile strength ratio (TSR) as the following (Eq.2). 2P …… Eq. 1 ITS tD ITSc …… Eq. 2 TSR ITSd Where ITS= Indirect tensile strength P = Ultimate applied load t = Thickness of specimen D = Diameter of specimen Other parameters are defined previously
Uniaxial repeated loading test
Figure 3. Photograph for ITS test
The uniaxial repeated loading tests were conducted on cylindrical specimens, 101.6 mm in diameter and 203.2 mm in height, using the pneumatic repeated load system (PRLS – Albayati 2006) shown below in Figure 4. In these tests, repetitive compressive loading with a stress level of 20 psi was applied in the form of a rectangular wave with a constant loading frequency of 1 Hz (0.1 sec. load duration and 0.9 sec. rest period) and the axial permanent deformation was measured under the different loading repetitions. All the uniaxial repeated loading tests were conducted at 20°C, 40°C and 60°C. The permanent strain (εp) is calculated by applying the following equation: p 106 p d …… Eq. 3 h 41 | P a g e Unauthenticated | 96.22.13.112 Download Date | 5/12/14 3:03 AM
The International Journal of Pavement Engineering and Asphalt Technology (PEAT) ISSN 1464-8164. Volume: 14, Issue: 2, December 2013, pp.36-52
Where εp= axial permanent microstrain pd= axial permanent deformation h= specimen height Also, during this test the resilient deflection was measured at load repetitions 50 to 100, and the resilient strain (εr) and resilient modulus (Mr) were calculated as follows (Huang 2004): r 106 …… Eq. 4 r d h Mr
r
…… Eq. 5
Where εr= axial resilient microstrain rd= axial resilient deflection h= specimen height Mr= Resilient modulus σ = repeated axial stress εr= axial resilient strain Figure 4. Photograph for the PRLS The permanent deformation test results for this study are represented by a linear log-log relationship between the number of load repetitions and the permanent microstrain with the form shown in Eq.6 below which was originally suggested by Monismith et. al., (1975) and Barksdale (1971).
p aN b…..… Eq. 6 Where εp= permanent strain N=number of stress applications a= intercept coefficient b= slope coefficient
Flexural beam fatigue test Within this study, a third-point flexural fatigue bending test was adopted to evaluate the fatigue performance of bituminous concrete mixtures using the pneumatic repeated load system, this test was performed in stress controlled mode with flexural stress level varying from 5 to 30 percent of ultimate indirect tensile strength applied at a frequency of 2 Hz with 0.1 s loading and 0.4 s unloading times and in rectangular waveform shape. All tests were conducted as specified in SHRP standards at 20°C on beam specimens. In the fatigue test, the initial tensile strain of each test has been determined at the 50th repetition by using (Eq.7) shown below and the initial strain was plotted versus the number of
42 | P a g e Unauthenticated | 96.22.13.112 Download Date | 5/12/14 3:03 AM
The International Journal of Pavement Engineering and Asphalt Technology (PEAT) ISSN 1464-8164. Volume: 14, Issue: 2, December 2013, pp.36-52
repetitions to failure on log scales, collapse of the beam being defined as failure, and the plot can be approximated by a straight line and has the form shown below in (Eq. 8).
t
Es
12h 3L2 4a 2
N f k1( t ) k 2
…… Eq. 7
…… Eq. 8
Where t = Initial tensile strain σ =Extreme flexural stress Es =Stiffness modulus based on center deflection. h =Height of the beam Δ =Dynamic deflection at the center of the beam. L = Length of span between supports. a =Distance from support to the load point (L/3) N f = Number of repetitions to failure k1 = fatigue constant, value of Nf when t = 1 k 2 = inverse slope of the straight line in the logarithmic relationship
TEST RESULTS AND DISCUSSION Effects of hydrated lime on moisture susceptibility Based on the data shown in Figure 5, it appears that both the hydrated lime content and addition method have influence on the moisture susceptibility of the bituminous concrete mixes. The figure clearly demonstrates that both hydrated lime addition methods contributed to an increase in TSR and the general observation shows that the wet method seems to be more effective than the dry method. TSR has gained a considerable increase, by 4.2%, 5.9%, 10.9% and 9% with the dry method with ascending amounts of lime replacement as compared to the control mix. Meanwhile, the acquired gains in TSR with the wet method were 3.4%, 6%, 18.8% and 19.8%. These results confirm the role of hydrated lime as a superior anti striping agent. The improvement in TSR can be attributed to the improvement in the adhesion between aggregate and asphalt cement due to the presence of hydrated lime by interacting with carboxylic acids in the asphalt and forming insoluble salts that are readily adsorbed at the aggregate surface (Plancher et al. 1977; and Hicks 1991). Relating these phenomena to local Iraqi paving materials is discussed as follows; the aggregate used in this study was brought form Al-Nibaie quarry, which is Quartzite and classified as acidic aggregate and the improvement was shown in that altering the surface chemistry of acidic aggregate causes a basic coating, and develops a strong bond between aggregate and acidic asphalt binder. Such bonding developed between asphalt binder and aggregate results in mitigation of moisture damage in the 43 | P a g e Unauthenticated | 96.22.13.112 Download Date | 5/12/14 3:03 AM
The International Journal of Pavement Engineering and Asphalt Technology (PEAT) ISSN 1464-8164. Volume: 14, Issue: 2, December 2013, pp.36-52
asphalt mixtures. The effect of the wet method of hydrated lime replacement was significant and even more impressive; this could be explained by the fact that wet replacement of hydrated lime on 3% SSD provides better coverage and allows for proper application as compared addition of dry hydrated lime to dry aggregate. These advantages are possible because moisture ionizes lime and helps to distribute it on the surface of the aggregate. Also visual inspection of tested specimens showed more broken aggregates on the split faces which reflect higher bonding strength of the binder. Control
dry Hydrated lime
Wet hydrated lime
100.00%
TSR %
90.00% 80.00%
70.00% 60.00% 1
1.5
2
3
Hydrated lime % Figure 5. Effect of both methods on TSR%
Effects of hydrated lime on permanent deformation Permanent deformation manifests itself as a primary distress due to the hot climate of the Iraqi summer season. In this study the effect of hydrated lime has been quantified at a range of three testing temperatures 20°C, 40°C and 60°C representing the actual climate variation during the year in Iraq. Analysis of permanent deformation potential affected by the addition of hydrated lime is shown in figure 7 and 8 which is based on the data presented in Tables 5 and 6. Examination of the presented data suggests that the permanent deformation parameters (intercept and slope) are generally improved with the use of hydrated lime. At lower temperature 20°C, the trend line of permanent deformation show a narrow corridor between control and lime treated mixture with different rates for both dry and wet hydrated lime methods. In other words, hydrated lime seems insignificant in reducing the slope and intercept values as shown in tables 5 and 6 This can be attributed to the fact that, hydrated lime had a minor effect at lower temperature in reducing the permanent deformation parameters and this was expected and indicated throughout the study of (Little and Petersen 2005). At intermediate and higher temperature, hydrated lime shows a significant effect in improving rutting resistance by decreasing the slope value. Using the dry method the slope value decreased as the amount of hydrated lime increased at 40°C and 60°C; mixes replaced in the dry method with hydrated lime of 1.5% at 40°C and 60°C exhibit a lower slope value by 9.47% and 4.74% respectively. The addition more hydrated lime beyond this percentage may not represent the best scenario as the time to failure for the 3.0% case was not significantly different. 44 | P a g e Unauthenticated | 96.22.13.112 Download Date | 5/12/14 3:03 AM
The International Journal of Pavement Engineering and Asphalt Technology (PEAT) ISSN 1464-8164. Volume: 14, Issue: 2, December 2013, pp.36-52
The same scenario using the wet method is observed, the mixture with 2.0% exhibiting a lower slope value by 10.1% and 7.87% respectively at 40°C and 60°C compared to the control mix. As a summary from the test results it also appears that the addition of more than 1.5% hydrated lime for the dry method and 2.0% for the wet method did not improve the performance, as the time to failure for the 3.0% case was very similar to the time to failure of the 2.0% case, except at a lower temperature of 20°C where hydrated lime acts as inert filler and is less chemically active. The addition-reduction trend in permanent deformations of specimens of asphalt hydrated lime inclusion was more impressive. On the other hand, the wet method seems to be more effective in reducing the slope value. In general, hydrated lime shows a significant effect using both methods in HMA mixture as limestone dust replacement by increasing the resistance to permanent deformation. The results for both addition method and especially wet method confirm that the rutting mode of failure in bituminous concrete pavements which is enhanced can be reduced to a large extent with the introduction of hydrated lime to asphalt concrete mixtures during the hot summer season in Iraq.
Permananet microstrain
control
1.0%
1.5%
2.0%
3.0%
10000
1000
100 1
10
100 Number of repetitation
1000
10000
Figure 7. Effect of dry methods replacement on rutting resistance at 40°C
Permananet Micro strain
Control
1.0%
1.5%
2.0%
3.0%
10000
1000
100 1
10
100 Number of repetitation
1000
10000
Figure 8. Effect of wet methods replacement on rutting resistance at 40°C Table 5. Intercept and slope coefficient for dry method
45 | P a g e Unauthenticated | 96.22.13.112 Download Date | 5/12/14 3:03 AM
The International Journal of Pavement Engineering and Asphalt Technology (PEAT) ISSN 1464-8164. Volume: 14, Issue: 2, December 2013, pp.36-52 20 C0
Mixture
40C0
60C0
Control 1.0%
a 115.72 110.32
b 0.2761 0.2758
a 337.71 314.5
b 0.454 0.446
a 572.36 553.47
b 0.5438 0.537
1.5% 2.0% 3.0%
106.57 95.071 72.659
0.2682 0.2632 0.2619
273.95 235.65 220.14
0.411 0.437 0.441
477.58 461.85 513.11
0.518 0.522 0.532
Table (6) intercept and slope coefficient for wet method 20 C0
Mixture
40C0
60C0
1.0% 1.5% 2.0%
a 113.72 101.13 83.159
b 0.2722 0.2681 0.267
a 271.98 257.73 223.57
b 0.442 0.423 0.408
a 535.16 488.64 420.92
b 0.528 0.511 0.501
3.0%
68.633
0.2566
262.93
0.414
473.71
0.509
Effects of hydrated lime on resilient modulus Table 7 as well as Figure 9 exhibits the variation of the resilient modulus values with hydrated lime content as well as addition method. The general theme which can be abstracted from the figure reflects that as the percentage of hydrated lime is increased the resilient modulus increases for both types of addition method indicating that the mixes are becoming stiffer. Also for any specified hydrated lime content, the resilient modulus value is higher when the dry addition method is used as compared to the wet addition method and these differences in resilient modulus values are more pronounced at a low testing temperature of 20°C but tend to vanish at a high testing temperature of 60°C. When 3 percent hydrated lime is used in bituminous concrete mixes, for 20°C, 40°C and 60°C testing temperature, the increment rates in resilient modulus values are 40.2, 35.2 and 25.4 percent with the dry addition method whereas for the wet addition method the corresponding values are 29.1, 23.8 and 10.8 percent as compared to the control mixture with 0 percent hydrated lime Table (7) Effect of hydrated lime content and addition method On resilient modulus (Kpa) Mixture
20C0
Gains%
40C0
Gains%
60C0
Gains%
Control 1.0% dry 1.5% dry 2.0% dry 3.0% dry 1.0% wet 1.5% wet 2.0% wet 3.0% wet
1233833 1537985 1708182 1763557 2066669 1377779 1469630 1613011 1740351
0 19.7 27.7 30 40.2 10.4 16.04 23.5 29.1
791068 880225 1027429 1085801 1221307 870172 887934 966859 1038529
0 10.1 23 27.1 35.2 9.09 10.9 18.18 23.8
551110 606726 640825 674827 739613 590473 607188 652979 618067
0 9.1 13.9 18.3 25.4 6.66 9.23 15.6 10.8
46 | P a g e Unauthenticated | 96.22.13.112 Download Date | 5/12/14 3:03 AM
The International Journal of Pavement Engineering and Asphalt Technology (PEAT) ISSN 1464-8164. Volume: 14, Issue: 2, December 2013, pp.36-52
Figure 9. Effect of hydrated lime content and addition methods on resilient modulus
Effects of hydrated lime on fatigue performance The fatigue characteristic curves for all mixtures are presented in Figure 10 and 11. The fatigue parameters k1 and k 2 are shown in Table 7 and 8. Values of k1 and k 2 can be used as indicators of the effects of hydrated lime on the fatigue characteristics of a paving mixture. The flatter the slope of the fatigue curve, the larger the value of k 2 . If two materials have the same k1 value, then a large value of k 2 indicates a potential for longer fatigue life. On the other hand, a lower k1 value represents a shorter fatigue life when the fatigue curves are parallel, that is, k 2 is constant. Control
1.00%
1.50%
2.00%
3.00%
Initail tensile Microstrain
1000
100 1000
Number of repetition
10000
Figure 10. Hydrated lime replacement by dry method
47 | P a g e Unauthenticated | 96.22.13.112 Download Date | 5/12/14 3:03 AM
The International Journal of Pavement Engineering and Asphalt Technology (PEAT) ISSN 1464-8164. Volume: 14, Issue: 2, December 2013, pp.36-52
Control
1.00%
1.50%
2.00%
3.00%
Initail tensile Microstrain
1000
100 1000
Number of repetittion
10000
Figure 11. Hydrated lime replacement by wet method From the figures above, it is clearly shown that the dry method with replacement rate of 1.0% and 1.5% shows higher fatigue resistance which is accompanied by increasing numbers of repetition and increased K2 as compared to control mix values by 10% and 17% respectively. However a drastic reduction happened when the dose increased beyond a threshold limit of 1.5% resulting in a decrease in K2 value by 8%, and 26% for 2.0% and 3.0%, respectively. It is worth noting here that all of the K1 values ranged between 4.13E-08 to 5.91E-05 using the dry method and the minimum K1 value was obtained when 1.5 percent hydrated lime was used. For the wet method, the general trend observed from Figures and tables shows a synergistic effect to the dry method by increasing the fatigue life to a point and then, with extra amounts, causing deterioration of fatigue resistance. Mixtures with 1.0% and 1.5% show higher fatigue resistance firstly by increasing in numbers of repetition to failure and secondly by increasing the K2 values which were 3.355 for the former and 3.787 for the latter with an increment of 17.4% and 26.8% as compared to the control mixture with 0 hydrated lime content. In comparing the effect of the two addition methods, the wet method extends the fatigue life better than the dry method for the same percentage of hydrated lime content. The overall result for the fatigue test showed that the mixture with 1.5 percent hydrated lime yielded the better results in both dry and wet methods, this is a clear indication of the positive effects of hydrated lime on fatigue damage resistance by its toughening mechanisms related to physicochemical interactions with binder and mineral aggregates. However, adding toughening can be impeded by adding a critical amount of hydrated lime which produces mixtures that are prone to cracking due to material brittleness which confirmed when comparing the average fatigue lives for number of repetition shown in Figure 12.
48 | P a g e Unauthenticated | 96.22.13.112 Download Date | 5/12/14 3:03 AM
The International Journal of Pavement Engineering and Asphalt Technology (PEAT) ISSN 1464-8164. Volume: 14, Issue: 2, December 2013, pp.36-52
Table 7. Fatigue life using dry methods Mixture
Fatigue Equation
Control
Nf = 8.43536E-07 Ɛt-2.77
Number of repetition to fracture (Nf) for Each Stress Level 11285 7556 2332 1802
1.0%
Nf =2.99855E-05 Ɛt -2.058
13542
8260
5427
2105
1.5%
Nf =4.12713E-08 Ɛt -3.344
14531
9650
6321
3189
2.0%
Nf =2.88041E-06 Ɛt -2.564
7692
5254
3472
2101
3.0%
Nf =5.91014E-05 Ɛt -2.057
5928
3631
1931
1317
Table 8. Fatigue life using wet methods Mixture
Fatigue Equation
1.0%
Nf =2.7659E-08Ɛt-3.355
1.5%
Nf =1.58962E-09 Ɛt -3.787
16482
11051
7320
5582
2.0%
Nf =2.43846E-07 Ɛt -3.012
10218
6279
3421
2103
3.0%
Nf =2.08194E-05 Ɛt -2.227
5423
3982
2145
1210
Control
Number of repetition to fracture (Nf) for Each Stress Level 14537 10921 6258 3865
Dry Hydrated lime
Wet Hydrated lime
Number of repetitation to fracture
12000 10000 8000 6000 4000 2000 0
1
1.5
2
3
Hydrated lime %
Figure 12. Average fatigue life
PERFORMANCE ANALYSIS USING VESYS 5W SOFTWARE Using vesys5w software to analyze a pavement section consisting of a 150 mm asphalt concrete layer over a 400 mm base course layer with 1.0 million ESALs application during 10 years’ service life, the present serviceability index trend line is abstracted from the output results of the software and is shown in Figure 10. The figure clearly shows that the pavement section which consists of asphalt concrete layer modified with 1.5 percent 49 | P a g e Unauthenticated | 96.22.13.112 Download Date | 5/12/14 3:03 AM
The International Journal of Pavement Engineering and Asphalt Technology (PEAT) ISSN 1464-8164. Volume: 14, Issue: 2, December 2013, pp.36-52
lime (wet application method) provided better performance as compared to the mixes with 1.5 percent lime (dry application method) or the mix with 0 lime. The PSI values at the end of 10 years’ service life are 3.01, 2.8 and 2.64 for the pavement sections with bituminous concrete layers containing 1.5 percent lime (wet), 1.5 percent lime (dry) and 0 lime, respectively. The PSI values in vesys5w software reflect the effect of rutting and cracking for a pavement section during the design life.
Present Serviceability Index, PSI
4.50
4.00
3.50
3.00
0 lime
2.50
1.5% lime (Dry) 1.5% lime (Wet) 2.00 0
2
4
6
8
10
12
Years
Figure 13. Performance analysis for mixes modified with 1.5 percent lime with two addition methods
CONCLUSIONS The following conclusions and recommendations are based on the results of the laboratory tests and analysis presented in this study: The use of both hydrated lime addition methods exhibited a good resistance against moisture damage, with an increase in TSR of 4.2%, 5.3%, 5.9% 10.9%, and 9.0% for the dry hydrated lime replacement method and 3.4% , 6% , 18.8%, ???, 19.8% for the wet hydrated lime replacement method corresponding to 1.0, 1.5, 2.0 and 3.0 lime contents, respectively. This indicates that the wet addition method was more effective than the dry method in improving the resistance to moisture induced damage of bituminous concrete pavement modified with hydrated lime The permanent deformation parameters slope and intercept, were significantly affected using dry and wet hydrated lime addition methods employing different percentages of hydrated lime and this effect is more pronounced at high testing temperatures. The lime modified mix with 1.5 percent using the dry method and 2 percent using the wet method resulted in a decrease in permanent deformation slope value of 9.4 and 10.1 percent, respectively, at a temperature of 40°C as compared to the control mixture with no hydrated lime.
50 | P a g e Unauthenticated | 96.22.13.112 Download Date | 5/12/14 3:03 AM
The International Journal of Pavement Engineering and Asphalt Technology (PEAT) ISSN 1464-8164. Volume: 14, Issue: 2, December 2013, pp.36-52
The dry addition method of hydrated lime as a filler substitute results in better elastic modulus as characterized by the resilient modulus test in comparison with the wet addition method. The use of 3 percent lime, respectively at 20°C,40°C and 60°C test temperature improved the resilient modulus by 40.2, 35.2 and 25.4 percent with the dry addition method whereas for the wet addition method the corresponding values were 29.1, 23.8 and 10.8 percent as compared to control mixes with no hydrated lime. For both addition methods, the use of 1.5 percent hydrated lime as a filler substitute improved the fatigue property of the bituminous concrete mixes as determined by the flexural test. The k 2 value (inverse slope of fatigue line) for mixes with 1.5 percent hydrated lime in both dry and wet addition methods was more than that of 0 percent hydrated lime by 43.8 and 49.3 percent, respectively. The use of 1.5 percent hydrated lime in the wet addition method as replacement for limestone dust mineral filler has shown a significant improvement of bituminous concrete behavior and has added to local knowledge the possibility of producing more durable mixtures with higher resistance to distress.
REFERENCES AASHTO, (2004) "Evaluation of Superpave Gyratory Compactors (SGC’s)", AASHTO Designation: PP-35, , American Association of State Highways and Transportation Officials, Washington, D.C. Albayati A.,H , Alani A,M., (2012) , “Laboratory investigation in the Hydrated Lime effect on asphalt concrete mixture” , preceding of The First National Conference for Engineering Sciences FNCES'12 , Baghdad , Iraq. Albayati, A.H., (2006),"Permanent Deformation Prediction of Asphalt Concrete Under Repeated Loading" Ph.D. Thesis, Baghdad University. Albayati,A. H.,(2012),” Mechanistic Evaluation of Lime-Modified Asphalt Concrete Mixtures”, 7th RILEM International Conference on Cracking in Pavements RILEM Book series, 2012, Volume 4, PP .921-940. AlSuhaibani, A. R., Al-Mudaiheem, J., and Al-Fozan ,F.(1992) , “ Effect of Filler Type and Content on Properties of Asphalt Concrete Mixes”. In Effects of Aggregates and Mineral Fillers on Asphalt Mixtures Performance, SPT 1147 (R. C. Meininger, ed.), ASTM, Philadelphia, Pa., pp. 107–130. Barksdale, R.,( 1971), “Compressive stress Pulse Times in flexible pavements for use in dynamic Testing”, No.345 , pp 32-44 ,Highway Research Record. Button, J.W., and Epps, J.A. (1983).” Evaluation of methods of mixing lime and asphalt paving mixtures”. Texas Hot Asphalt Pavement Association. European Lime Association / Asphalt Task Force,(2011), “ Hydrated lime a Proven additives for Durable asphalt Pavement. Hicks, R. G. (1991),:” Moisture Damage in Asphalt Concrete”, NCHRP Synthesis of Highway Practice 175,TRB, National Research Council, Washington, D.C.
51 | P a g e Unauthenticated | 96.22.13.112 Download Date | 5/12/14 3:03 AM
The International Journal of Pavement Engineering and Asphalt Technology (PEAT) ISSN 1464-8164. Volume: 14, Issue: 2, December 2013, pp.36-52
Huang ,Y. H., (2004),“Pavement Analysis and Design “, 2nd edition , Pearson Prentice Hall , Pearson Education, Inc . ,Upper Saddle River, NJ 0745 8. Huang, S.-C., J. C. Peterson, R. E. Robertson, and J. F. Branthaver.,(2002) “Effect of Hydrated Lime on Long-Term Oxidative Aging Characteristics of Asphalt”. In Transportation Research Record: Journal of the Transportation Research Board, No. 1810, Transportation Research Board of the National Academies, Washington, D.C., pp. 17–24. Hydrated Lime (2003) “More Than Just a Filler”. National Lime Association, www.lime.org/HydratedLime.pdf. Kennedy, T. W., and Ping, W. V.(1991),” An Evaluation of Effectiveness of Antistripping Additives in Protecting Asphalt Mixtures from Moisture Damage” , Presented at Annual Meeting of the Association of Asphalt Paving Technologies. Little, D, and Epps, J. (2001),.” The Benefits of Hydrated Lime in Hot Mix Asphalt”. National Lime Association,. www.lime.org/ABenefit.pdf. Little, D.N. and Petersen, J.C. (2005). “Unique Effects of Hydrated Lime Filler on the Performance- Related Properties of Asphalt Cements: Physical and Chemical Interactions Revisited.” Journal of Materials in Civil Engineering, Volume 17, No. 2, pp.207-218. Mohammad, L. N., Abadie, C., Gokmen ,R., and Puppala, A. J.,(2000) ,”Mechanistic Evaluation of Hydrated Lime in Hot-Mix Asphalt Mixtures”. In Transportation Research Record: Journal of the Transportation Research Board, No. 1723, TRB, National Research Council, Washington, D.C.,pp. 26–36. Monismith, C., Ogawa, N. and Freeme, C. (1975). “Permanent Deformation Characteristics of Subgrade Soils due to Repeated Loadings”, TRR 537. Plancher, H., S. Dorrence, and J. C. Petersen. 1977.” Identification of Chemical Types in Asphalts Strongly Absorbed at the Asphalt–Aggregate Interface and Their Relative Displacement by Water”. Proc., Association of Asphalt Paving Technologists, Vol. 46, pp. 151–175. SCRB/R9 (2003). “General Specification for Roads and Bridges”, Section R/9, Hot-Mix Asphalt Concrete Pavement, Revised Edition. State Corporation of Roads and Bridges, Ministry of Housing and Construction, Republic of Iraq. Sebaaly, P.E., Hitti, E. and Weitzel, D. 2003. “Effectiveness of Lime in Hot Mix Asphalt Pavements.” Transportation Research Record: Journal of the Transportation Research Board, No. 1832, Transportation Research Board of the National Academies, Washington, D.C. Sebaaly, P. E., (2006),” The Benefits of Hydrated Lime in Hot Mix Asphalt”, National Lime Association. Shahrour, M. A., and Saloukeh, B. G.(1992).” Effect of Quality and Quantity of Locally Produced Filler (Passing Sieve No. 200) on Asphaltic Mixtures in Dubai”. In Effects of Aggregates and Mineral Fillers on Asphalt Mixtures Performance, SPT 1147 (R. C. Meininger, ed.), ASTM, Philadelphia, Pa., pp. 187–208.
52 | P a g e Unauthenticated | 96.22.13.112 Download Date | 5/12/14 3:03 AM
The International Journal of Pavement Engineering and Asphalt Technology (PEAT) ISSN 1464-8164. Volume: 14, Issue: 2, December 2013, pp.53-66
MECHANICAL PERFORMANCE OF BITUMINOUS CONCRETE INCORPORATING STEEL SLAG WITH NATURAL AGGREGATE Satish Pandey, Scientist*, CSIR-Central Road Research Institute, Mathura Road, New Delhi 110025, India, Dr. P.K.Jain, Chief Scientist, CSIR-Central Road Research Institute, Mathura Road, New Delhi 110025, India, *Corresponding mail ID:
[email protected]
doi: 10.2478/ijpeat-2013-0003
ABSTRACT India has world’s second largest road network in terms of length with a total road length of 4.24 million km. Hot mix bituminous pavement contributes around 50% road length to this vast road network. Large scale highway construction in India, emanating from rapid development, has caused massive depletion of scarce natural aggregate. This paper addresses this problem by investigating the influences of the utilization of steel slag as a coarse aggregate on the properties of hot mix bituminous concrete. Physical characteristics of bituminous mix ingredients i.e natural aggregate, steel slag aggregate and bituminous binder were determined to find out their compliance with Ministry of Road Transport and Highway Specification for Road and Bridge Works in India. Mechanical characteristics of bituminous mixes i.e Unmodified (having natural aggregate) and Modified (having steel slag as coarse aggregate) were determined using Marshall Method of mix design. Unmodified and Modified mixes were subjected to an array of performance tests to check out the suitability of steel slag aggregates for the preparation of high performance bituminous concrete mix. The performance tests includes, retained Marshall Stability, indirect tensile strength, static creep test, wheel-tracking test and resilient modulus test. The laboratory study confirmed the improvement in various mechanical properties of steel slag modified mixes besides reduction in temperature and moisture susceptibility. Key Words: Steel Slag Aggregate, Natural aggregate, Bituminous Mix, Bituminous Pavement.
INTRODUCTION The development of the highway construction industry in India under the aegis of National Highway Development Program (NHDP), has posed great demand of natural aggregates for road construction. As the resources for naturally occurring aggregates diminished at an ever increasing rate, road industries are keen to utilize recycled and waste materials in road construction in harmony with sustainable development. Steel slag, a waste product from the steel making industry, is one of the recycled materials reported to exhibit great potential to replace naturally occurring aggregates in bituminous mixes. Page | 53 Unauthenticated | 96.22.13.112 Download Date | 5/12/14 3:03 AM
The International Journal of Pavement Engineering and Asphalt Technology (PEAT) ISSN 1464-8164. Volume: 14, Issue: 2, December 2013, pp.53-66
Metallurgical waste particularly steel slag, generated in India is mostly collected by the waste producers themselves and partly by the companies doing separate collection of waste as their primary activity. The generated steel slag waste is partly recovered and returned to the production process (reuse) and part of the waste is sometimes used by other industries as secondary raw material (recycling), whereas the largest part still ends on often non-regulated landfills as industrial waste in adjoining areas. Disposal of steel slag as landfills are particularly hazardous for the environment. Steel slag, a by-product from the steel making process had been reported to exhibit great potential as a replacement for natural aggregates in road construction (Bagampadde U., et al,1999; Juan M. M., et al,2005; Hunt L., et al,2000). Besides having better mechanical properties than natural aggregates, steel-slag aggregates have been reported to retain heat considerably longer than natural aggregates (Hamzah O. M., et al,2008). The heat retention characteristics of steel-slag aggregates can be advantageous for HMA construction, as less gas (energy) is used during the execution of asphaltic concrete works. Mladen F.,et.al. 2010, explored the possible utilization of Basic Oxygen Furnace (BOF) slag in asphalt concrete. Their study confirmed that the asphalt produced with BOF slag exhibit good resistance to permanent deformation, high stability with good flow properties and high stiffness modulus.
India is the 4th largest steel producer in the world with total steel production of 72 MT per annum. Steel slag generated in steel manufacturing industries obtained from Basic Oxygen Furnace (BOF) and Electric Arc Furnace (EAF), is another waste from iron and steel industries in India. It is non-hydraulic and crystalline in nature and rich in Fe2O3 content (20-30 percent). The limited use of steel slag in Indian steel plants (less than 30%, mainly used in sinter plant as lime substitute) and use of recovered metallic’s in steel making remains a matter of concern for steel industries (CPCB Report,2006-07). In contrast in developed countries, the use of steel slag as construction material ensuring 100% utilization. Harsco India Private Limited which deals in Slag Co Products approached CSIR-CRRI for laboratory evaluation of processed steel slag aggregates to find out its suitability in road construction. Steel slag generated in Electric Arc Furnace (EAF) is considered for laboratory evaluation.
OBJECTIVES Most projects in India involving steel slag aggregates as construction material are using this recycled aggregate in lower quality applications such as road bases rather than wearing course. The aim of this research is to study the performance of steel slag as road pavement aggregates compared to the conventional use of silicious aggregates for the same purpose. The detailed objectives are outlined below: (1)
To assess the physical and mechanical characteristics of steel slag aggregate to find out its suitability in high performance bituminous concrete mix.
Page | 54 Unauthenticated | 96.22.13.112 Download Date | 5/12/14 3:03 AM
The International Journal of Pavement Engineering and Asphalt Technology (PEAT) ISSN 1464-8164. Volume: 14, Issue: 2, December 2013, pp.53-66
(2) To assess the performance of bituminous concrete mix prepared using steel slag aggregate with siliceous natural aggregate and bituminous concrete mix having 100 % natural siliceous aggregates. (3) To evaluate the effect of moisture and temperature on the performance of mixes incorporating steel slag. (4) To compare the performance of Steel slag modified mix and Unmodified mix having natural aggregates.
MATERIALS AND METHODS The study is divided into three main phases. The first is related to the physicochemical characterization of the steel slag aggregate, natural aggregate and bitumen. The second phase deals with bitumen mix designs which were two mixes; One with an integrated slag-natural aggregate matrix (Steel slag modified mix) and one with only natural aggregates (Unmodified Mix) used as a control mix. Third phase covers the various performance tests carried out to assess mechanical characteristics of steel slag modified and unmodified mix. Material Used The processed steel slag aggregates used in the study was supplied by HARSCO India Private Limited. Steel Slag was generated as a melt at about 1650°C during steelmaking from hot metal, direct reduced iron or scrap. It consisted of oxidized co-elements of the hot metal and other metallic charges which reacted with the added limestone and dolomite. Depending on the process technology, one could distinguish Basic Oxygen Furnace (BOF) and Electric Arc Furnace (EAF) slag. The chemical composition of EAF steel slag used in the study is given in Table 1. Calcium oxide (CaO), iron oxide (FeO) and silica (SiO2) are the three major chemical constituents of both EAF and BOF slags. Due to the presence of unstable phases in its mineralogy, steel slag can show volumetric instability, caused mainly by the presence of free CaO. In the presence of water, free lime hydrates and forms portlandite (Ca(OH)2). Portlandite has a lower density than CaO and hence, hydration of free CaO results in volume increase (Irem Z. Y. et al, 2011). In order to reduce the expansibility of steel slag aggregate, several aging methods can be used like air aging, hotwater aging and steam aging; under first method steel slag is left out in the open for 1 month for weathering through air (air aging), in the second method i.e hot water aging steel slag is immersed in hot water at 80 ± 3 oC temperature for 1 day or 3 days and the last method exposes steel slag aggregate to steam at 1000C for over 3 days (steam aging) (Han Y. M., et al, 2002) .
Page | 55 Unauthenticated | 96.22.13.112 Download Date | 5/12/14 3:03 AM
The International Journal of Pavement Engineering and Asphalt Technology (PEAT) ISSN 1464-8164. Volume: 14, Issue: 2, December 2013, pp.53-66
Table 1: Chemical Composition of Steel Slag S.No. 1)
Type of Oxide
Oxide Content %
Calcium
- CaO
42.0
2)
Iron
- FeO
17.7
3)
Silica
- SiO2
17.2
4)
Magnesium
- MgO
7.2
5)
Aluminium
- Al2O3
7.1
6)
Manganese
- MnO
4.3
7)
Phosphorous
- P2O5