Evolutionary Bioinformatics
O r i g i n al Resea r c h
Open Access Full open access to this and thousands of other papers at http://www.la-press.com.
EvoluCode: Evolutionary Barcodes as a Unifying Framework for Multilevel Evolutionary Data Benjamin Linard1, Ngoc Hoan Nguyen1, Francisco Prosdocimi2, Olivier Poch1 and Julie D. Thompson1 Laboratoire De Bioinformatique Et Génomique Intégratives, Institut de Génétique et de Biologie Moléculaire et Cellulaire CNRS/INSERM/UDS, Illkirch, France. 2Federal University of Rio de Janeiro, Rio de Janeiro, Brazil. Corresponding author email:
[email protected] 1
Abstract: Evolutionary systems biology aims to uncover the general trends and principles governing the evolution of biological networks. An essential part of this process is the reconstruction and analysis of the evolutionary histories of these complex, dynamic networks. Unfortunately, the methodologies for representing and exploiting such complex evolutionary histories in large scale studies are currently limited. Here, we propose a new formalism, called EvoluCode (Evolutionary barCode), which allows the integration of different evolutionary parameters (eg, sequence conservation, orthology, synteny …) in a unifying format and facilitates the multilevel analysis and visualization of complex evolutionary histories at the genome scale. The advantages of the approach are demonstrated by constructing barcodes representing the evolution of the complete human proteome. Two large-scale studies are then described: (i) the mapping and visualization of the barcodes on the human chromosomes and (ii) automatic clustering of the barcodes to highlight protein subsets sharing similar evolutionary histories and their functional analysis. The methodologies developed here open the way to the efficient application of other data mining and knowledge extraction techniques in evolutionary systems biology studies. A database containing all EvoluCode data is available at: http://lbgi.igbmc.fr/barcodes. Keywords: systems biology, evolutionary history, multilevel data analysis, data representation, data visualization, data mining
Evolutionary Bioinformatics 2012:8 61–77 doi: 10.4137/EBO.S8814 This article is available from http://www.la-press.com. © the author(s), publisher and licensee Libertas Academica Ltd. This is an open access article. Unrestricted non-commercial use is permitted provided the original work is properly cited. Evolutionary Bioinformatics 2012:8
61
Linard et al
Introduction
Systems biology aims to understand the structure and dynamic behavior of complex biological systems by modeling the components and their interactions at different functional levels.1,2 Such a comprehensive understanding requires the integration of large-scale experimental data with computational analyses and mathematical modeling approaches.3 In particular, successful systems biology will rely on our ability to integrate different types of multi-scale data across various levels of complexity,4 from individual molecules such as proteins, metabolites, etc. to cells, tissues, organisms or even ecosystems. These different levels are now being described by the large volumes of experimental data resulting from genomics technologies such as next-generation sequencing, transcriptomics, interactomics, etc. This high throughput data is characterized by a low signalto-noise ratio and data mining and extraction of significant, pertinent knowledge are major challenges. In this context, the field of evolutionary systems biology aims to combine the modeling aspects of current systems biology with the long-standing quantitative experience in evolutionary genetics in order to uncover the general trends and principles underlying the evolution and function of complex biological networks.5,6 Evolutionary based inference provides an incredibly powerful tool for comparing multiple sources of data, since features that are maintained in several organisms tend to be functionally important while variations or differences may indicate key innovations. Comparative studies of individual components, such as proteins, have been widely used and are generally based on multiple sequence alignments and the subsequent reconstruction of a phylogenetic tree. Evolutionary histories are then typically represented by mapping major events (duplications, speciations, gene loss, domain reorganization, etc.) onto the tree. Some recent work has applied these methodologies at the genome scale, for example to build the complete collections of gene phylogenies (phylomes) in the PhylomeDB database,7 or in the construction of the Chordate Proteome History Database (ioda.univ-provence.fr). At the level of protein networks or pathways, the reconstruction of the evolutionary histories is more complex, since the interactions between the different
62
molecular components have to be taken into account and changes at one biological level often have consequences on the evolution of other levels.8–11 Therefore, additional information concerning genome context, gene expression, molecular interactions, etc. is needed to successfully model the dynamic behavior of the system. A number of groups have performed genome-scale studies aimed at investigating the potential correlations between variables characterizing different aspects of protein network functions and evolution.12–14 For example, positive correlations were observed between gene essentiality, duplicability and protein connectivity, estimated by the number of interaction partners in the networks.15,16 Other recent studies have shown negative correlation between expression breadth, ie, the number of tissue types in which genes are expressed, and protein evolutionary rates.17 While these studies were limited to the correlations observed between two variables, others have attempted to compile more diverse sets of evolutionary variables. Thus, principal component analysis was used to investigate the relationships between seven genomerelated variables, identifying three main axes reflecting a gene’s “importance”, “plasticity” and “adaptability”.18 Waterhouse et al also examined the links between evolutionary and functional traits, by classifying metazoan orthologs as “essential” or “nonessential” and confronting these classes with various evolutionary variables.19 Although these studies have revealed several interesting trends, new standardized methodologies and tools are now needed that allow the integration of larger, more diverse sets of multilevel data and efficient, quantitative analyses at the genome scale. Similarly, despite some attempts to develop tools providing global overviews of complex evolutionary scenarios,20 original visualization tools will be required to facilitate rapid identification of specific behaviors. Here we describe a novel formalism, called EvoluCode, or the Evolutionary barCode, which allows the integration of different data types in a unifying framework. Thus, a barcode is assigned to each component in a biological system and diverse evolutionary parameters from different biological levels can be incorporated, facilitating multi-scale evolutionary analyses. Visualization tools have also
Evolutionary Bioinformatics 2012:8
Evolutionary barcodes for multilevel data analysis
been developed to allow the human expert to view the barcodes and to identify interesting patterns in both low and high throughput studies. In order to evaluate the pertinence of the evolutionary barcodes and to test their ability to represent complex evolutionary histories, we constructed evolutionary barcodes for the complete proteomes of 17 vertebrate species. In this context, we incorporated a number of different evolutionary variables, including primary sequence data, genome neighborhood and evolutionary conservation, but the barcode formalism can be easily extended to incorporate other variables representing different biological features. At this stage, the values of the barcode parameters are normalized to allow quantitative analyses and automatic comparisons, using standard data mining techniques such as clustering or classification. We show that, in addition to highlighting general evolutionary trends, the barcodes facilitate the identification of specific evolutionary histories, such as strict conservations or significant gene family expansions. Two genome-scale analyses were then performed. First, by mapping the protein barcodes onto the human genome and visualizing the results in our barcode visualization tool, we were able to identify a number of previously described chromosome gene clusters. Second, automatic barcode clustering and functional enrichment analysis allowed us to identify specific sets of proteins that have experienced similar evolutionary histories. In a more detailed study, automatic clustering of multi-pass membrane proteins highlighted a number of particular evolutionary trends that are inherent to these protein families. Finally, as a proof of concept we demonstrate the potential of our evolutionary barcodes for biological pathway analysis. All data described in this publication are available online at: http://lbgi.igbmc.fr/barcodes.
Material and Methods Protein test set
A reference set of human proteins was retrieved from the Human Protein Initiative (HPI) project.21 This project defined a master human proteome set, according to the quality standards set by the UniprotKB/SwissProt22 databases, resulting in a total of 19778 human reference protein sequences (with 1 protein reference per coding gene). We created our own database of vertebrate proteomes, by selecting an additional
Evolutionary Bioinformatics 2012:8
16 vertebrate species that best represent major vertebrate phyla, ie, fish, batracia, sauropsida and mammals (species list in supplementary Table 1). The complete proteomes for these organisms were downloaded from Ensembl (version 51),23 to create a local database with more than 500,000 sequences. Each human protein was then used as a query for a BlastP24 search in this local protein sequence database.
Multiple sequence alignment construction
For each human reference sequence, a modified version of the PipeAlign25 protein analysis pipeline was used to construct a MACS (Multiple Alignment of Complete Sequences) for all sequences detected by the BlastP search with E , 10–3 (maximum sequences = 500). PipeAlign integrates several steps, including post-processing of the BlastP results, construction of a MACS with DbClustal,26 verification of the MACS with RASCAL27 and removal of unrelated sequences with LEON.28 In this modified version, DbClustal was replaced by the MAFFT program,29 since the computational speed of MAFFT is better suited to high throughput projects. The MACS obtained from this pipeline were then annotated with structural and functional information thanks to MACSIMS,30 an information management system that combines knowledge-based methods with complementary ab initio sequence-based predictions. MACSIMS integrates several types of data in the alignment, in particular Gene Ontology annotations,31 functional annotations and keywords from Swissprot, and functional/structural domains from the Pfam database.32
Local genome neighborhood conservation
The chromosomal localization of all genes coding for the protein sequences was obtained from Ensembl. Locally developed software was used to identify conserved local synteny between the human genome and each of the 16 other vertebrate genomes. To achieve this, the chromosomes in each genome are represented as a linear sequence of genes. For each human reference sequence, the local syntenic homolog HREF was defined at position i on the human genome and its upstream and downstream neighbors (HREF-1
63
Linard et al
and HREF+1 respectively) were identified. For each of the 16 vertebrate genomes, the sequences with the highest similarity to HREF-1 and HREF+1 were selected from the MSA, and denoted Vn_Sim-1 and Vn_Sim+1 respectively, where Vn refers to one of the 16 vertebrate genomes. A local synteny homolog, exists for HREF and genome Vn if: i. homologs were found in Vn for HREF-1 and HREF+1, ii. the separation between the highest similarity homologs, denoted Vn_Sim-1 and Vn_Sim+1, on the genome was less than 5 genes, iii. a homolog of HREF was found on the genome between Vn_Sim-1 and Vn_Sim+1. The homolog of HREF localized between Vn_Sim-1 and Vn_Sim+1 with the highest similarity to the human reference sequence was then defined as the syntenic homolog. Genes with ambiguous genomic locations, such as scaffolds etc, were discarded since the synteny relationship could not be reliably established. In addition, local or tandem duplications were excluded since the genome contexts of the two gene copies were similar.
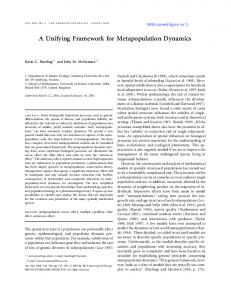
a number of different evolutionary parameters that were extracted from the annotated multiple alignments, synteny analysis and orthology data described above (Fig. 1A). For each of the vertebrate organisms included in this work, the most closely related homolog (based on percent residue identity) was identified in the MACS and seven parameters were extracted: • length: the length of the vertebrate sequence. • length_difference: the difference in length between the human reference protein and the vertebrate A
N parameters (A,B…N)
Barcode construction for the human proteome
Evolutionary barcodes were constructed for all human reference proteins. Each barcode includes
64
Multiple sequence alignment data Orthology/paralogy data Synteny conservation …
Data normalisation and Statistical description for each parameter compilation
B
Color Formalism Param. A
Orthology data
Orthologs are homologous genes that diverged from a single ancestral gene in their most recent common ancestor via a speciation event, whereas paralogs are homologs resulting from gene duplications.33 Paralogs are considered as “inparalogs” when they are produced by duplication(s) subsequent to a given speciation event. In this context, several inparalogs of a given species (recently duplicated genes) are “co-orthologs” relative to the non-duplicated ortholog of a second species. Orthologous relationships were generated with the OrthoInspector software.34 Orthology inference is based on a blast all- vs. -all generated with a 10-9 Expect value threshold. Each human reference sequence was used as a query to retrieve human inparalogs and coorthologs in each of the 16 vertebrate organisms.
Evolutionary data from multiple biological levels
B Param. N
2D Barcode Dimension (N × n): parameter values for each species Dimensional reduction
C
Deviation estimation compared to observed general trends
A 1D-Barcode B C D Dimension N: 1 “average” value for each parameter E
A B C D E
Evolutionary history analysis Figure 1. Schematic view of the methodology used to produce the barcodes representing the evolutionary histories of the human proteome. Three main steps are shown. (A) Multiple evolutionary parameters are selected and described statistically. (B) The values of these parameters for different species are compiled in a 2D barcode. The statistical description of these parameters is used to define a colour code for the barcode. (C) For each barcode, a lower dimensional barcode (1D-barcode) is generated.
Evolutionary Bioinformatics 2012:8
Evolutionary barcodes for multilevel data analysis
•
• •
•
•
sequence. This parameter may indicate potential genetic events, such as exon/domain gains or losses, but may also highlight protein fragments or sequence prediction errors. no_of_regions: the number of conserved regions defined by MACSIMS and shared between the human reference protein and the vertebrate sequence. sequence_identity: the percent residue identity shared between the human reference protein and the vertebrate sequence. no_of_domains: the number of known protein domains in the vertebrate sequence. These domains are based on annotations from the Pfam database. domain_conservation: a qualitative parameter indicating changes in the domain structure of the vertebrate sequence compared to the human reference protein. This parameter identifies an unchanged domain organization, domain gains, domain losses or domain shuffling. hydrophilicity: the average hydrophilicity of the vertebrate sequence.
Two parameters, representing orthology/paralogy data were also extracted from the OrthoInspector database:
• synteny: categorical parameter with 3 values: (i) synteny on both sides of the gene, (ii) synteny either downstream or upstream of the gene (iii) no synteny. All these evolutionary parameters were then organized in a 2D matrix, which we will refer to as the “2D-barcode” (Fig. 1B). Each row of the 2D-barcode represents one parameter (denoted A, B … to N). Each column of the 2D-barcode represents one species (denoted 1, 2 … n) and the intersection between rows and columns corresponds to the value or the state of one specific parameter, in one particular species. To facilitate visualization of the 2D-barcode, a color is assigned to each matrix cell representing typical or atypical parameter values (Fig. 1B). To do this, the distribution of each parameter in each organism is first described by the sample percentiles, using the Emerson-Strenio formulas35 implemented in the R software. These nonparametric statistics are used to avoid bias due to non-Gaussian distributions of some of the parameters. The Emerson median, whiskers and hinges are then used to define three intervals that are assigned color gradients. The first interval (IT1) is assigned a blue-to-green gradient and represents values that are lower than what is generally observed for a specific parameter in a specific organism:
median - lower_ hinge _ 1 = ∈ ≤ ≤ + IT x | lower _ whisker x lower hinge 2
• inparalog: the number of human inparalogs with respect to the specific vertebrate organism. This parameter represents the recent duplicability of a human gene compared to the other species. • co-ortholog: the number of co-orthologs in the specific vertebrate species with respect to human. This parameter indicates the number of gene duplications in the non human lineage. Finally, a parameter representing the genome neighborhood between the human and each vertebrate species was calculated:
Evolutionary Bioinformatics 2012:8
The second interval IT2 (green color) represents values that correspond to what is generally observed for a specific parameter in a specific organism.
IT 2 = { x ∈ | IT 1 < x < IT 3}
The third interval (IT3) is assigned a green-to-red gradient and represents values that are higher than what is generally observed for a specific parameter in a specific organism.
65
Linard et al
upper_hinge - median IT 3 = x ∈ | median + x upper ≤ ≤ _whi sker 2 Finally, the 2D-barcodes are reduced to a single dimension (Fig. 1C), called the 1D-barcode. The 1D-barcode is a simple vector representing the “average” state of each evolutionary parameter for the complete set of vertebrate species considered and is designed to facilitate inter barcode comparisons and clustering. The 1D-barcode values are produced by calculating phylum-weighted means: (i) for each parameter, a mean is calculated for 4 phyla: mammals, sauropsida, amphibians and teleostei, (ii) these phylum means are used to calculate a new mean that is the final value for a specific parameter of the 1D-barcode. As in the 2D-barcode, a color is assigned to each 1D-barcode parameter value based on the sample percentiles, for visualization purposes. However, in contrast to the 2D-barcodes, these percentiles are not organism related. They are based on the phylum weighted mean parameter values from the complete set of 1D-barcodes.
Barcode clustering and analysis
O enrichment
The complete set of 1D-barcodes representing the human proteome were used for the clustering analysis, although barcodes with missing values were removed from the test set, leaving a total of 19465 barcodes. Each 1D-barcode was represented by a vector of real values, X = (x1,x2,…xn) and the distance, d(X,Y) between two barcodes was defined as: d ( X ,Y ) =
n
2
∑ (x - y ) i =0
i
i
2
The distance between each pair of barcodes was calculated and the complete pairwise distance matrix as used as input to a clustering program that implements an improved Potts clustering model.36 The Potts clustering approach, also known as super-paramagnetic clustering, is based on the physical behavior of an inhomogeneous ferromagnet.37 No assumptions are made about the underlying distribution of the data. Briefly, a Potts spin variable is assigned to 66
each data point and short range interactions between neighboring points are introduced. Spin-spin correlations are measured by a Monte Carlo procedure and are used to partition the data points into clusters. The GoMiner software38 was then used to analyze the GO enrichment of the resulting barcode clusters. The complete set of human reference sequences was used as a background gene list. As stated by the GoMiner authors, the calculated P-values should be considered as heuristic measures, useful as indicators of possible statistical significance, rather than as the results of formal inference. The P-values can be used, for example, to sort categories to identify those of the most potential interest. In this work, a cluster was considered to be enriched in a GO term if the associated P-value was ,0.05, the recommended value for high-throughput GoMiner. We then sorted the clusters according to their mean P-values and selected several top ranking clusters for further manual analysis.
Barcode website
All the data presented in this publication are available online at the following address: http://lbgi.igbmc. fr/barcodes. The website interface allows the user to browse all the human barcodes, as well as the annotated multiple alignments corresponding to each barcode. Barcodes can be selected by textual searches with Uniprot and Ensembl identifiers or by uploading a Fasta sequence followed by a BlastP search. The results of two high throughput analyses are also available: the mapping of all the 1D-barcodes on the human chromosomes and the clustering of the 1D-barcodes generated by the Potts model.
Results and Discussion Design of the barcode
The objective of the EvoluCode evolutionary barcode is to integrate heterogeneous biological data from different biological levels in order to highlight new evolutionary patterns or scenarios that could not be detected using only one kind of data (genomic context data, sequence data, expression data …).
Evolutionary Bioinformatics 2012:8
Evolutionary barcodes for multilevel data analysis
In this study, we applied the barcode formalism to the human proteome to study vertebrate evolution. This barcode (described in detail below) includes data from 17 vertebrate species and 10 evolutionary parameters, representing different biological levels, from the genomic level (synteny) to the clade level (number of co-orthologs). Nevertheless, the barcode can theoretically be of any dimension N × n, with a parameter and species composition depending on the objectives or evolutionary scale (eg, primates, vertebrates, e ukaryotes…) of the study. The barcode combines both continuous parameters, such as sequence conservation or hydrophobicity, and discontinuous parameters, such as local synteny conservation or domain organization. Since the different parameters have very heterogeneous distributions (multi-modal, exponential, normal distribution…) they cannot be described using a single statistical model. We therefore developed a methodology to normalize the values of any given parameter using simple percentile statistics, which are suitable for any kind of parameter distribution. For visualization purposes, the normalized parameters are color-coded to highlight values that are inferior or superior to what is generally observed in a given species. In order to summarize the diverse data inherent to the 2D-barcode approach, each barcode can also be represented in 1D. The 1D-barcode is thus a vector of continuous values representing the phylum-weighted average state of each evolutionary parameter. In the case of the human proteome barcodes, the 1D-barcode represents the average values observed during the vertebrate evolutionary history. As in the 2D-barcode, the parameters are color-coded to highlight the “expectedness” of a particular value.
Representation of complex evolutionary histories: the human proteome
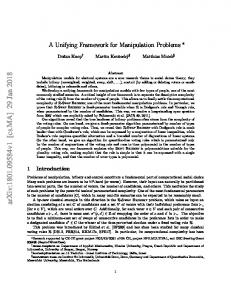
To demonstrate the applicability of the EvoluCode formalism, we constructed barcodes to represent the evolutionary histories of the complete human proteome since the appearance of the vertebrates. Thus, for 19778 human genes, a representative reference protein was selected and homologs were identified in 16 complete genomes of vertebrate organisms (see Material and Methods). We then constructed 19778 multiple sequence alignments that were annotated with known structural and functional Evolutionary Bioinformatics 2012:8
information. In addition, we estimated the synteny between the 19778 human genes and the 16 vertebrate genomes. Finally, orthologous relationships between human and the 16 vertebrates were inferred. Based on these data, we extracted various evolutionary parameters, representing primary sequence characteristics, domain organization, phylogenetic distribution and genome neighborhood conservation. These parameters were then integrated to form an evolutionary barcode representing each human reference protein. Some typical examples of barcodes, representing genes with heterogeneous and complex evolutionary histories, are shown in Figure 2 and described in detail below. The first example (Fig. 2A) corresponds to the glucagon receptor (reference protein GLR_HUMAN). This receptor is essential for blood glucose level regulation, an essential function for all vascular animals.39 For all parameters; the 2D-barcode displays homogenous states over all vertebrates, implying that relatively few genetic events have affected this gene during vertebrate evolution. The second example (Fig. 2B) corresponds to the barcode of a gene integrated from an endogenous retrovirus (reference protein POK12_HUMAN). In our barcode construction procedure, the human gene was associated with genes from the other vertebrate species that have also integrated endogenous retrovirus genes, characterized by specific sequence motifs. Consequently, the phylogenetic distribution of this barcode is dispersed. Moreover, these genes generally produce polyprotein products, explaining the heterogeneity observed for the number of domains and the fact that these sequences are not detected as orthologs. The third example (Fig. 2C) represents a gene specific to the rodent and primate lineages (reference protein DPPA3_HUMAN). This gene appeared recently in the mammalian lineage and was previously characterized as playing a role in developmental cell pluripotency and in adult sexual organs.40 The protein product of this gene has several unusual characteristics. Despite its recent evolutionary history, it has very low sequence conservation, with 78% percent identity between human and macaque and only 37% between human and mouse. This is supported by heterogeneous hydrophobicity scores in the different species. Such rapid divergence for reproductive proteins is a wellknown phenomena.41 67
Linard et al A
C
GLR_HUMAN
DPPA3_HUMAN
Length Length_difference No_of_regions Sequence_identity No_of_domains Domain_conservation Hydrophilicity Synteny Inparalog Co-ortholog
D
s di iri us ov at gr le ni cu on s a od eu tra ost Te ter rio es is as re ip al G io lat ic us in an s op at a D zia s tr ry u s an tic O op allu us es n g h m Xe lus ync do al r is G itho lph lus rn e al O od ab on c M us rus u u s Eq ta pu llus s s lu e u Bo nis orc gic a p e C ia orv s av n lu C tus scu ta at u la us R s m mu ae u a m M cac yg a p M ngo Po